- Economy of the United States
-
Economy of United States 
Rank 1st (nominal) / 1st (PPP) Currency US$ (USD) Fiscal year October 1 – September 30 Statistics GDP $13.610 trillion (nominal) [1]
$15.227 trillion (PPP)[1]GDP growth 3.0% (2010)[1] GDP per capita $46,844 (2010)[2] (10th, nominal; 7th, PPP) GDP by sector agriculture: (1.2%), industry: (21.9%), services: (76.9%) (2009 est.) Inflation (CPI) 3.9% (September 2011)[3] Population
below poverty line15.1% (2010)[4] Gini index 45 (List of countries) Labor force 154.198 million (includes 13.897 mil. unemployed, Oct. 2011) [5] Labor force
by occupationfarming, forestry, and fishing: 0.7% manufacturing, extraction, transportation, and crafts: 20.3% managerial, professional, and technical: 37.3% sales and office: 24.2% other services: 17.6%
note: figures exclude the unemployed (2009)Unemployment 9.0% (October 2011) [5] Main industries petroleum, steel, motor vehicles, aerospace, telecommunications, chemicals, creative industries, electronics, food processing, consumer goods, lumber, mining, defense, biomedical research and health care services, computers and robotics Ease of Doing Business Rank 4th[6] External Exports $1.280 trillion f.o.b (2010)[1] Export goods agricultural products (soybeans, fruit, corn) 9.2%, industrial supplies (organic chemicals) 26.8%, capital goods (transistors, aircraft, motor vehicle parts, computers, telecommunications equipment) 49.0%, consumer goods (automobiles, medicines) 15.0% (2009) Main export partners Canada, 13.2%; Mexico, 8.3%; China, 4.3%; Japan, 3.3%. (2009)[7] Imports $1.948 trillion c.i.f. (2010)[1] Import goods agricultural products 4.9%, industrial supplies 32.9% (crude oil 8.2%), capital goods 30.4% (computers, telecommunications equipment, motor vehicle parts, office machines, electric power machinery), consumer goods 31.8% (automobiles, clothing, medicines, furniture, toys) (2009) Main import partners China, 15.4%; Canada, 11.6%; Mexico, 9.1%; Japan, 4.9%; Germany, 3.7%. (2009)[7] FDI stock $2.398 trillion (December 31, 2009 est.) Gross external debt $14.39 trillion (30 Sept 2010)[8] Public finances Public debt $14.972 trillion [9] 99.7% of GDP Revenues $2.302 trillion (2011)[10] Expenses $3.601 trillion (2011)[10] Economic aid ODA $19 billion, 0.2% of GDP (2004)[11] Credit rating Foreign reserves US$140.607 billion (May 2011)[15] Main data source: CIA World Fact Book
All values, unless otherwise stated, are in US dollars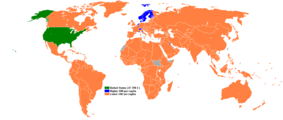 GNI per capita:
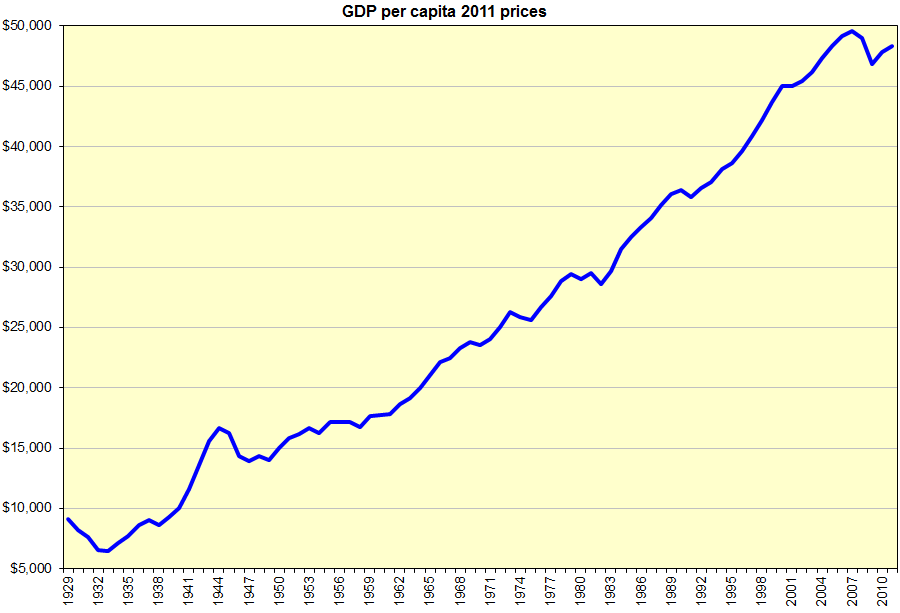
United States(47,240 $)Higher GNI per capita compared to United StatesLower GNI per capita compared to United States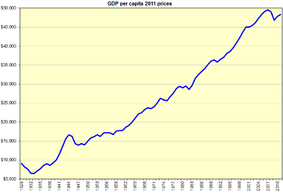 Historical GDP per capita
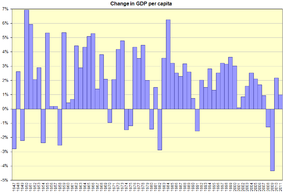 GDP per capita growth
- Throughout this article, the unqualified term "dollar" and the $ symbol refer to the US dollar.
The economy of the United States is the world's largest national economy. Its nominal GDP was estimated to be nearly $14.7 trillion in 2010,[1] approximately a quarter of nominal global GDP.[16][17] Its GDP at purchasing power parity was also the largest in the world, approximately a fifth of global GDP at purchasing power parity.[16] The U.S. economy also maintains a very high level of output per capita. In 2010, it was estimated to have a per capita GDP (PPP) of $46,844, the 7th highest in the world.[2] The U.S is the largest trading nation in the world. Its three largest trading partners as of 2010 are Canada, China and Mexico.
The economy of the United States is a mixed economy[18][19] and has maintained a stable overall GDP growth rate, a low unemployment rate, and high levels of research and capital investment. It has been the world's largest national economy since the 1870s.[20][21] Most of the economy is classified as services. The country remains the world's largest manufacturer, representing a fifth of the global manufacturing output. The United States is home to 139 of the world's 500 largest companies, which is almost twice that of any other country.[22] About 60% the global currency reserves has been invested in the United States dollar and only 24% in euro. The country is one of the world's largest and most influential financial markets. Foreign investments made in the United States total almost $2.4 trillion, which is more than twice that of any other country.[23] American investments in foreign countries total over $3.3 trillion, which is almost twice that of any other country.[24] Total public and private debt was $50.2 trillion at the end of the first quarter of 2010, or 3.5 times GDP.[25] The proportion of public debt was about 0.9 times the GDP.[26][27] Domestic financial assets totaled $131 trillion and domestic financial liabilities totaled $106 trillion.[28] As of 2010, the European Union as a whole was the largest trading partner of the U.S., whereas Canada, China, and Mexico were the largest individual trading nations.[7]
The labor market in the United States has attracted immigrants from all over the world and its net migration rate is among the highest in the world. The United States is one of the top-performing economies in studies such as the Ease of Doing Business Index, the Global Competitiveness Report[29], and others.
Contents
Historical summary
Further information: Economic history of the United StatesEarly development
The economic history of the United States has its roots in European settlements in the 16th, 17th, and 18th centuries. The American colonies went from marginally successful colonial economies to a small, independent farming economy, which in 1776 became the United States of America. In 180 years the United States grew to a huge, integrated, industrialized economy that still makes up over a quarter of the world economy[citation needed]. The main causes were a large unified market, a supportive political-legal system, vast areas of highly productive farmlands, vast natural resources (especially timber, coal and oil), a cultural landscape that valued entrepreneurship, a commitment to investing in material and human capital, and at times a willingness to exploit labor. In addition, the U.S. was able to utilize these resources due to a unique set of institutions designed to encourage utilization and extraction.[citation needed] As a result, the U.S.'s GDP per capita converged on and eventually surpassed that of the U.K., as well as other nations that it previously trailed economically. The economy has maintained high wages, attracting immigrants by the millions from all over the world.[30]
In the 19th century, recessions frequently coincided with financial crises.
The Panic of 1837 was followed by a five-year depression, with the failure of banks and then-record-high unemployment levels.[31] Because of the great changes in the economy over the centuries, it is difficult to compare the severity of modern recessions to early recessions.[32] Recessions after World War II appear to have been less severe than earlier recessions, but the reasons for this are unclear.[33] The Depression of 1893 was one of the worst in American history, with the unemployment rate exceeding 10% for half a decade.[34]
Since the Great Depression
For many years following the Great Depression of the 1930s, when danger of recession appeared most serious, the government sought to strengthen the economy by spending heavily itself or cutting taxes so that consumers would spend more, and by fostering rapid growth in the money supply, which also encouraged more spending. Ideas about the best tools for stabilizing the economy changed substantially between the 1930s and the 1980s. From the New Deal era that began in 1933, to the Great Society initiatives of the 1960s, national policy makers relied principally on fiscal policy to influence the economy. The approach, advanced by British economist John Maynard Keynes, gave elected officials a leading role in directing the economy, since spending and taxes are controlled by the U.S. President and the Congress. The economy and living standards grew strongly during this era, but a period of high inflation, interest rates and unemployment after 1973 weakened confidence in fiscal policy as a tool for regulating the overall pace of economic activity.[35] Following a series of periodic credit tightening measures designed to combat inflation, a combination of loose monetary policy and record budget deficits, both financed with foreign direct investment and public debt, became routine economic policy after 1981.[citation needed]
The U.S. economy grew by an average of 3.8% from 1946 to 1973, while real median household income surged 55% (or 1.6% a year).[4][36] The economy since 1973, however, has been characterized by both slower growth (averaging 2.7%), and nearly stagnant living standards, with household incomes increasing by 10%, or only 0.3% annually.[4] The worst recession in recent decades, in terms of lost output, occurred during the 2008 financial crisis, when GDP fell by 5.0% from the spring of 2008 to the spring of 2009. Other significant recessions took place in 1957–58, when GDP fell 3.7%, following the 1973 oil crisis, with a 3.1% fall from late 1973 to early 1975, and in the 1981–82 recession, when GDP dropped by 2.9%.[37][38] Recent, mild recessions have included the 1990–91 downturn, when output fell by 1.3%, and the 2001 recession, in which GDP slid by 0.3%; the 2001 downturn lasted just eight months.[38] The most vigorous, sustained periods of growth, on the other hand, took place from early 1961 to mid 1969, with an expansion of 53% (5.1% a year), from mid 1991 to late in 2000, at 43% (3.8% a year), and from late 1982 to mid 1990, at 37% (4% a year).[37]
Since 1976, the US has sustained trade deficits with other nations, and since 1982, current account deficits; the nation's long-standing surplus in its trade in services was maintained, however, and reached US$140 billion yearly in 2008 and 2009. In recent years, the primary economic concerns have centered on: high household debt ($11 trillion, including $2.5 trillion in revolving debt),[39] high net national debt ($9 trillion), high corporate debt ($9 trillion), high mortgage debt (over $15 trillion as of 2005 year-end), high unfunded Medicare liability ($30 trillion[citation needed]), high unfunded Social Security liability ($12 trillion)[citation needed], high external debt (amount owed to foreign lenders), high trade deficits, a serious deterioration in the United States net international investment position (NIIP) (−24% of GDP),[40] and high unemployment.[41] In 2006, the U.S economy had its lowest saving rate since 1933.[42] These issues have raised concerns among economists and national politicians.[43]
The United States economy experienced a crisis in 2008 led by a derivatives market and subprime mortgage crisis, and a declining dollar value.[44] On December 1, 2008, the NBER declared that the United States entered a recession in December 2007, citing employment and production figures as well as the third quarter decline in GDP.[45] The recession did, however, lead to a reduction in record trade deficits, which fell from $840 billion annually during the 2006–08 period, to $500 billion in 2009,[37][46] as well as to higher personal savings rates, which jumped from a historic low of 1% in early 2008, to nearly 5% in late 2009. The merchandise trade deficit rose to $670 billion in 2010; savings rates, however, remained at around 5%.[47]
In 1980, the U.S. public debt was $909 billion – or an amount equal to 33.3% of America's gross domestic product (GDP). By 1990, that number had more than tripled to $3.2 trillion – or 55.9% of GDP.[48] In 2001 the national debt was $5.7 trillion; however, the debt-to-GDP ratio remained at 1990 levels.[49] Debt levels rose quickly in the following decade, and on January 28, 2010, the US debt ceiling was raised to $14.3 trillion dollars.[50] Based on the 2010 U.S. budget, total national debt will grow to nearly 100% of GDP, versus a level of approximately 80% in early 2009.[51] The White House estimates that the government’s tab for servicing the debt will exceed $700 billion a year in 2019,[52] up from $202 billion in 2009.[53]
The U.S. Treasury statistics indicate that, at the end of 2006, non-US citizens and institutions held 44% of federal debt held by the public.[54] China, holding $801.5 billion in treasury bonds, is the largest foreign financier of the record U.S. public debt.[55]
US share of world GDP (nominal) peaked in 1985 with 32.74% of global GDP (nominal). The second highest share was 32.24% in 2001.
US share of world GDP (PPP) peaked in 1999 with 23.78% of global GDP (PPP). The share has been declining each year since .]Overview
 United States wealth compared to the rest of the world in the year 2000
 Year-on-year change in total net worth of US households and nonprofit organizations 1946–2007, unadjusted for inflation or population change.
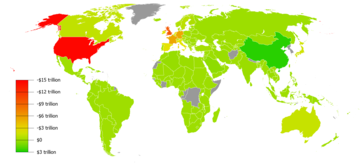 Foreign currency reserves and gold minus external debt based on 2010 data from CIA Factbook
A central feature of the U.S. economy is the economic freedom afforded to the private sector by allowing the private sector to make the majority of economic decisions in determining the direction and scale of what the U.S. economy produces.[56] This is enhanced by relatively low levels of regulation and government involvement,[57] as well as a court system that generally protects property rights and enforces contracts. Today, the United States is home to 29.6 million small businesses, 30% of the world's millionaires, 40% of the world's billionaires, as well as 139 of the world's 500 largest companies.[58][22][59][60] From its emergence as an independent nation, the United States has encouraged science and innovation. As a result, the United States has been the birthplace of 161 of Britannica's 321 Great Inventions, including items such as the airplane, internet, microchip, laser, cellphone, refrigerator, email, microwave, LCD and LED technology, air conditioning, assembly line, supermarket, bar code, electric motor, and ATM.[61]
The United States is rich in mineral resources and fertile farm soil, and it is fortunate to have a moderate climate. It also has extensive coastlines on both the Atlantic and Pacific Oceans, as well as on the Gulf of Mexico. Rivers flow from far within the continent, and the Great Lakes—five large, inland lakes along the U.S. border with Canada—provide additional shipping access. These extensive waterways have helped shape the country's economic growth over the years and helped bind America's 50 individual states together in a single economic unit.[62]
The number of workers and, more importantly, their productivity help determine the health of the U.S. economy. Throughout its history, the United States has experienced steady growth in the labor force, a phenomenon that is both cause and effect of almost constant economic expansion. Until shortly after World War I, most workers were immigrants from Europe, their immediate descendants, or African Americans who were mostly slaves taken from Africa, or slave descendants.[63] Beginning in the early 20th century, many Latin Americans immigrated; followed by large numbers of Asians following removal of nation-origin based immigration quotas.[64] The promise of high wages brings many highly skilled workers from around the world to the United States. Over 13 million people entered the United States during the 1990s alone.[65]
Labor mobility has also been important to the capacity of the American economy to adapt to changing conditions.[citation needed] When immigrants flooded labor markets on the East Coast, many workers moved inland, often to farmland waiting to be tilled. Similarly, economic opportunities in industrial, northern cities attracted black Americans from southern farms in the first half of the 20th century, in what was known as the Great Migration.
In the United States, the corporation has emerged as an association of owners, known as stockholders, who form a business enterprise governed by a complex set of rules and customs. Brought on by the process of mass production, corporations, such as General Electric, have been instrumental in shaping the United States. Through the stock market, American banks and investors have grown their economy by investing and withdrawing capital from profitable corporations. Today in the era of globalization, American investors and corporations have influence all over the world. The American government is also included among the major investors in the American economy. Government investments have been directed towards public works of scale (such as from the Hoover Dam), military-industrial contracts, and the financial industry.
While consumers and producers make most decisions that mold the economy, government has a powerful effect on the U.S. economy in at least four areas, as the government uses a capitalist system. Strong government regulation in the U.S. economy started in the early 1900s with the rise of the Progressive Movement; prior to this the government promoted economic growth through protective tariffs and subsidies to industry, built infrastructure, and established banking policies, including the gold standard, to encourage savings and investment in productive enterprises. On June 26, 2009, Jeff Immelt, the CEO of General Electric, called for the United States to increase its manufacturing base employment to 20% of the workforce, commenting that the U.S. has outsourced too much in some areas and can no longer rely on the financial sector and consumer spending to drive demand.[66]
Employment
Main articles: Education in the United States, Immigration to the United States, and List of U.S. states by unemployment rateThere are 4,352 colleges, universities, and junior colleges in the United States.[67] In 2007, Americans stood second only to Canada in the percentage of 35 to 64 year olds holding at least two-year degrees. Among 25 to 34 year olds, two-year degree rate is also among the highest, standing tenth. In 2003 a Supreme Court decision concerning affirmative action in universities allowed educational institutions to consider race as a factor in admitting students.[68] The labor market in the United States has attracted immigrants from all over the world and its net migration rate is among the highest in the world. For example, the brain drain from Europe to the United States means that some 400,000 European science and technology graduates now live in the U.S.[69] Nearly 14 million immigrants came to the United States from 2000 to 2010.[70] In a 2006 news story, USA Today reported, "The analysis shows that 31% of adult immigrants have not completed high school. A third lack health insurance."[71]
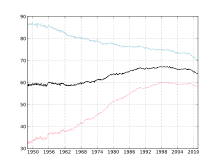 United States Labor Force Participation Rate from 1948 to 2011 by gender. Men are represented in light blue, women in pink, and the total in black.
There are approximately 154.4 million employed individuals in the US. Government is the largest employment sector with 22 million.[72] Small businesses are the largest employer in the country representing 53% of US workers.[59] The second largest share of employment belongs to large businesses, who employ a total of 38% of the US workforce.[59] A total of 91% of Americans are employed by the private sector. Government accounts for 8% of all US workers. Over 99% of all employing organizations in the US are small businesses.[59] The 30 million small businesses in the USA account for 64% of net new jobs (jobs created minus jobs lost).[59] 70% of jobs created in the last decade were by small business.[73] The proportion of Americans employed by small business versus large business has remained relatively the same year by year as some small businesses become large businesses and just over half of small businesses survive more than 5 years.[59] Amongst large businesses, several of the largest companies and employers in the world are American companies. Amongst them are Walmart, the largest company and the largest private sector employer in the world, which employs 2.1 million people world-wide and 1.4 million in the US alone.[74][75]
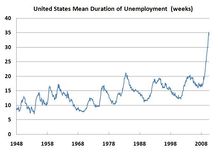 United States mean duration of unemployment 1948-2010.
There are nearly 30 million small businesses in the USA. Minorities in the US, such as Hispanics, African Americans, Asian Americans, and Native Americans (35% of the country's population),[76] own 4.1 million of the country's businesses. Minority-owned businesses generate almost $700 billion in revenue and employ almost 5 million workers in the US.[59]
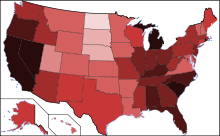 US unemployment by state in September 2009.[77]≤4.5%≤5.5%≤6.5%≤7.5%≤8.5%≤9.5%≤10.5%≤11.5%>11.5%
The median household income in the US as of 2008 is $52,029.[78] 284,000 working people in the US have two full-time jobs and 7.6 million have a part-time job in addition to their full-time employment.[72] 12% of working individuals in the US belong to a labor union with the majority of labor union members being government workers.[72]
In May 2009, the unemployment rate was 9.4%.[79] A broader measure of unemployment (taking into account marginally attached workers, those employed part time for economic reasons, and discouraged workers) was 15.9%.[80] In 2009 and 2010, following the financial crisis of 2007–2010, the emerging problem of jobless recoveries resulted in record levels of long-term unemployment with over 6 million workers looking for work longer than 6 months as of January, 2010. This particularly affected older workers.[41] Since the recession's end in June 2009 in the United States, immigrants have gained 656,000 jobs, while U.S.-born workers lost more than a million jobs.[81]
In April 2010, the official unemployment rate was 9.9%, but the government’s broader U-6 unemployment rate was 17.1%.[82] In the period between February 2008 and February 2010, the number of people working part time for economic reasons has increased by 4 million to 8.8 million, that is a 83% increase in part time workers during the two year period.[83]
Female unemployment continued to be significantly lower than male unemployment (7.5% vs. 9.8%). The unemployment among Caucasians continues to be much lower than African American unemployment (at 8.5% vs. 15.8%).[79] The youth unemployment rate was 18.5% in July 2009, the highest July rate since 1948.[84] 34.5% of young African American men were unemployed in October 2009.[85] Officially, Detroit’s unemployment rate is 27%, but Detroit News suggests that nearly half of this city’s working-age population may be unemployed.[86]
Entrepreneurship

Entrepreneurship is the act of being an entrepreneur, which can be defined as "one who undertakes innovations, finance and business acumen in an effort to transform innovations into economic goods". This may result in new organizations or may be part of revitalizing mature organizations in response to a perceived opportunity. The most obvious form of entrepreneurship is that of starting new businesses (referred as Startup Company); however, in recent years, the term has been extended to include social and political forms of entrepreneurial activity. When entrepreneurship is describing activities within a firm or large organization it is referred to as intra-preneurship and may include corporate venturing, when large entities spin-off organizations.[87]
According to Paul Reynolds, entrepreneurship scholar and creator of the Global Entrepreneurship Monitor, "by the time they reach their retirement years, half of all working men in the United States probably have a period of self-employment of one or more years; one in four may have engaged in self-employment for six or more years. Participating in a new business creation is a common activity among U.S. workers over the course of their careers." [88] And in recent years has been documented by scholars such as David Audretsch to be a major driver of economic growth in both the United States and Western Europe.
Income and wealth
Main articles: Income in the United States and Wealth in the United StatesSee also: Personal income in the United States, Household income in the United States, Income inequality in the United States, Poverty in the United States, Affluence in the United States, and Homeownership in the United StatesAccording to the United States Census Bureau, the pretax median household income in 2007 was $50,233. The median ranged from $68,080 in Maryland to $36,338 in Mississippi.[89]
In 2007, the median real annual household income rose 1.3% to $50,233, according to the Census Bureau.[90] The real median earnings of men who worked full time, year-round climbed between 2006 and 2007, from $43,460 to $45,113. For women, the corresponding increase was from $33,437 to $35,102. The median income per household member (including all working and non-working members above the age of 14) was $26,036 in 2006.[91]
The recently released US Income Mobility Study showed economic growth resulted in rising incomes for most taxpayers over the period from 1996 to 2005. Median incomes of all taxpayers increased by 24 percent after adjusting for inflation. The real incomes of two-thirds of all taxpayers increased over this period. Income mobility of individuals was considerable in the U.S. economy during the 1996 through 2004 period with roughly half of taxpayers who began in the bottom quintile moving up to a higher income group within 10 years. In addition, the median incomes of those initially in the lower income groups increased more than the median incomes of those initially in the higher income groups.[92]
Between June 2007 and November 2008 the global recession led to falling asset prices around the world. Assets owned by Americans lost about a quarter of their value.[93] Since peaking in the second quarter of 2007, household wealth is down $14 trillion.[94] The Fed also said that at the end of 2008, the debt owed by nonfinancial sectors was $33.5 trillion, including household debt valued at $13.8 trillion.[95]
In 2007, financial analyst Gary Shilling estimated that 52.6% of all Americans received a significant portion of their income from the federal government.[96]
About 30% of the entire world's millionaire population reside in the United States (in 2009).[97] Furthermore, 34% of the world's billionaires are American (in 2011).[58][98]
Financial position
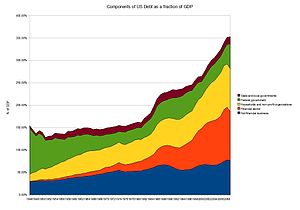 Components of total US debt as a fraction of GDP 1945–2009Main article: Financial position of the United States
The overall financial position of the United States as of 2009 includes $50.7 trillion of debt owed by US households, businesses, and governments, representing more than 3.5 times the annual gross domestic product of the United States.[25] As of the first quarter of 2010, domestic financial assetsA totaled $131 trillion and domestic financial liabilities $106 trillion.[28] Tangible assets in 2008 (such as real estate and equipment) for selected sectorsB totaled an additional $56.3 trillion.[99]
Sectors
Main article: Economy of the United States by sector Sales and employees by sectors of the United States economy in 2002.
Retailing
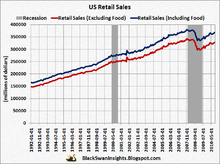 US Retail Sales 1992–2010
Retailing is a major sector of the economy of the United States; indeed, it is often credited with "leading" the economy. Consumer goods are commonly obtained through international trade, but many[clarification needed] consumer products are available that are "made in America".[100][101] In 2011 it was reported that rising commodity and fuel prices and labor costs in China were exerting upward pressure on prices creating a dilemma for retailers who lost sales during the Great Recession and continue to face a weak market.[102]
Major retail firms in the United States include Walmart, Sears, Amazon.com, Target, Macy's, McDonalds, Burger King, Safeway, A & P, and The Home Depot.[citation needed] Some, such as Walmart and KFC serve a global market.[citation needed] Outside of the agricultural sector, the cooperative movement is anemic in the United States.[citation needed]
Energy
Main article: Energy in the United StatesThe United States is the 2nd largest energy consumer in terms of total use.[103] The U.S. ranks seventh in energy consumption per-capita after Canada and a number of other countries.[104][105] The majority of this energy is derived from fossil fuels: in 2005, it was estimated that 40% of the nation's energy came from petroleum, 23% from coal, and 23% from natural gas. Nuclear power supplied 8.4% and renewable energy supplied 6.8%, which was mainly from hydroelectric dams although other renewables are included.[106]
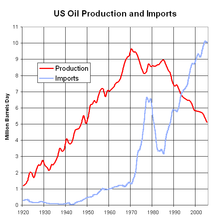 United States petroleum production and imports, 1920 to 2005.
American dependence on oil imports grew from 24% in 1970 to 65% by the end of 2005. At the current rate of unchecked import growth, the US would be 70% to 75% reliant on foreign oil by the middle of the next decade.[107] Transportation has the highest consumption rates, accounting for approximately 68.9% of the oil used in the United States in 2006,[108] and 55% of oil use worldwide as documented in the Hirsch report.
Agriculture
Main article: Agriculture in the United StatesSee also: Fishing industry in the United States, Beekeeping in the United States, and United States Department of AgricultureAgriculture is a major industry in the United States and the country is a net exporter of food. With vast tracts of temperate arable land, technologically advanced agribusiness, and agricultural subsidies, the United States controls almost half of world grain exports.[109]
Products include wheat, corn, other grains, fruits, vegetables, cotton; beef, pork, poultry, dairy products; forest products; fish.
Manufacturing
The United States is the world's largest manufacturer, with a 2009 industrial output of US$2.33 trillion. Its manufacturing output is greater than of Germany, France, India, and Brazil combined, despite manufacturing being a small portion of the entire US economy as compared to other countries.[110]
Main industries include petroleum, steel, automobiles, construction machinery, aerospace, agricultural machinery, telecommunications, chemicals, electronics, food processing, consumer goods, lumber, and mining.
The US leads the world in airplane manufacturing,[111] which represents a large portion of US industrial output. American companies such as Boeing, Cessna (see: Textron), Lockheed Martin (see: Skunk Works), and General Dynamics produce a vast majority of the world's civilian and military aircraft in factories stretching across the United States.
The manufacturing sector of the U.S. economy has experienced substantial job losses over the past several years.[112] In January 2004, the number of such jobs stood at 14.3 million, down by 3.0 million jobs, or 17.5 percent, since July 2000 and about 5.2 million since the historical peak in 1979. Employment in manufacturing was its lowest since July 1950.[113] The number of steel workers fell from 500,000 in 1980 to 224,000 in 2000.[114]
The U.S. produces approximately 18% of the world's manufacturing output, a number that has declined as other nations developed competitive manufacturing industries.[110] The job loss during this continual volume growth is the result of multiple factors including increased productivity, trade, and secular economic trends. [115] In addition, growth in telecommunications, pharmaceuticals, aircraft, heavy machinery and other industries along with declines in low end, low skill industries such as clothing, toys, and other simple manufacturing have resulted in U.S. jobs being more highly skilled and better paying.[citation needed]
Finance
Main articles: Finance in the United States, Banking in the United States, and Insurance in the United StatesMeasured by value of its listed companies' securities, the New York Stock Exchange is more than three times larger than any other stock exchange in the world.[116] As of October 2008, the combined capitalization of all domestic NYSE listed companies was US$10.1 trillion.[117] New York City is the financial capital of the world alongside London.
NASDAQ is another American stock exchange and the world's 3rd largest exchange after the New York Stock Exchange and Japan's Tokyo Stock Exchange. However NASDAQ's trade value is larger than Japan's TSE.[116] NASDAQ is the largest electronic screen-based equity securities trading market in the USA. With approximately 3,800 companies and corporations, it has more trading volume per hour than any other stock exchange.[118]
International trade
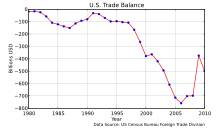 United States balance of trade (1980–2010), with negative numbers denoting a trade deficitMain articles: Foreign trade of the United States and Trade policy of the United States
The United States is the world's largest trading nation. Since it is the world's leading importer, there are many U.S. dollars in circulation all around the planet. The dollar is also used as the standard unit of currency in international markets for commodities such as gold and petroleum.
Large foreign economies like China, Japan and the member states of the European Union own huge dollar reserves (especially as the US is more in debt) so there is a fear that they will move away from the dollar.[119] China's reserves are more than $3 trillion, the world's largest.[120] China owns an estimated $1.6 trillion of U.S. securities.[121]
In 2010, the total U.S. trade deficit was $634.9 billion, which is $1.3 trillion in exports minus $1.9 trillion in imports.[122] The deficit on petroleum products was $270 billion. The trade deficit with China was $273 billion, a new record and up from $304 million in 1983.[123] The United States had a $168 billion surplus on trade in services, and $803 billion deficit on trade in goods in 2010.[124][125]
To fund the national debt (also known as public debt), the United States relies on selling U.S. treasury bonds to people both inside and outside the country, and in recent times a growing percent of buyers are international.
Economic predictions and forecasting
Predictions about the direction of the United States economy in the short term and long term are crucial factors in determining federal government policies, business decisions, and Federal Reserve decisions. Several institutions make economic predictions, including: Global Insight, and the UCLA Anderson Forecast. Various state agencies, including the California Department of Finance, also make predictions.[citation needed]
Currency and central bank
Main articles: United States dollar and Federal Reserve System United States historical inflation rate 1666–2004
The United States dollar is the unit of currency of the United States. The U.S. dollar is the currency most used in international transactions.[126] Several countries use it as their official currency, and in many others it is the de facto currency.[127]
The federal government attempts to use both monetary policy (control of the money supply through mechanisms such as changes in interest rates) and fiscal policy (taxes and spending) to maintain low inflation, high economic growth, and low unemployment. A relatively private central bank, known as the Federal Reserve, was formed in 1913 to provide a stable currency and monetary policy. Despite significant loss of value due to inflation [1], the U.S. dollar has been regarded as one of the more stable currencies in the world and many nations back their own currency with U.S. dollar reserves.
The U.S. dollar has maintained its position as the world's primary reserve currency, although it is gradually being challenged in that role.[128] Almost two-thirds of currency reserves held around the world are held in US dollars, compared to around 25% for the next most popular currency, the Euro.[129] Rising US national debt [2] and the related rise of China have led to some, especially the Chinese, to call for replacing the dollar as the world's reserved currency, but thus far this has been only speculation.[130]
The dollar used gold standard and/or silver standard from 1785 until 1971, when it became a floating fiat currency because of problems experienced with attempting to fix prices of commodities.
Government involvement
Regulations
The U.S. federal government regulates private enterprise in numerous ways. Regulation falls into two general categories.
Some efforts seek, either directly or indirectly, to control prices. Traditionally, the government has sought to create state-regulated monopolies such as electric utilities from while allowing prices in the level that would ensure them normal profits. At times, the government has extended economic control to other kinds of industries as well. In the years following the Great Depression, it devised a complex system to stabilize prices for agricultural goods, which tend to fluctuate wildly in response to rapidly changing supply and demand. A number of other industries—trucking and, later, airlines—successfully sought regulation themselves to limit what they considered as harmful price cutting, a process called regulatory capture.[131]
Another form of economic regulation, antitrust law, seeks to strengthen market forces so that direct regulation is unnecessary. The government—and, sometimes, private parties—have used antitrust law to prohibit practices or mergers that would unduly limit competition.[131]
Bank regulation in the United States is highly fragmented compared to other G10 countries where most countries have only one bank regulator. In the U.S., banking is regulated at both the federal and state level. The U.S also has one of the most highly regulated banking environments in the world; however, many of the regulations are not safety and soundness related, but are instead focused on privacy, disclosure, fraud prevention, anti-money laundering, anti-terrorism, anti-usury lending, and promoting lending to lower-income segments.[citation needed]
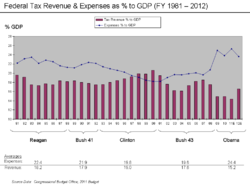 Revenue and Expense as % GDP.
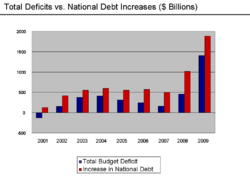 Deficit and debt increases 2001–2009.
Since the 1970s, government has also exercised control over private companies to achieve social goals, such as improving the public's health and safety or maintaining a healthy environment. For example, the Occupational Safety and Health Administration provides and enforces standards for workplace safety, and the United States Environmental Protection Agency provides standards and regulations to maintain air, water, and land resources. The U.S. Food and Drug Administration regulates what drugs may reach the market, and also provides standards of disclosure for food products.[131]
American attitudes about regulation changed substantially during the final three decades of the 20th century. Beginning in the 1970s, policy makers grew increasingly convinced that economic regulation protected companies at the expense of consumers in industries such as airlines and trucking. At the same time, technological changes spawned new competitors in some industries, such as telecommunications, that once were considered natural monopolies. Both developments led to a succession of laws easing regulation.[131]
While leaders of America's two most influential political parties generally favored economic deregulation during the 1970s, 1980s, and 1990s, there was less agreement concerning regulations designed to achieve social goals. Social regulation had assumed growing importance in the years following the Depression and World War II, and again in the 1960s and 1970s. During the 1980s, the government relaxed labor, consumer and environmental rules based on the idea that such regulation interfered with free enterprise, increased the costs of doing business, and thus contributed to inflation. The response to such changes is mixed; many Americans continued to voice concerns about specific events or trends, prompting the government to issue new regulations in some areas, including environmental protection.[131]
Where legislative channels have been unresponsive, some citizens have turned to the courts to address social issues more quickly. For instance, in the 1990s, individuals, and eventually the government itself, sued tobacco companies over the health risks of cigarette smoking. The 1998 Tobacco Master Settlement Agreement provided states with long-term payments to cover medical costs to treat smoking-related illnesses.[131]
Taxation
Main article: Taxation in the United StatesTaxation in the United States is a complex system which may involve payment to at least four different levels of government and many methods of taxation. Taxes are levied by the federal government, by the state governments, and often by local governments, which may include counties, municipalities, township, school districts, and other special-purpose districts, which include fire, utility, and transit districts.
The National Bureau of Economic Research has concluded that the combined federal, state, and local government average marginal tax rate for most workers to be about 40% of income.[132][133] The Tax Foundation concluded that government at all levels will collect 30.8% of the nation's income for 2008.[134] Tax Day, the day by which tax returns are due, is usually April 15.
Expenditure
Main articles: United States federal budget and United States public debt Fiscal Year 2009 U.S. Federal Spending – Cash or Budget Basis.
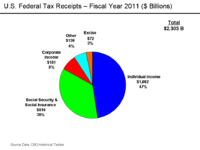 Fiscal Year 2009 U.S. Federal Receipts.
The United States public sector spending amounts to about a third of the GDP.
Each level of government provides many direct services. The federal government, for example, is responsible for national defense, backs research that often leads to the development of new products, conducts space exploration, and runs numerous programs designed to help workers develop workplace skills and find jobs (including higher education). Government spending has a significant effect on local and regional economies—and even on the overall pace of economic activity.[citation needed]
State governments, meanwhile, are responsible for the construction and maintenance of most highways. State, county, or city governments play the leading role in financing and operating public schools. Local governments are primarily responsible for police and fire protection.[citation needed]
The welfare system in the United States began in the 1930s, during the Great Depression. After the Great Society legislation of the 1960s, for the first time a person who was not elderly or disabled could receive a living from the American government.[135]
Overall, federal, state, and local spending accounted for almost 28% of gross domestic product in 1998.[136]
As of January 20, 2009, the total U.S. federal debt was $10.627 trillion.[137] The borrowing cap debt ceiling as of 2005 stood at $8.18 trillion.[138] In March 2006, Congress raised that ceiling an additional $0.79 trillion to $8.97 trillion, which is approximately 68% of GDP.[139] Congress has used this method to deal with an encroaching debt ceiling in previous years, as the federal borrowing limit was raised in 2002 and 2003.[140] As of October 4, 2008, the "Emergency Economic Stabilization Act of 2008" raised the current debt ceiling to US$ 11.3 trillion.[141]
The federal government's debt rose by almost $1.4 trillion in 2009, and now stands at $12.1 trillion.[142] While the U.S. public debt is the world's largest in absolute size, another measure is its size relative to the nation's GDP. As of 2009 the debt was 83 percent of GDP. This debt, as a percent of GDP, is still less than the debt of Japan (192%) (the overwhelming number of owners of JGBs are Japanese)[143] and roughly equivalent to those of a few western European nations.[144]
See also
- Affluence in the United States
- Energy policy of the United States
- Economic history of the United States
- Economy of Puerto Rico
- Historical Statistics of the United States
- Household income in the United States
- Income inequality in the United States
- Income in the United States
- Labor unions in the United States
- National debt by U.S. presidential terms – includes federal spending and GDP
- Personal income in the United States
- United States federal budget
- Wealth in the United States
Events:
- Late-2000s recession
- Proposed bailout of U.S. financial system (2008)
- Subprime mortgage crisis
- Oil price increases since 2003
Lists:
- List of industry trade groups in the United States
- List of United States companies
References
- ^ a b c d e f IMF, http://www.imf.org/external/pubs/ft/weo/2011/01/weodata/weorept.aspx?pr.x=53&pr.y=12&sy=2011&ey=2016&scsm=1&ssd=1&sort=country&ds=.&br=1&c=111&s=NGDP_R%2CNGDP%2CNGDPRPC%2CNGDPPC%2CNGSD_NGDP%2CLUR%2CLP&grp=0&a=
- ^ a b National Income and Product Accounts Table, Bureau of Economic Analysis, http://www.bea.gov/national/nipaweb/TableView.asp?SelectedTable=264&FirstYear=2010&LastYear=2010, retrieved Nov. 8, 2011
- ^ Consumer Price Index Summary, Bureau of Labor Statistics, http://www.bls.gov/news.release/cpi.nr0.htm, retrieved Updated monthly
- ^ a b c Income, Poverty, and Health Insurance Coverage the United States, Census Bureau, http://www.census.gov/prod/2009pubs/p60-236.pdf, retrieved November 17, 2008
- ^ a b "Economic News Release: Employment Situation Summary Table A. Household data, seasonally adjusted". BLS.gov. Nov. 4, 2011. http://www.bls.gov/news.release/empsit.a.htm. Retrieved Nov. 8, 2011.
- ^ "Doing Business in the United States 2011". World Bank. http://www.doingbusiness.org/ExploreEconomies/?economyid=197. Retrieved Nov. 8, 2011.
- ^ a b c Depat. of Commerce: Top trade partners
- ^ Gross External Debt Position: September 30, 2010, U.S. Treasury Department
- ^ The Debt to the Penny, Treasury Department, November 4, 2011, http://www.treasurydirect.gov/NP/BPDLogin?application=np, retrieved November 8, 2011
- ^ a b Final Monthly Treasury Statement, Treasury Department, http://www.fms.treas.gov/mts/mts0911.pdf, retrieved November 8, 2011
- ^ Biggest donors by GDP, BBC News, http://news.bbc.co.uk/2/shared/spl/hi/pop_ups/05/business_aid_and_development/html/2.stm, retrieved November 17, 2008
- ^ "Sovereigns rating list". Standard & Poor's. http://www.standardandpoors.com/ratings/sovereigns/ratings-list/en/eu?sectorName=null&subSectorCode=39&filter=U. Retrieved August 20, 2011.
- ^ a b c Rogers, Simon; Sedghi, Ami (April 15, 2011). "How Fitch, Moody's and S&P rate each country's credit rating". The Guardian (London). http://www.guardian.co.uk/news/datablog/2010/apr/30/credit-ratings-country-fitch-moodys-standard. Retrieved May 28, 2011.
- ^ Riley, Charles (August 2, 2011). "Moody's affirms AAA rating, lowers outlook". CNN. http://money.cnn.com/2011/08/02/news/economy/moodys_credit_rating/index.htm?hpt=hp_t1.
- ^ "International Reserves and Foreign Currency Liquidity – UNITED STATES". International Monetary Fund. May 20, 2011. http://www.imf.org/external/np/sta/ir/IRProcessWeb/data/usa/eng/curusa.htm. Retrieved June 1, 2011.
- ^ a b "World Economic Outlook Database". International Monetary Fund. October 2009. http://www.imf.org/external/pubs/ft/weo/2009/02/weodata/weorept.aspx?sy=2006&ey=2009&scsm=1&ssd=1&sort=country&ds=.&br=1&c=111&s=NGDPD%2CNGDPDPC%2CPPPGDP%2CPPPPC%2CLP&grp=0&a=&pr.x=64&pr.y=8. Retrieved April 27, 2010.
- ^ The European Union has a larger collective economy, but is not a single nation.
- ^ (4)Outline of the U.S. Economy - (2)How the U.S. Economy Works U.S. Embassy Information Resource Center. Accessed: 24 October 2011.
- ^ U.S. Economy and Business - Conditions and Resources U.S. Department of State. Accessed: 24 October 2011.
- ^ Maddison, Angus (2006). "Historical Statistics for the World Economy". The Groningen Growth and Development Centre, Economics Department of the University of Groningen. http://www.ggdc.net/maddison/Historical_Statistics/horizontal-file_09-2008.xls. Retrieved November 6, 2008.
- ^ Digital History
- ^ a b "Global 500 2010: Countries". CNN. http://money.cnn.com/magazines/fortune/global500/2010/countries/US.html.
- ^ CIA – The World Factbook
- ^ CIA – The World Factbook
- ^ a b 31, 2010 Components of US debt, https://www.federalreserve.gov/datadownload/Download.aspx?rel=Z1&series=654245a7abac051cc4a9060c911e1fa4&filetype=csv&label=include&layout=seriescolumn&from=01/01/1945&to=December 31, 2010, retrieved July 3, 2010
- ^ Monthly Statement of the Public Debt (MSPD), [http://www.treasurydirect.gov treasurydirect.gov.
- ^ "U.S. Congress may raise debt ceiling to $1.3 trillion". DigitalJournal.com. December 21, 2009.
- ^ a b Flow of Funds report, p. L.5, L.125, http://www.federalreserve.gov/releases/z1/current/z1.pdf, retrieved July 3, 2010
- ^ Rankings: Global Competitiveness Report 2008-2009, World Economic Forum, http://gcr.weforum.org/gcr/, retrieved October 12, 2008[dead link] Click the link "Rankings" to access the entire list.
- ^ "Persons Obtaining Legal Permanent Resident Status in the United States of America", US Department of Homeland Security.
- ^ W. J. Rorabaugh, Donald T. Critchlow, Paula C. Baker (2004). "America's promise: a concise history of the United States". Rowman & Littlefield. p.210. ISBN 0742511898
- ^ Moore, Geoffrey H.; Zarnowitz (1986), "Appendix A The Development and Role of the National Bureau of Economic Research's Business Cycle Chronologies", http://www.nber.org/chapters/c10035 in Gordon 1986, pp. 743–745[clarification needed]
- ^ Knoop, Todd A. (July 30, 2004), Recessions and Depressions: Understanding Business Cycles, Praeger Publishers, pp. 166–71, ISBN 0275981622
- ^ "The Depression of 1893", David O. Whitten, Auburn University.
- ^ Buchanan, James M.; Wagner, Richard E. (1977), "especially chapters 1 – 4", Democracy in Deficit: The Political Legacy of Lord Keynes, New York: Academic Press, pp. 1–55, ISBN 0-86597-227-3, http://www.econlib.org/library/Buchanan/buchCv8Contents.html, retrieved January 19, 2011
- ^ Current Population Reports: Income of nonfarm families and individuals (1946)
- ^ a b c Global Crisis News, GCN, http://www.globalcrisisnews.com/usa/us-out-of-recession-as-economy-grows-by-3-5-percent/id=1238/, retrieved June 17, 2009
- ^ a b Worries grow of deeper U.S. recession, CNN, archived from the original on June 11, 2008, http://web.archive.org/web/20080611130336/http://edition.cnn.com/2008/BUSINESS/03/21/us.recession.ap/index.html, retrieved November 17, 2008
- ^ Zuckerman, Mortimer B. (December 15–22, 2008), Editorial: Heading Off a Depression, US News and World Report
- ^ Bivens, L. Josh (December 14, 2004). Debt and the dollar Economic Policy Institute. Retrieved on July 8, 2007.
- ^ a b "Millions of Unemployed Face Years Without Jobs" article by Peter S. Goodman in The New York Times February 20, 2010
- ^ Associated Press (January 30, 2006).US savings rate hits lowest level since 1933MSNBC. Retrieved on May 6, 2007.
- ^ Cauchon, Dennis and John Waggoner (October 3, 2004). The Looming National Benefit Crisis. USA Today
- ^ dollar hits record low against euro, oil prices rally, http://news.xinhuanet.com/english/2008-02/27/content_7679604.htm
- ^ US recession 'began last year', BBC News, December 1, 2008, http://news.bbc.co.uk/2/hi/business/7759470.stm, retrieved December 1, 2008
- ^ Department of Commerce: Top U.S. Trade Partners
- ^ BEA: Personal income and its disposition, 2000–09
- ^ FY 2010 Budget Historical Tables Pages 127–128
- ^ "US spends its way to 28 Eiffel towers: made out of pure gold". The Times. March 17, 2006.
- ^ "Senate backs increase in debt limit to $14.3 trillion". Reuters. January 28, 2010.
- ^ 2010 Budget-Summary Tables S-13 and S-14
- ^ "Debt has become America's life blood". Abc.net.au. December 15, 2009.
- ^ "Wave of Debt Payments Facing US Government". The New York Times. November 22, 2009.
- ^ "Analytical Perspectives of the FY 2008 Budget".
- ^ "Washington learns to treat China with care". CNNMoney.com. July 29, 2009.
- ^ Index of Economic Freedom – United States, Heritage.org, http://www.heritage.org/research/features/index/country.cfm?ID=Unitedstates, retrieved November 17, 2008
- ^ Anderson, Jack (May 22, 2006), "Tax Misery & Reform Index", Forbes, http://members.forbes.com/global/2006/0522/032.html, retrieved November 17, 2008
- ^ a b "Forbes". Forbes. March 14, 2011. http://www.forbes.com/wealth/billionaires.
- ^ a b c d e f g Office of Advocacy – Frequently Asked Questions – How important are small businesses to the U.S. economy? | SBA.gov
- ^ Where the millionaires are now – MSN Money
- ^ Encyclopædia Britannica's Great Inventions", Encyclopædia Britannica
- ^ U.S. Department of state:How the U.S. Economy Works Retrieved December 1, 2008
- ^ "Trends in International Migration 2002: Continuous Reporting System on Migration". Organisation for Economic Co-Operation and Development (2003). OECD Publishing. p.280. ISBN 9264199497
- ^ Peter S. Canellos (November 11, 2008), "Obama victory took root in Kennedy-inspired Immigration Act", The Boston Globe, http://www.boston.com:80/news/politics/2008/articles/2008/11/11/obama_victory_took_root_in_kennedy_inspired_immigration_act/?page=full, retrieved November 14, 2008
- ^ "An Introduction to Bilingualism: Principles and Processes". Jeanette Altarriba, Roberto R. Heredia (2008). p.212. ISBN 0805851356
- ^ Bailey, David and Soyoung Kim (June 26, 2009).GE's Immelt says U.S. economy needs industrial renewal.UK Guardian.. Retrieved on June 28, 2009.
- ^ Neuharth, Al (May 1, 2009), College Decision Day, Melbourne, Florida: Florida Today, pp. 11A
- ^ "Highlights of the 2002–2003 Supreme Court Term". Supct.law.cornell.edu. http://supct.law.cornell.edu/supct/03highlts.html#2.
- ^ How To Plug Europe's Brain Drain, Time magazine, http://www.time.com/time/magazine/article/0,9171,574849-1,00.html
- ^ "Immigrant Population at Record 40 Million in 2010". Yahoo! News. October 6, 2011.
- ^ "Study: Immigration grows, reaching record numbers". USATODAY.com. December 12, 2005.
- ^ a b c McFeatters, Dale (September 6, 2010). "Saluting 154 million in workforce on Labor Day". Napa Valley Register. http://napavalleyregister.com/news/opinion/editorial/article_43f9e712-b96a-11df-9e2d-001cc4c002e0.html.
- ^ Obama: Small Business 'Heart' of Economy – YouTube
- ^ "Global 500 2010: Global 500 1–100". CNN. http://money.cnn.com/magazines/fortune/global500/2010/full_list/.
- ^ Walmart Corporate and Financial Facts, August 2011
- ^ "Minority population growing in the United States, census estimates show". Los Angeles Times. June 10, 2010.
- ^ http://www.bls.gov/web/lauhsthl.htm BLS.gov
- ^ Median Household Income for States: 2007 and 2008, September 2009, census.gov.
- ^ a b Current Population Survey, Bureau of Labor Statistics, US Government, June 5, 2009, http://www.bls.gov/cps/, retrieved June 19, 20099
- ^ Alternative measures of labor underutilization (U6, not seasonally adjusted), Bureau of Labor Statistics, US Government, June 5, 2009, http://www.bls.gov/webapps/legacy/cpsatab12.htm, retrieved June 19, 20099
- ^ "Immigrants top native born in U.S. job hunt". CNNMoney.com. October 29, 2010.
- ^ "Broader U-6 Unemployment Rate Increases to 17.1% in April". The Wall Street Journal. May 7, 2010.
- ^ Four million more people working part time than 2 years ago, EconPost.com, March 17, 2010, http://econpost.com/unitedstateseconomy/four-million-more-people-working-part-time-2-years-ago, retrieved March 30, 2010
- ^ "Employment and Unemployment Among Youth Summary". United States Department of Labor.
- ^ "Blacks hit hard by economy's punch". The Washington Post. November 24, 2009.
- ^ "Nearly half of Detroit's workers are unemployed". The Detroit News. December 16, 2009.
- ^ Shane, Scott "A General Theory of Entrepreneurship: the Individual-Opportunity Nexus", Edward Elgar
- ^ Reynolds, Paul D. "Entrepreneurship in the United States", Springer, 2007, ISBN 978-0-387-45667-6
- ^ Census Bureau: Two-Year-Average Median Household Income by State: 2004 to 2007
- ^ US Census Bureau news release in regards to median income, http://www.census.gov/Press-Release/www/releases/archives/income_wealth/012528.html, retrieved August 28, 2007[dead link]
- ^ US Census Bureau median income per household member, http://pubdb3.census.gov/macro/032007/hhinc/new02_001.htm, retrieved August 28, 2008
- ^ US Treasury Income Mobility Study,, income data, http://www.treas.gov/press/releases/hp673.htm, retrieved August 29, 2008
- ^ Roger C. Altman, The Great Crash, 2008, Foreign Affairs, http://www.foreignaffairs.org/20090101faessay88101/roger-c-altman/the-great-crash-2008.html, retrieved February 27, 2009
- ^ "Americans' wealth drops $1.3 trillion". CNN. June 11, 2009
- ^ "U.S. household wealth falls $11.2 trillion in 2008". Reuters. March 12, 2009.
- ^ Mark Trumbull (April 16, 2007). "As US tax rates drop, government's reach grows". Christian Science Monitor. http://www.csmonitor.com/2007/0416/p01s04-usec.html.
- ^ "World Wealth Report 2010."
- ^ Carlos Slim Tops Forbes List of Billionaires for Second Year
- ^ Net worth of the United States, https://www.federalreserve.gov/datadownload/Download.aspx?rel=Z1&series=f9a5e21e90ff82b038b7e8f930aa0b58&filetype=csv&label=include&layout=seriesrow&lastObs=100, retrieved July 3, 2010
- ^ "Made in America". ABC News. http://abcnews.go.com/WN/MadeInAmerica/. Retrieved April 23, 2011.
- ^ "USA Only". USAOnly.US. http://www.usaonly.us/. Retrieved April 23, 2011. "This site is dedicated to American companies manufacturing products right here in the USA. We provide product and company info and links so you can buy these quality products quickly and easily."
- ^ Clifford, Stephanie (April 22, 2011). "Camouflaging Price Creep". The New York Times. http://www.nytimes.com/2011/04/23/business/23prices.html. Retrieved April 23, 2011.
- ^ China surpasses US as top energy consumer – Business – Oil & energy – msnbc.com
- ^ World Per Capita Total Primary Energy Consumption,1980–2005 (MS Excel format)
- ^ World Resources Institute "Energy Consumption: Consumption per capita" (2001). Nations with higher per-capita consumption are: Qatar, Iceland, United Arab Emirates, Bahrain, Luxembourg and Canada. Except for Canada, these are small countries with a prominent energy-intensive industry such as oil refining or steelmaking.
- ^ US Dept. of Energy, "Annual Energy Report" (July 2006), Energy Flow diagram
- ^ Forbes.com
- ^ Domestic Demand for Refined Petroleum Products by Sector, U.S. Bureau of Transportation Statistics, http://www.bts.gov/publications/national_transportation_statistics/html/table_04_03.html, retrieved December 20, 2007
- ^ "The Food Bubble Economy". The Institute of Science in Society.
- ^ a b "Manufacturing Output by Country". Greyhill Advisors. http://greyhill.com/blog/2011/10/5/manufacturing-output-by-country.html. Retrieved 5 October 2011.
- ^ http://www.nasa.gov/worldbook/aviation_worldbook.html[broken citation]
- ^ "Factory jobs: 3 million lost since 2000". USATODAY.com. April 20, 2007.
- ^ "What Accounts for the Decline in Manufacturing Employment?, Congressional Budget Office February 18, 2004.
- ^ "Congressional Record V. 148, Pt. 4, April 11, 2002 to April 24, 2002". United States Government Printing Office.
- ^ "What Accounts for the Decline in Manufacturing Employment?". Congressional Budget Office. http://www.cbo.gov/doc.cfm?index=5078&type=0. Retrieved 5 October 2011.
- ^ a b WFE – YTD Monthly
- ^ NYXdata > Data Products > NYSE > Facts & Figures
- ^ "NASDAQ Performance Report", NASDAQ Newsroom (The Nasdaq Stock Market), January 12, 2007, http://www.nasdaq.com/newsroom/stats/Performance_Report.stm#item_2, retrieved February 15, 2007
- ^ "China, US should adjust approach to economic growth"
- ^ China’s World-Record Currency Reserves Exceed $3 Trillion – Businessweek
- ^ "China must keep buying US Treasuries for now-paper". Reuters. August 19, 2009.
- ^ "Trade Statistics". Greyhill Advisors. http://greyhill.com/trade-statistics. Retrieved 7 October 2011.
- ^ "Manufacturing and Trade". Greyhill Advisors. http://greyhill.com/blog/2011/10/6/manufacturing-and-trade.html. Retrieved 7 October 2011.
- ^ "US trade deficit is a significant cause of recession" By Peter Morici, former Chief Economist at the U.S. International Trade Commission. February 12, 2009.
- ^ "Record Trade in Services". Economics and Statistics Administration. http://www.esa.doc.gov/news/2011/05/11/new-commerce-department-report-shows-record-services-trade-surplus-continues-grow. Retrieved 7 October 2011.
- ^ The Implementation of Monetary Policy – The Federal Reserve in the International Sphere
- ^ Benjamin J. Cohen, The Future of Money, Princeton University Press, 2006, ISBN 0691116660; cf. "the dollar is the de facto currency in Cambodia", Charles Agar, Frommer's Vietnam, 2006, ISBN 0471798169, p. 17
- ^ "Biggest game in town". BBC News. January 29, 2009.
- ^ Currency Composition of Official Foreign Exchange Reserves (COFER) – June 30, 2011
- ^ "China's Yuan The Next Reserve Currency?". Spiegel Online. May 26, 2009.
- ^ a b c d e f Regulation and Control in the U.S. Economy: About.com
- ^ Burns, Scott (February 21, 2007), Your real tax rate: 40%, MSN Money, http://articles.moneycentral.msn.com/Taxes/Advice/YourRealTaxRate40.aspx, retrieved March 13, 2008
- ^ Friedman, Milton; Friedman, Rose (1980), Free to choose, Harcourt, ISBN 978-0-15-633460-0
- ^ Hodge, Scott A.; Dubay, Curtis S. (March 27, 2008), America Celebrates Tax Freedom Day, Tax Foundation, http://www.taxfoundation.org/taxfreedomday/, retrieved March 30, 2008
- ^ Frum, David (2000), How We Got Here: The '70s, New York City: Basic Books, p. 72, ISBN 0465041957
- ^ U.S. Budget 2001, http://www.gpoaccess.gov/usbudget/fy01/guide01.html
- ^ / U.S. Treasury, http://www.treasurydirect.gov/NP/BPDLogin?application=np /
- ^ MSNBC, http://www.msnbc.msn.com/id//[dead link]
- ^ Bloomberg, http://www.bloomberg.com/apps/news?pid=&sid=aV04.D.whRXc&refer=us
- ^ "Washington Post 29 December 2005", The Washington Post, http://www.washingtonpost.com/wp-dyn/content/article/2005/12/29/AR.html[dead link]
- ^ Zeng, Min (October 6, 2008), "Bailout Funding Promises To Pressure Treasury Prices", The Wall Street Journal, http://online.wsj.com/article/SB122324501349605953.html, retrieved November 17, 2008
- ^ "U.S. in fiscal peril with $12.1 trillion debt". USATODAY.com. January 4, 2009.
- ^ "S&P warns may cut Japan's rating over soaring debt". Reuters. January 26, 2010.
- ^ Kumar, Vishesh. "Is Rising U.S. Debt Inviting Trouble? Ask Japan". Daily Finance. http://www.dailyfinance.com/story/is-rising-u-s-debt-inviting-trouble-ask-japan/19469343/. Retrieved May 18, 2010.
External links
- Research!America – Economic Impact of Medical Research in the U.S.
- CIA – The World Factbook – United States
- Outline of the U.S. Economy
- Bureau of Economic Analysis: Selected NIPA tables (Lots of U.S. economic data)
- U.S. Economic Calendar
- U.S. Census Bureau
- U.S. Dept of Labor – Bureau of Labor Statistics
- U.S. Dept of Commerce – Bureau of Economic Analysis
- FRB: Z.1 Release-- Flow of Funds Accounts of the United States, Release Dates
- OECD's United States country Web site and OECD Economic Survey of the United States
- U.S. Energy Information Administration
- National Bureau of Economic Research (USA) Economics material from the organization that declares Recessions and Recoveries.
- Bureau of Labor Statistics–from the American Labor Department
- US Department of Commerce Economics Statistics
- The Heritage Foundation: Understanding Poverty in America
- GDP growth viz Savings rate since 1985 Comparing GDP growth rate with the Savings rate since 1985
- Gross Domestic Product Growth – USA
- Unemployment Rate – USA
- Consumer Price Index – USA
- A U.S.-Colombia Free Trade Agreement: Strengthening Democracy and Progress in Latin America
- "Why There Won’t Be a Revolution" by Jerry Adler, Newsweek, February 16, 2009
Life in the United States Affluence · Crime · Culture · Economic issues · Education (attainment) · Family structure · Health care · Health insurance · Holidays · Household income · Homelessness · Homeownership · Human rights · Income inequality · Labor unions · Languages · Middle class · Passenger vehicle transport · Personal income · Political ideologies · Poverty · Racism · Religion · Social class · Society · Sports · Standard of living · Wealth

Asia-Pacific Economic Cooperation (APEC) Australia · Brunei Darussalam · Canada · Chile · People's Republic of China · Hong Kong · Indonesia · Japan · South Korea · Malaysia · Mexico · New Zealand · Papua New Guinea · Peru · Philippines · Russian Federation · Singapore · Chinese Taipei * · Thailand · United States · Vietnam
*Designation of the Republic of China (Taiwan)
Meetings Organisation for Economic Co-operation and Development (OECD) History Guidelines Members Australia · Austria · Belgium · Canada · Chile · Czech Republic · Denmark · Estonia · Finland · France · Germany · Greece · Hungary · Iceland · Ireland · Italy · Israel · Japan · Luxembourg · Mexico · Netherlands · New Zealand · Norway · Poland · Portugal · Slovakia · Slovenia · South Korea · Spain · Sweden · Switzerland · Turkey · United Kingdom · United States
Economy of North America Sovereign states Antigua and Barbuda · Bahamas · Barbados · Belize · Canada · Costa Rica · Cuba · Dominica · Dominican Republic · El Salvador · Grenada · Guatemala · Haiti · Honduras · Jamaica · Mexico · Nicaragua · Panama · Saint Kitts and Nevis · Saint Lucia · Saint Vincent and the Grenadines · Trinidad and Tobago · United States
Dependencies and
other territoriesAnguilla · Aruba · Bermuda · Bonaire · British Virgin Islands · Cayman Islands · Curaçao · Greenland · Guadeloupe · Martinique · Montserrat · Puerto Rico · Saint Barthélemy · Saint Martin · Saint Pierre and Miquelon · Saba · Sint Eustatius · Sint Maarten · Turks and Caicos Islands · United States Virgin Islands
Categories:- Economy of the United States
- Organisation for Economic Co-operation and Development member economies


Wikimedia Foundation. 2010.