- Demographics of the United States
-
As of today's date, the United States has a total resident population of 312,615,000, making it the third most populous country in the world. It is a very urbanized population, with 82% residing in cities and suburbs as of 2008 (the worldwide urban rate is 50.5%[1]). This leaves vast expanses of the country nearly uninhabited.[2] California and Texas are the most populous states,[3] as the mean center of United States population has consistently shifted westward and southward.[4] New York City is the most populous city in the United States.[5]
The total fertility rate in the United States estimated for 2009 is 2.01 children per woman, which is below the replacement fertility rate of approximately 2.1.[8] However, U.S. population growth is among the highest in industrialized countries,[9] since the vast majority of these have below-replacement fertility rates and the U.S. has higher levels of immigration.[10][11] The United States Census Bureau shows population increases ranging between 0.85% and 0.89% for the twelve-month periods ending in 2009.[12] Nonetheless, though high by industrialized country standards, this is below the world average annual rate of 1.19%.[9]
There were 155.6 million females in the United States in 2009. The number of males was 151.4 million. At age 85 and older, there were more than twice as many women as men. People under 20 years of age made up over a quarter of the U.S. population (27.3%), and people age 65 and over made up one-eighth (12.8%) in 2009.[13] The national median age was 36.8 years.[13] Racially, the U.S. has a White American majority.
Population in the United States increased by 54 million from 1990 to 2008, a growth of 22 %.[14]
The American population more than tripled during the 20th century—at a growth rate of about 1.3% a year—from about 76 million in 1900 to 281 million in 2000. It reached the 200 million mark in 1967, and the 300 million mark on October 17, 2006.[15][16] Currently, population growth is fastest among minorities as a whole, and according to the Census Bureau's estimation for 2005, 45% of American children under the age of 5 belonged to minority groups.[17]
Hispanic and Latino Americans accounted for almost half (1.4 million) of the national population growth of 2.9 million between July 1, 2005, and July 1, 2006.[18] Immigrants and their U.S.-born descendants are expected to provide most of the U.S. population gains in the decades ahead.[19]
The Census Bureau projects a U.S. population of 439 million in 2050, which is a 46% increase from 2007 (301.3 million).[20] However, the United Nations projects a U.S. population of 402 million in 2050, an increase of 32% from 2007 (the UN projects a gain of 38% for the world at large).[21] In either case, such growth is unlike most European countries, especially Germany, Russia, Italy, and Greece, or Asian countries such as Japan or South Korea, whose populations are slowly declining, and whose fertility rates are below replacement.
Historical populations Census Pop. %± 1790 3,929,214 — 1800 5,236,631 33.3% 1810 7,239,881 38.3% 1820 9,638,453 33.1% 1830 12,866,020 33.5% 1840 17,069,453 32.7% 1850 23,191,876 35.9% 1860 31,443,321 35.6% 1870 38,558,371 22.6% 1880 49,371,340 28.0% 1890 62,979,766 27.6% 1900 76,212,168 21.0% 1910 92,228,496 21.0% 1920 106,021,537 15.0% 1930 123,202,624 16.2% 1940 132,164,569 7.3% 1950 151,325,798 14.5% 1960 179,323,175 18.5% 1970 203,211,926 13.3% 1980 226,545,805 11.5% 1990 248,709,873 9.8% 2000 281,421,906 13.2% 2010 308,745,538 9.7% Contents
History
Main article: Demographic history of the United StatesUnder the current law, the Immigration and Nationality Act of 1965,[22] the number of first-generation immigrants living in the United States has quadrupled,[23] from 9.6 million in 1970 to about 38 million in 2007.[24] During the 1950s, 250,000 legal immigrants entered the country annually; by the 1990s, the number was almost one million, and the vast majority of new immigrants have come from Latin America and Asia. In 2009, 37% of immigrants originated in Asia, 42% in the Americas, and 11% in Africa.[25] Almost 97% of residents of the 10 largest American cities in 1900 were non-Hispanic whites.[26] In 2006, non-Hispanic whites were the minority in thirty-five of the fifty largest cities.[27] The Census Bureau reported that minorities accounted for 48.6% of the children born in the U.S. between July 2008 and July 2009.[28]
Cities
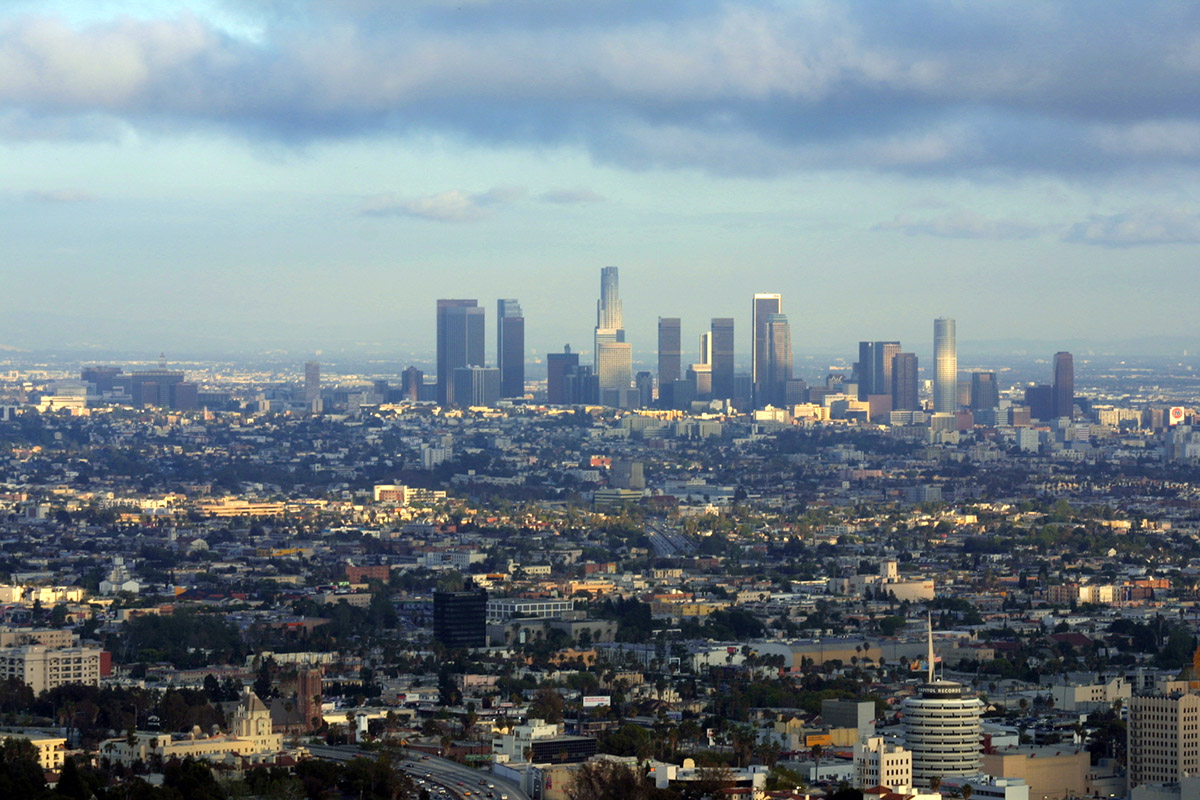
The United States has dozens of major cities, including 8 of the 60 "global cities"[29] of all types, with three in the "alpha" group of global cities: New York City, Los Angeles and Chicago.[30][31] As of 2008[update], the United States had 52 metropolitan areas with a population of over 1,000,000 people each. (See Table of United States Metropolitan Statistical Areas.)
As of 2011, about 250 million Americans live in or around urban areas. That means more than three-quarters of the U.S. population shares just about three percent of the U.S. land area.[32]
The following table shows the populations of the top ten cities and their metropolitan areas, as of July 1, 2008.
Leading U.S. population centers—see full lists of largest cities and largest metro areas Rank Core city Pop.[33] Metro rank Metropolitan Statistical Area Metro area pop.[34] Region[35]

New York City

Los Angeles1 New York City, New York 8,363,710 1 New York-Northern New Jersey-Long Island, NY-NJ-PA MSA 19,006,798 Northeast 2 Los Angeles, California 3,833,995 2 Los Angeles-Long Beach-Santa Ana, CA MSA 12,872,808 West 3 Chicago, Illinois 2,853,114 3 Chicago-Naperville-Joliet, IL-IN-WI MSA 9,569,624 Midwest 4 Houston, Texas 2,242,193 6 Houston-Sugar Land-Baytown, TX MSA 5,728,143 South 5 Phoenix, Arizona 1,567,924 12 Phoenix-Mesa-Glendale, AZ MSA 4,281,899 West 6 Philadelphia, Pennsylvania 1,447,395 5 Philadelphia-Camden-Wilmington, PA-NJ-DE-MD MSA 5,838,471 Northeast 7 San Antonio, Texas 1,351,305 28 San Antonio-New Braunfels, TX MSA 2,031,445 South 8 Dallas, Texas 1,279,910 4 Dallas-Fort Worth-Arlington, TX MSA 6,300,006 South 9 San Diego, California 1,279,329 17 San Diego-Carlsbad-San Marcos, CA MSA 3,001,072 West 10 San Jose, California 948,279 31 San Jose-Sunnyvale-Santa Clara, CA MSA 1,819,198 West 2008 U.S. Census Bureau estimates Population density
See also: List of United States cities by population density 2000 U.S. population density within each county, in persons per sq. mile (lower 48 states only): Light to dark (yellow to blue): 1-4 (y), 5-9 (lt. green), 10-24 (teal), 25-49 (dk. teal), 50-99 (blue-green), 100-249 (blue), 250-66,995 (dark blue).
The most densely populated state is New Jersey (1,121/mi2 or 433/km2). See List of U.S. states by population density for maps and complete statistics.
The United States Census Bureau publishes a popular "dot" or "nighttime" map showing population distribution at a resolution of 7,500 people,[36] as well as complete listings of population density by place name. [37]
Race and ethnicity
Main articles: People of the United States, Racial and ethnic demographics of the United States, and Hyphenated AmericanThe U.S. population's distribution by race and ethnicity in 2010 was as follows:[38]
Race Number Percentage White alone
(of which 26.7 million are White Hispanic and Latino Americans, see table below.
Excluding these, this category comprises 63.7% or 196.8 million)223,553,265 72.4% Black or African American alone 38,929,319 12.6% Some other race alone 19,107,368 6.2% Asian alone 14,674,252 4.8% Two or more races 9,009,073 2.9% American Indian or Alaska Native alone 2,932,248 0.9% Native Hawaiian or other Pacific Islander alone 540,013 0.2% Total 308,745,538 100.0% Hispanic or Latino origin
Each of the racial categories includes people who identify their ethnicity as Hispanic or Latino.[39] U.S. federal law defines Hispanic or Latino as "those who classify themselves in one of the specific Hispanic or Latino categories listed on the Census 2000 or ACS questionnaire - "Mexican", "Puerto Rican", or "Cuban" - as well as those who indicate that they are "other Spanish, Hispanic, or Latino.""[40]
The total population of Hispanic and Latino Americans comprised 50.5 million or 16.3% of the national total in 2010, with the following racial distribution:
Hispanic and Latino Americans by race (2010)[38] Race Population Percentage of all Hispanic and Latino Americans White 26,735,713 53.0% Some other race / 18,503,103 36.7% Two or more races 3,042,592 6.0% Black 1,243,471 2.5% American Indian and Alaska Native 685,150 1.4% Asian 209,128 0.4% Native Hawaiian and Pacific Islander 58,437 0.1% Total 50,477,594 100.0% Breakdown by state
Further information: Race and ethnicity in the United StatesThis table is incomplete: it is missing the category "Some other race".
State Population White Black AIAN* Asian NHPI* Mixed Race Maine 1,328,361 95.2 1.2 0.6 1.0 0 1.6 New Hampshire 1,316,470 93.9 1.1 0.2 2.2 0 1.6 Vermont 625,741 95.3 1.0 0.4 1.3 0 1.7 Rhode Island 1,052,567 81.4 5.7 0.6 2.9 0.1 3.3 Connecticut 3,574,097 77.6 10.1 0.3 3.8 0 2.6 New York 19,378,102 65.7 15.9 0.6 7.3 0 3.0 New Jersey 8,791,894 68.6 13.7 0.3 8.3 0 2.7 Delaware 897,934 68.9 21.4 0.5 3.2 0 2.7 Maryland 5,773,552 58.2 29.4 0.4 5.5 0.1 2.9 District of Columbia 601,723 38.5 50.7 0.3 3.5 0.1 2.9 Pennsylvania 12,702,379 81.9 10.8 0.2 2.7 0 1.9 West Virginia 1,852,994 93.9 3.4 0.2 0.7 0 1.5 Virginia 8,001,024 68.6 19.4 0.4 5.5 0.1 2.9 North Carolina 9,535,483 68.5 21.5 1.3 2.2 0.1 2.2 Tennessee 6,346,105 77.6 16.7 0.3 1.4 0.1 1.7 South Carolina 4,625,364 66.2 27.9 0.4 1.3 0.1 1.7 Georgia 9,687,653 59.7 30.5 0.3 3.2 0.1 2.1 Alabama 4,779,736 68.5 26.2 0.6 1.1 0 1.5 Florida 18,801,310 75.0 16.0 0.4 2.4 0.1 2.5 Louisiana 4,533,372 62.6 32.0 0.7 1.5 0 1.6 Mississippi 2,967,297 59.1 37.0 0.5 0.9 0 1.1 Arkansas 2,915,918 77.0 15.4 0.8 1.2 0.2 2.0 Kentucky 4,339,367 87.8 7.8 0.2 1.1 0.1 1.7 Missouri 5,988,927 82.8 11.6 0.5 1.6 0.1 2.1 Illinois 12,830,632 71.5 14.5 0.3 4.6 0 2.3 Indiana 6,483,802 84.3 9.1 0.3 1.6 0 2.0 Ohio 11,536,504 82.7 12.2 0.2 1.7 0 2.1 Michigan 9,883,640 78.9 14.2 0.6 2.4 0 2.3 Wisconsin 5,686,986 86.2 6.3 1.0 2.3 0 1.8 Minnesota 5,303,925 85.3 5.2 1.1 4.0 0 2.4 Iowa 3,046,355 91.3 2.9 0.4 1.7 0.1 1.8 North Dakota 672,591 90.0 1.2 5.4 1.0 0 1.8 South Dakota 814,180 85.9 1.3 8.8 0.9 0 2.1 Nebraska 1,826,341 86.1 4.5 1.0 1.8 0.1 2.2 Kansas 2,853,118 83.8 5.9 1.0 2.4 0.1 3.0 Oklahoma 3,751,351 72.2 7.4 8.6 1.7 0.1 5.9 Texas 25,145,561 70.4 11.8 0.7 3.8 0.1 2.7 New Mexico 2,059,179 68.4 2.1 9.4 1.4 0.1 3.7 Massachusetts 6,547,629 80.4 6.6 0.3 5.3 0.0 2.6 Colorado 5,029,196 81.3 4.0 1.1 2.8 0.1 3.4 Wyoming 563,626 90.7 0.8 2.4 0.8 0.1 2.2 Montana 989,415 89.4 0.4 6.3 0.6 0.1 2.5 Idaho 1,567,582 89.1 0.6 1.4 1.2 0.1 2.5 Utah 2,763,885 86.1 1.1 1.2 2.0 0.9 2.7 Arizona 6,392,017 73.0 4.1 4.6 2.8 0.2 3.4 Nevada 2,700,551 66.2 8.1 1.2 7.2 0.2 4.7 Oregon 3,831,074 83.6 1.8 1.4 3.7 0.3 3.8 Washington 6,724,540 77.3 3.6 1.5 7.2 0.6 4.7 California 37,253,956 57.6 6.2 1.0 13.0 0.4 4.9 Alaska 710,231 66.7 3.3 14.8 5.4 1.0 7.3 Hawaii 1,360,301 24.7 1.6 0.3 38.6 10.0 23.6 - All Data from 2010 U.S. Census Bureau[41] :
- * AIAN is American Indian or Alaskan Native; NHPI is Native Hawaiian or Pacific Islander :
Projections
U.S. Census Population projections[42] 2010 2050 Whites (includes "Some other race") 79.5% 74.0% Non-Hispanic Whites 64.7% 46.3% Hispanics/Latinos (of any race) 16.0% 30.2% African Americans 12.9% 13.0% Asian Americans 4.6% 7.8% A report by the U.S. Census Bureau projects a decrease in the ratio of Whites between 2010 and 2050, from 79.5% to 74.0%.[42] At the same time, Non-Hispanic Whites are projected to no longer make up the majority of the population by 2042, but will remain the largest single race. In 2050 they will compose 46.3% of the population. Non-Hispanic whites made up 85% of the population in 1960.[43] The report foresees the Hispanic or Latino population rising from 16% today to 30% by 2050, the African American percentage barely rising from 12.9% to 13.0%, and Asian Americans upping their 4.6% share to 7.8%. The U.S. has 310 million people as of October 2010, and is projected to reach 400 million by 2039 and 439 million in 2050.[20][44][45][46] It is further projected that 82% of the increase in population from 2005 to 2050 will be due to immigrants and their children.[47]
Of the nation's children in 2050, 62% are expected to be of a minority ethnicity, up from 44% today. Approximately 39% are projected to be Hispanic or Latino (up from 22% in 2008), and 38% are projected to be single-race, non-Hispanic Whites (down from 56% in 2008).[48]
In 2008, the US Census Bureau projected future censuses as follows:[20]
- 2010: 310,232,863
- 2020: 341,386,665
- 2030: 373,503,674
- 2040: 405,655,295
- 2050: 439,010,253
Other groups
There were 22.1 million veterans in 2009.[49]
In 2010, the Washington Post estimated that there were 11 million illegal immigrants in the country.[50]
There were about 2 million people in prison in 2010.[51]
File:US. Map States same-sex r.jpgDensity of same-sex households compared to all households by state.The 2000 U.S. Census counted same-sex couples in an oblique way; asking the sex and the relationship to the "main householder", whose sex was also asked. One organization specializing in analyzing gay demographic data reported, based on this count in the 2000 census and in the 2000 supplementary survey, that same-sex couples comprised between 0.99% and 1.13% of U.S. couples in 2000.[52] A 2006 report issued by The Williams Institute on Sexual Orientation concluded that the number of same-sex couples in the U.S. grew from 2000 to 2005, from nearly 600,000 couples in 2000 to almost 777,000 in 2005. 4.1% of Americans aged 18–45 identify as gay, lesbian, or bisexual[53] A 2011 report by the Institute estimated that 4 million adults identify as gay or lesbian, representing 1.7% of the population over 18. A spokesperson said that, until recently, few studies have tried to eliminate people who had occasionally had behaved or had homosexual thoughts, from people who identified as lesbian or gay.[54] (Older estimates have varied depending on methodology and timing; see Demographics of sexual orientation for a list of studies.) The American Community Survey from the 2000 U.S. Census estimated 776,943 same-sex couple households in the country as a whole, representing about 0.5% of the population.[53]
Less than 1% of Americans serve in the Armed Forces.[55]
Religion
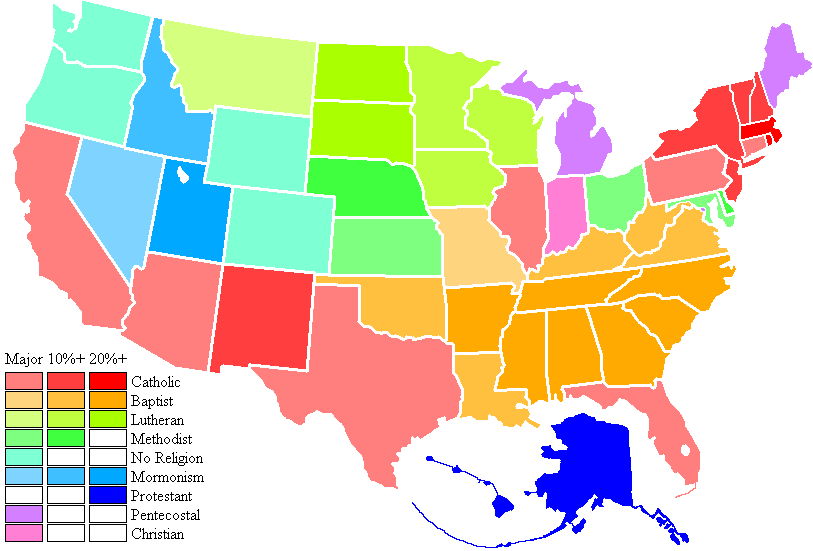
Main article: Religion in the United States Major religions by overall percentage
The table below is based mainly on selected data as reported to the United States Census Bureau. It only includes the voluntary self-reported membership of religious bodies with 750,000 or more. The definition of a member is determined by each religious body.[56] As of 2004[update], the US census bureau reported that about 13% of the population did not identify itself as a member of any religion.[57]
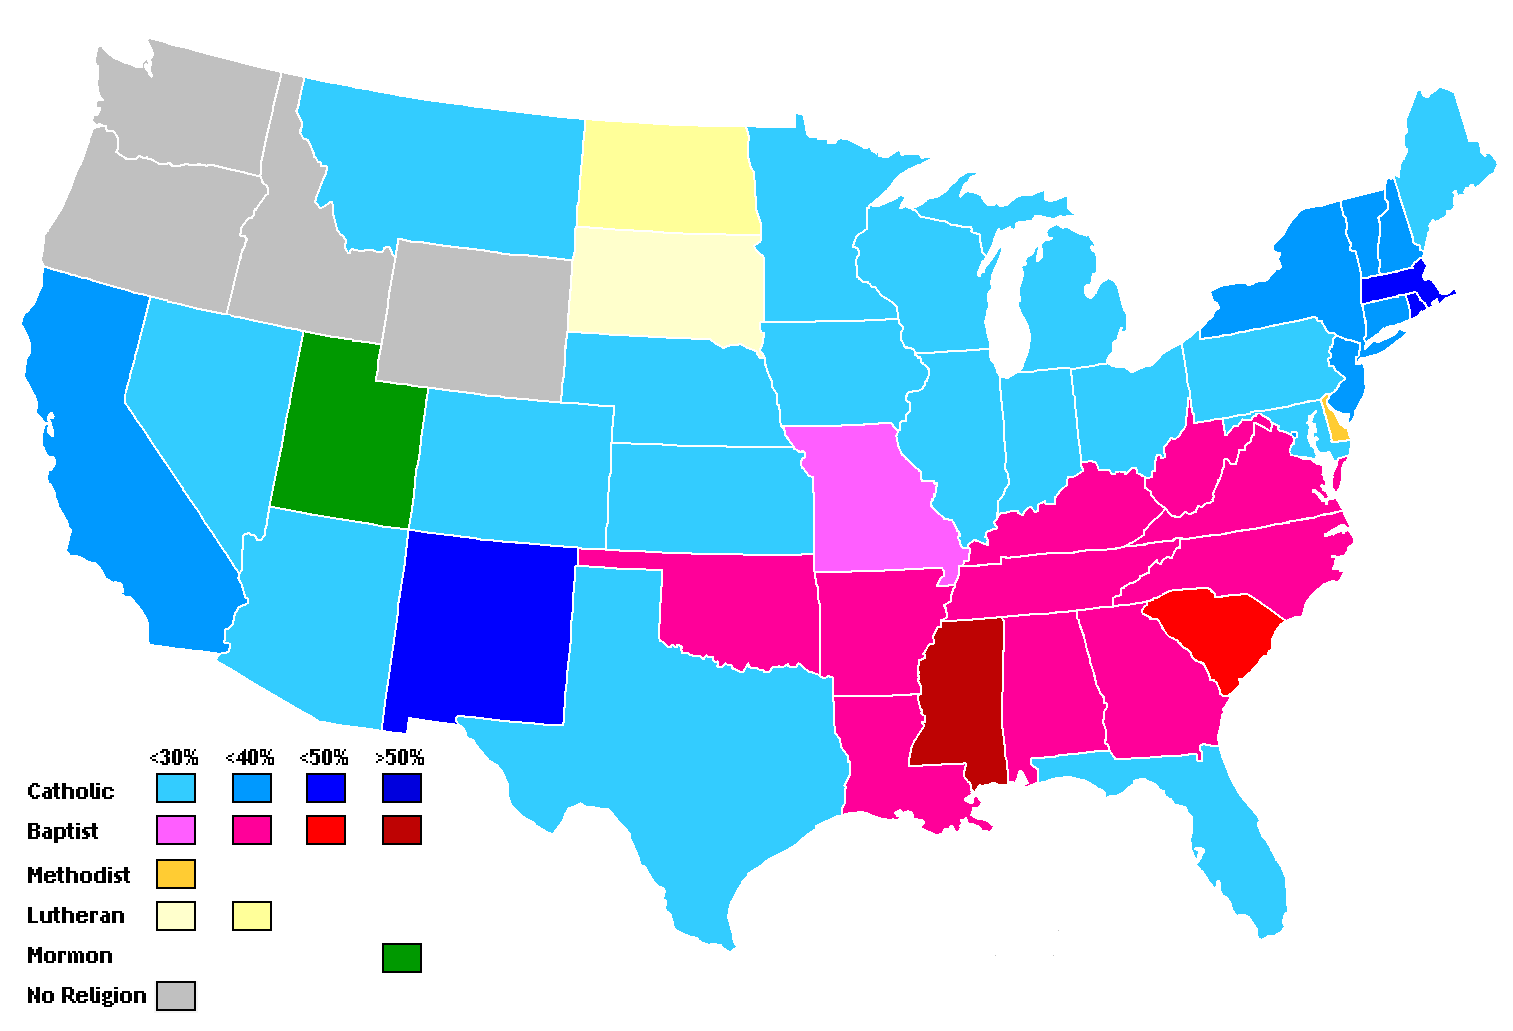
Religions of the United States 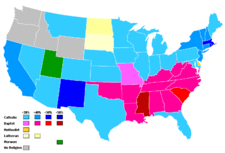 Plurality religion by state, 2001. Data is unavailable for Alaska and Hawaii.
 Religious affiliation within each state that has the largest deviation compared to the national average, 2001.
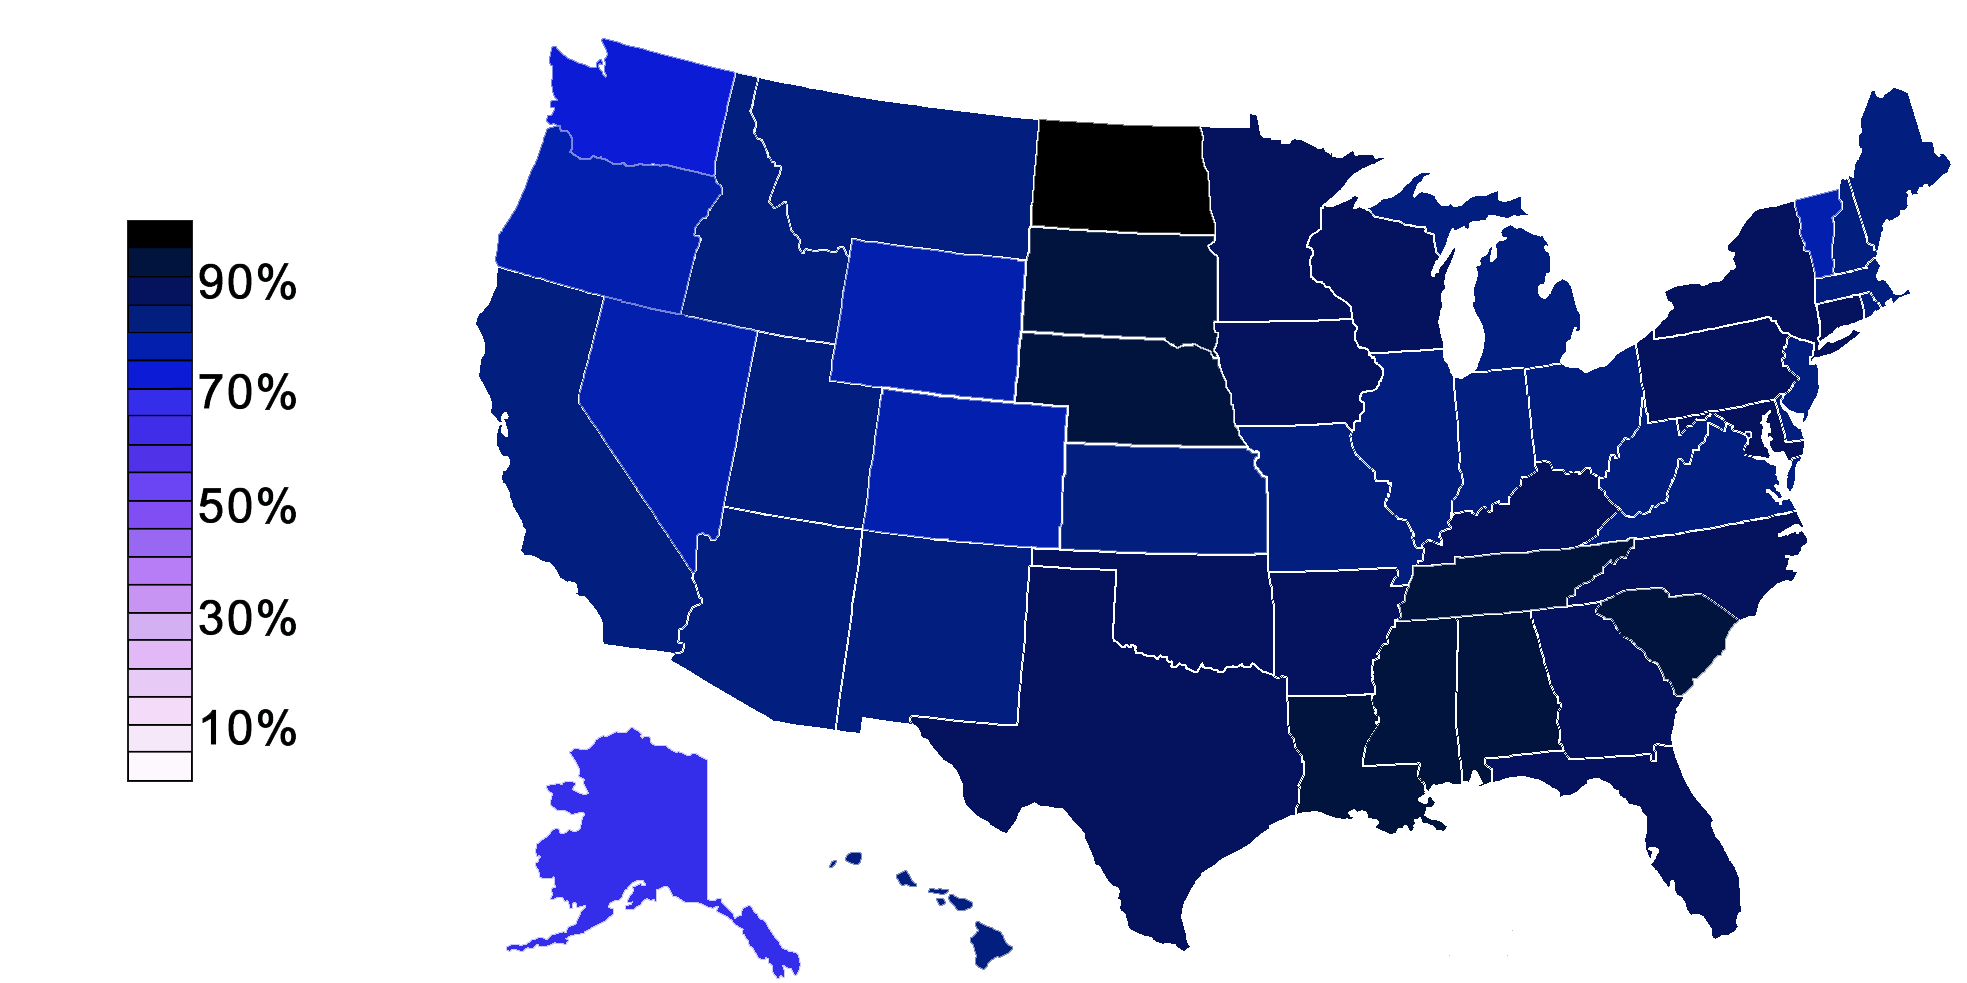
 Percentage of state populations that identify with a religion rather than "no religion", 2001.
Religions of American adults
Main article: Religion in the United StatesThe United States government does not collect religious data in its census. The survey below, the American Religious Identification Survey (ARIS) 2008, was a random digit-dialed telephone survey of 54,461 American residential households in the contiguous United States. The 1990 sample size was 113,723; 2001 sample size was 50,281
Adult respondents were asked the open-ended question, "What is your religion, if any?". Interviewers did not prompt or offer a suggested list of potential answers. The religion of the spouse or partner was also asked. If the initial answer was "Protestant" or "Christian" further questions were asked to probe which particular denomination. About one third of the sample was asked more detailed demographic questions.
Religious Self-Identification of the U.S. Adult Population: 1990, 2001, 2008[60]
Figures are not adjusted for refusals to reply; investigators suspect refusals are possibly more representative of "no religion" than any other group.Source:ARIS 2008[60] Group 1990
adults
x 1,0002001
adults
x 1,0002008
adults
x 1,000
Numerical
Change
1990-
2008
as %
of 19901990
% of
adults2001
% of
adults2008
% of
adultschange
in % of
total
adults
1990-
2008Adult population, total 175,440 207,983 228,182 30.1% Adult population, Responded 171,409 196,683 216,367 26.2% 97.7% 94.6% 94.8% -2.9% Total Christian 151,225 159,514 173,402 14.7% 86.2% 76.7% 76.0% -10.2% Catholic 46,004 50,873 57,199 24.3% 26.2% 24.5% 25.1% -1.2% non-Catholic Christian 105,221 108,641 116,203 10.4% 60.0% 52.2% 50.9% -9.0% Baptist 33,964 33,820 36,148 6.4% 19.4% 16.3% 15.8% -3.5% Mainline Christian 32,784 35,788 29,375 -10.4% 18.7% 17.2% 12.9% -5.8% Methodist 14,174 14,039 11,366 -19.8% 8.1% 6.8% 5.0% -3.1% Lutheran 9,110 9,580 8,674 -4.8% 5.2% 4.6% 3.8% -1.4% Presbyterian 4,985 5,596 4,723 -5.3% 2.8% 2.7% 2.1% -0.8% Episcopalian/Anglican 3,043 3,451 2,405 -21.0% 1.7% 1.7% 1.1% -0.7% United Church of Christ 438 1,378 736 68.0% 0.2% 0.7% 0.3% 0.1% Christian Generic 25,980 22,546 32,441 24.9% 14.8% 10.8% 14.2% -0.6% Jehovah's Witness 1,381 1,331 1,914 38.6% 0.8% 0.6% 0.8% 0.1% Christian Unspecified 8,073 14,190 16,384 102.9% 4.6% 6.8% 7.2% 2.6% Non-denominational Christian 194 2,489 8,032 4040.2% 0.1% 1.2% 3.5% 3.4% Protestant - Unspecified 17,214 4,647 5,187 -69.9% 9.8% 2.2% 2.3% -7.5% Evangelical/Born Again 546 1,088 2,154 294.5% 0.3% 0.5% 0.9% 0.6% Pentecostal/Charismatic 5,647 7,831 7,948 40.7% 3.2% 3.8% 3.5% 0.3% Pentecostal - Unspecified 3,116 4,407 5,416 73.8% 1.8% 2.1% 2.4% 0.6% Assemblies of God 617 1,105 810 31.3% 0.4% 0.5% 0.4% 0.0% Church of God 590 943 663 12.4% 0.3% 0.5% 0.3% 0.0% Other Protestant Denominations 4,630 5,949 7,131 54.0% 2.6% 2.9% 3.1% 0.5% Churches of Christ 1,769 2,593 1,921 8.6% 1.0% 1.2% 0.8% -0.2% Seventh-Day Adventist 668 724 938 40.4% 0.4% 0.3% 0.4% 0.0% Mormon/Latter-Day Saints 2,487 2,697 3,158 27.0% 1.4% 1.3% 1.4% 0.0% Total non-Christian religions 5,853 7,740 8,796 50.3% 3.3% 3.7% 3.9% 0.5% Jewish 3,137 2,837 2,680 -14.6% 1.8% 1.4% 1.2% -0.6% Eastern Religions 687 2,020 1,961 185.4% 0.4% 1.0% 0.9% 0.5% Buddhist 404 1,082 1,189 194.3% 0.2% 0.5% 0.5% 0.3% Muslim 527 1,104 1,349 156.0% 0.3% 0.5% 0.6% 0.3% New Religious Movements & Others 1,296 1,770 2,804 116.4% 0.7% 0.9% 1.2% 0.5% None/ No religion, total 14,331 29,481 34,169 138.4% 8.2% 14.2% 15.0% 6.8% Agnostic+Atheist 1,186 1,893 3,606 204.0% 0.7% 0.9% 1.6% 0.9% Did Not Know/ Refused to reply 4,031 11,300 11,815 193.1% 2.3% 5.4% 5.2% 2.9% Marriage
In 2010, the median age for marriage for men was 27; for women, 26.[61]
Income
Main articles: Household income in the United States, Personal income in the United States, Affluence in the United States, and Income inequality in the United StatesIn 2006, the median household income in the United States was around $46,000. Household and personal income depends on variables such as race, number of income earners, educational attainment and marital status.
Median income levels Households Persons, age 25 or older with earnings Household income by race All households Dual earner
householdsPer household
memberMales Females Both sexes Asian White,
non-hispanicHispanic Black $46,326 $67,348 $23,535 $39,403 $26,507 $32,140 $57,518 $48,977 $34,241 $30,134 Median personal income by educational attainment Measure Some High School High school graduate Some college Associate's degree Bachelor's degree or higher Bachelor's degree Master's degree Professional degree Doctorate degree Persons, age 25+ w/ earnings $20,321 $26,505 $31,054 $35,009 $49,303 $43,143 $52,390 $82,473 $70,853 Male, age 25+ w/ earnings $24,192 $32,085 $39,150 $42,382 $60,493 $52,265 $67,123 $100,000 $78,324 Female, age 25+ w/ earnings $15,073 $21,117 $25,185 $29,510 $40,483 $36,532 $45,730 $66,055 $54,666 Persons, age 25+, employed full-time $25,039 $31,539 $37,135 $40,588 $56,078 $50,944 $61,273 $100,000 $79,401 Household $22,718 $36,835 $45,854 $51,970 $73,446 $68,728 $78,541 $100,000 $96,830 Household income distribution Bottom 10% Bottom 20% Bottom 25% Middle 33% Middle 20% Top 25% Top 20% Top 5% Top 1.5% Top 1% $0 to $10,500 $0 to $18,500 $0 to $22,500 $30,000 to $62,500 $35,000 to $55,000 $77,500 and up $92,000 and up $167,000 and up $250,000 and up $350,000 and up Source: US Census Bureau, 2006; income statistics for the year 2005 Social class
Main article: Social class in the United StatesSocial classes in the United States lack distinct boundaries and may overlap. Even their existence (when distinguished from economic strata) is controversial. The following table provides a summary of some currently prominent academic theories on the stratification of American society:
Academic Class Models Dennis Gilbert, 2002 William Thompson & Joseph Hickey, 2005 Leonard Beeghley, 2004 Class Typical characteristics Class Typical characteristics Class Typical characteristics Capitalist class (1%) Top-level executives, high-rung politicians, heirs. Ivy League education common. Upper class (1%) Top-level executives, celebrities, heirs; income of $500,000+ common. Ivy league education common. The super-rich (0.9%) Multi-millionaires whose incomes commonly exceed $350,000; includes celebrities and powerful executives/politicians. Ivy League education common. Upper middle class[1] (15%) Highly-educated (often with graduate degrees), most commonly salaried, professionals and middle management with large work autonomy. Upper middle class[1] (15%) Highly-educated (often with graduate degrees) professionals & managers with household incomes varying from the high 5-figure range to commonly above $100,000. The Rich (5%) Households with net worth of $1 million or more; largely in the form of home equity. Generally have college degrees. Middle class (plurality/
majority?; ca. 46%)College-educated workers with considerably higher-than-average incomes and compensation; a man making $57,000 and a woman making $40,000 may be typical. Lower middle class (30%) Semi-professionals and craftsmen with a roughly average standard of living. Most have some college education and are white-collar. Lower middle class (32%) Semi-professionals and craftsman with some work autonomy; household incomes commonly range from $35,000 to $75,000. Typically, some college education. Working class (30%) Clerical and most blue-collar workers whose work is highly routinized. Standard of living varies depending on number of income earners, but is commonly just adequate. High school education. Working class (32%) Clerical, pink- and blue-collar workers with often low job security; common household incomes range from $16,000 to $30,000. High school education. Working class
(ca. 40% - 45%)Blue-collar workers and those whose jobs are highly routinized with low economic security; a man making $40,000 and a woman making $26,000 may be typical. High school education. Working poor (13%) Service, low-rung clerical and some blue-collar workers. High economic insecurity and risk of poverty. Some high school education. Lower class (ca. 14% - 20%) Those who occupy poorly-paid positions or rely on government transfers. Some high school education. Underclass (12%) Those with limited or no participation in the labor force. Reliant on government transfers. Some high school education. The poor (ca. 12%) Those living below the poverty line with limited to no participation in the labor force; a household income of $18,000 may be typical. Some high school education. - References: Gilbert, D. (2002) The American Class Structure: In An Age of Growing Inequality. Belmont, CA: Wadsworth; Thompson, W. & Hickey, J. (2005). Society in Focus. Boston, MA: Pearson, Allyn & Bacon; Beeghley, L. (2004). The Structure of Social Stratification in the United States. Boston, MA: Pearson, Allyn & Bacon.
- 1 The upper middle class may also be referred to as "Professional class" Ehrenreich, B. (1989). The Inner Life of the Middle Class. NY, NY: Harper-Colins.
Health
In 2010, the average man weighed 194.7 pounds (88.3 kg); the average woman 164.7 pounds (74.7 kg).[62][dead link]
A nationwide study in 2010 indicated that 19.5% of teens, aged 12–19, have developed "slight" hearing loss. "Slight" was defined as an inability to hear at 16 to 24 decibels.[63]
Cohorts in the United States
A study by William Strauss and Neil Howe, in their books Generations and Fourth Turning, looked at generational similarities and differences going back to the 15th century and concluded that over 80 year spans, generations proceed through 4 stages of about 20 years each. The first phase consists of times of relative crisis and the people born during this period were called "artists". The next phase was a "high" period and those born in this period were called "prophets". The next phase was an "awakening period" and people born in this period were called "nomads". The final stage was the "unraveling period" and people born in this period were called "heroes". The most recent "high period" occurred in the 50s and 60s (hence baby boomers are the most recent crop of "prophets").
The most definitive recent study of the US generational cohorts was done by Schuman and Scott (1989) in 1985 in which a broad sample of adults of all ages were asked, "What world events are especially important to you?"[64] They found that 33 events were mentioned with great frequency. When the ages of the respondents were correlated with the expressed importance rankings, seven (some put 8 or 9) distinct cohorts became evident. Today the following descriptors are frequently used for these cohorts (currently mainly alive in 2000-10):
- Depression cohort (born from 1910/12 to 1919/21).
- Distinction: Currently, they represent the largest number of senior citizens alive in any time of US history.
- Memorable events: The Great Depression, high levels of unemployment, poverty, lack of creature comforts, financial uncertainty, peak of European immigration (though started from 1840 to ended by 1920), grew up during World War I, prohibitionism, radical politics, religious fundamentalism, shorter life spans, and stressed Americanization or acculturation into a common mainstream U.S. culture.
- Key characteristics: strive for financial security, risk averse, waste-not-want-not attitude, strive for comfort, social cooperative, can be reactionary or hostile towards change, but are idealistic or progressive in improvements of quality of life.
- Pre 'World War II cohort' (born from 1920/22 to 1927/28).
- Distinction: Established American culture in the 20th century.
- Memorable events: men left to go to war and some did not return, the personal experience of the war, women working in factories, focus on defeating a common enemy, unity of peoples in a country, sacrifice (i.e. food rations and donated material), devoted to the war effort, and placed white ethnics or those of Irish, Italian, Jewish and Southern or Eastern Europeans in prominence.
- Key characteristics: the nobility of sacrifice for the common good, patriotism, socialism to a certain degree, team player, soldier, volunteerism, high work ethic, and experimental in social liberal attitudes but are generally more socially conservative.
- World War II cohort (born from 1928/29 to 1943/45) - others subdivide them to Crash and New Deal cohorts.
- Distinction: Second smallest generation born in US history, the birth rate peaked low due to the Depression.
- Memorable events: sustained economic growth, social tranquility, The Cold War, McCarthyism, anti-communism, drug culture, conformity, the rise and peak of jazz music, fear of a nuclear war, and avoidance of discomfort with high emphasis of optimism.
- Key characteristics: conformity, conservatism, patriotism, comparably religious or emphasized traditional values (i.e. manners or taboos) than younger cohorts (whom disagreed with them), traditional family values, but had the nuclear family replaced the multi-generational kind, known as the "Silent" majority/generation, and had the appearance of sameness or "cookie cutter" type of sameness.
- Baby Boomer cohort #1[citation needed] (born from 1944/46 to 1953/55).
- Distinction: One of two largest generations in size in US history.
- Memorable events: assassinations of JFK, Robert Kennedy, and Martin Luther King, Liberalism, political unrest, walk on the moon, Vietnam War, anti-war protests, social experimentation, sexual freedom, civil rights movement, environmental movement, women's movement, protests and riots, rise and peak of rock and roll, and experimentation with various intoxicating recreational substances.
- Key characteristics: experimental, progressive, individualism, free spirited, social cause oriented, activism, social change, "Live and let live", "Do your own thing", Pacifism, Spiritualism, alternative lifestyles, deeply against racism as well sexism and ethnic prejudice, and first generation thought to demand an eradication of poverty by government programs (War on Poverty).
- Boomer cohort #2 - "Generation Jones," born 1954/56-1965/67.
- Distinction: The Peak years due to being children or teenagers when American power peaked in the global scene.
- Memorable events: Watergate, Nixon resigns, the cold war, the oil embargo, raging inflation, Disco, gasoline shortages, the American hostage crisis of Iran (1979–81), the U.S. Bicentennial celebrations in the 1970s, and cultural shift from conservative to liberal to back into social conservative or social liberal phases.
- Key characteristics: less optimistic, fatalistic, pragmatic, general cynicism, somewhat reactionary, an urge for things must change, born again Christian movement, yuppie social trends, challenged gender roles and racial stereotypes, and used drugs illegal since the early 1900s[65][66][67] thereby precipitating the modern War on Drugs in the 1970s and 80s.
- Generation X cohort (born from 1965/66 to 1979/80).
- Distinction: Dubbed Baby Bust they are the smallest generation born in US history.
- Memorable events: Challenger explosion, Iran-Contra, Reaganomics, AIDS, Star Wars, MTV, home computers, video games, safe sex, divorce, single-parent families, end of Cold War-fall of Berlin Wall, Gulf War, 1992 L.A. Riots, 1995 Oklahoma City Bombing, the 1998 Bill Clinton-Monica Lewinski sex scandal, and the arrival of the year 2000: new century/ new millennium.
- Key characteristics: quest for emotional security, independent, informality, entrepreneurial, paleoliberal or left-wing attitudes, fatalistic worldview, somewhat pessimist, many grew up in single-parent households and thought to be the first generation to live worse than their parents' cohorts.
- Generation Y Cohort or Millennials (born from 1981/82 to 1998/99) - esp. anyone born before 1993/94 (currently over ages 16–18).
- Distinction: Echo Boom they are second highest birth rate generation in US history.
- Memorable events: The Death of Osama Bin laden, rise of the Internet, September 11 attacks, iPods, social network services, war on crime (reduced crime rates), cultural diversity, Afghanistan War and Iraq War, and affected by the 2008-09 global financial crisis or "Great Recession".
- Key characteristics: acceptance of change, technically savvy, environmental issues, globally minded, neo-conservative comeback, ideal of a nanny state, stricter laws on minors, high tech surveillance of public places, political correctness, no expectation of military service, and increased local volunteerism or community service.
- Generation Z also called Millennials or Y2K babies are the generation born after 1994/95 to the years 2000/01 are currently teenagers, but they may share some Generation Y characteristics. They happen to be more tolerant of social groups (i.e. homosexuality, gay rights and same-sex marriage), but have some right-wing traits when it comes to politics, religion and economics, due to their upbringing and parents' fiscal conservative values; And more likely not to move out on their own.
U.S. Demographic birth cohorts
Main article: Demographics of the United States
The US Census Bureau generally[weasel words]considers the following demographic birth cohorts[citation needed] based on birth rate, which is statistically measurable:
- Classics (born from 1900 to 1920)
- (the last American cohort in which the population pyramid takes on the standard "step" form for males and females).
- The Centenarian, Diamond, Golden Years or Silver Dollar are nicknames for these generational cohorts born in the late 19th century, but virtually died out.
- Baby Bust (I) (born from 1921 to 1945)
- early cohort (born from 1921 to 1933)
- late cohort (born from 1934 to 1946)
- Baby Boomers (born from 1946 to 1964)
- Boomer Cohort #1 (born from 1946 to 1957)
- Boomer Cohort #2 (born from 1957 to 1964)
- GenX/Baby Bust (II) (born from 1964 to 1976)
- GenY/Echo Boomers (born from 1976 to 1994)
- Leading Edge (born from 1977 to 1990)
- Trailing Edge (born from 1990 to 1994, or 1996)
- Millennials (born from 1995 to 1999, or since 2000)
Subdivided groups are present when peak boom years or inverted peak bust years are present, and may be represented by a normal or inverted bell-shaped curve (rather than a straight curve). The boom subdivided cohorts may be considered as "pre-peak" (including peak year) and "post-peak". The year 1957 was the baby boom peak with 4.3 million births and 122.7 fertility rate. Although post-peak births (such as trailing edge boomers) are in decline, and sometimes referred to as a "bust", there are still a relative large number of births. The dearth-in-birth bust cohorts include those up to the valley birth year, and those including and beyond, leading up to the subsequent normal birth rate. The Baby boom began around 1943 to 1946.
From the decline in U.S. birth rates starting in 1958 and the introduction of the birth control pill in 1960, the Baby Boomer normal distribution curve is negatively skewed. The trend in birth rates from 1958 to 1961 show a tendency to end late in the decade at approximately 1969, thus returning to pre-WWII levels, with 12 years of rising and 12 years of declining birth rates. Pre-war birth rates were defined as anywhere between 1939 and 1941 by demographers such as the Taeuber's, Philip M. Hauser and William Fielding Ogburn.[68] From 1962 to 1964, trend analysis points to 1965 as being the first year to return to baseline birth rates, possibly referring to this cohort as "Generation X". Then came "Generation Y" sometimes a second cohort of the Baby Bust era, and finally "Generation Z" are children of Generation X, although Z shares similar characteristics of Generation Y whom are akin to X-ers. But all of them are post-Boomers.
Demographic statistics
The following demographic statistics are from the CIA World Factbook, unless otherwise indicated.[69]
Median age
- 36.8 years (male: 35.5 years, female: 38.1 years, 2010 est.)
Age structure
Further information: Children and adolescents in the United States A population pyramid that shows the age of the population by sex in 2000.
- 0-14 years: 20.2% (male 31,639,127/female 30,305,704)
- 15–64 years: 67% (male 102,665,043/female 103,129,321)
- 65 years and over: 12.8% (male 16,901,232/female 22,571,696) (2010 est.)
Population growth rate
- 0.963% (2011 est.)
Birth rate
- 13.5 births/1,000 population (2010 est.). This is the lowest in a century. There were 4,136,000 births in 2009.[70]
- 13.9 births/1,000 population/year (Provisional Data for 2008)
- 14.3 births/1,000 population/year (Provisional Data for 2007)[71]
In 2009, Time magazine reported that 40% of births were to unmarried women.[72] The following is a breakdown by race for unwed births: 17% Asian mothers, 29% white, 53% Hispanics, 66% Native Americans, and 72% black.[73]
The drop in the birth rate from 2007 to 2009 is believed to be associated with the Late-2000s recession[74]
Death rate
- 8.38 deaths/1,000 population (July 2010 est.)
Immigration
- 13% of the population was foreign-born in 2009.[75]
Net migration rate
- 4.32 migrant(s)/1,000 population (2010 est.)
Sex ratios
- at birth: 1.048 male(s)/female
- under 15 years: 1.04 male(s)/female
- 15-64 years: 1 male(s)/female
- 65 years and over: 0.75 male(s)/female
- total population: 0.97 male(s)/female (2010 est.)
Infant mortality rate
- total: 6.22 deaths/1,000 live births
- male: 6.9 deaths/1,000 live births
- female: 5.51 deaths/1,000 live births (2010 est.)
Life expectancy at birth
- total population: 78.11 years
- male: 75.65 years
- female: 80.69 years (2010 est.)
Total fertility rate
- 2.06 children born/woman (2011 est.)
Unemployment rate
As of October 2011 the U6 unemployment rate is 16.2 percent. [76] The U6 unemployment rate counts not only people without work seeking full-time employment (the more familiar U-3 rate), but also counts "marginally attached workers and those working part-time for economic reasons." Note that some of these part-time workers counted as employed by U-3 could be working as little as an hour a week. And the "marginally attached workers" include those who have gotten discouraged and stopped looking, but still want to work. The age considered for this calculation is 16 years and over.[77]
As of July 2011[update] the U.S. unemployment rate was 9.1 (U3 Rate) percent.[78]
Nationality
- noun: American(s)
- adjective: American
See also
Income in the United States Income by:
- State (localities by state)
- County (highest | lowest)
- Metropolitan statistical area
- Place (highest | lowest)
- Urban areas
- ZIP Code Tabulation Area
- U.S. demographic birth cohorts
- Maps of American ancestries
- Languages of the United States
- Immigration to the United States
- Emigration from the United States
- Places in the United States with notable demographic characteristics
- Demographic history of the United States
- Racial and ethnic demographics of the United States
- Historical Statistics of the United States
Lists:
- Lists of U.S. cities with non-white majority populations
- List of the largest metropolitan areas in the Americas
- List of U.S. states and territories by population
Income:
- Household income in the United States
- Personal income in the United States
- Affluence in the United States
- Highest-income places in the United States
- Lowest-income counties in the United States
References
- ^ "CIA World Factbook". CIA World Factbook. December 2010. https://www.cia.gov/library/publications/the-world-factbook/fields/2212.html. Retrieved 2010-12-11.[dead link]
- ^ "CIA World Factbook". CIA World Factbook. https://www.cia.gov/library/publications/the-world-factbook/geos/us.html. Retrieved 2010-12-11.
- ^ "Table 13. State Population - Rank, Percent Change, and Population Density" (Excel). U.S. Census Bureau. 2008. http://www.census.gov/compendia/statab/2010/tables/10s0013.xls. Retrieved 2010-10-24.
- ^ "Mean Center of Population for the United States: 1790 to 2000" (PDF). http://www.census.gov/geo/www/cenpop/meanctr.pdf. Retrieved 2010-10-24.
- ^ "Annual Estimates of the Resident Population for Incorporated Places over 100,000, Ranked by July 1, 2009 Population: April 1, 2000 to July 1, 2009 (SUB-EST2009-01)". U.S. Census Bureau. http://www.census.gov/popest/cities/SUB-EST2009.html. Retrieved 2011-05-19.
- ^ "Births: Preliminary Data for 2009". National Vital Statistics reports (National Vital Statistics System) 59 (3). December 21, 2010. http://www.cdc.gov/nchs/data/nvsr/nvsr59/nvsr59_03.pdf.
- ^ "CIA - The World Factbook - Notes and Definitions". https://www.cia.gov/library/publications/the-world-factbook/docs/notesanddefs.html#2127. Retrieved 2010-02-01.
- ^ In December 2010, the National Vital Statistics System reported that 2009 preliminary total fertility rate (TFR) in 2009 was 2,007.5 births per 1,000 women, 4 percent lower than the rate in 2008.[6] The CIA Factbook estimates the U.S. Total Fertility Rate in 2010 as 2.06.[7]
- ^ a b "CIA - The World Factbook -- Field Listing - Population growth rate". CIA. https://www.cia.gov/library/publications/the-world-factbook/fields/2002.html. Retrieved 2009-01-10.
- ^ "CIA - The World Factbook -- Rank Order - Total fertility rate". CIA. https://www.cia.gov/library/publications/the-world-factbook/rankorder/2127rank.html. Retrieved 2010-02-01.
- ^ "CIA - The World Factbook -- Rank Order - Net migration rate". CIA. https://www.cia.gov/library/publications/the-world-factbook/rankorder/2112rank.html. Retrieved 2009-02-23.
- ^ "Monthly Population Estimates for the United States: April 1, 2000 to December 1, 2009 (NA-EST2009-01)". U.S. Census Bureau, Population Division. December, 2009. http://www.census.gov/popest/national/NA-EST2009-01.html. Retrieved 2010-01-06.
- ^ a b "United States - Age and Sex". 2009 American Community Survey 1-Year Estimates. United States Census Bureau. http://factfinder.census.gov/servlet/STTable?_bm=y&-geo_id=01000US&-qr_name=ACS_2009_1YR_G00_S0101&-ds_name=ACS_2009_1YR_G00_&-_lang=en&-redoLog=false&-state=st&-CONTEXT=st. Retrieved 2010-10-24.
- ^ CO2 Emissions from Fuel Combustion Population 1971-2008 (pdf pages 83-85) IEA (OECD/ World Bank) (original population ref OECD/ World Bank e.g. in IEA Key World Energy Statistics 2010 page 57)
- ^ "Statistical Abstract of the United States" (PDF). United States Census Bureau. http://www.census.gov/prod/2005pubs/06statab/pop.pdf.
- ^ "U.S. population hits 300 million mark". MSNBC (Associated Press). 2006-10-17. http://www.msnbc.msn.com/id/15298443/. Retrieved 2006-10-17.
- ^ "Population Is Now One-Third Minority". http://www.prb.org/Articles/2006/IntheNewsUSPopulationIsNowOneThirdMinority.aspx?p=1U.S..
- ^ "U.S. Census Bureau: Minority Population Tops 100 Million". Archived from the original on 2008-04-20. http://web.archive.org/web/20080420095712/http://www.census.gov/Press-Release/www/releases/archives/population/010048.html.
- ^ "U.S. Population Projections: 2005-2050 - Pew Hispanic Center". Pewhispanic.org. http://pewhispanic.org/reports/report.php?ReportID=85. Retrieved 2011-09-19.
- ^ a b c "Projected Population by Single Year of Age, Sex, Race, and Hispanic Origin for the United States: July 1, 2000 to July 1, 2050". U.S. Census Bureau. http://www.census.gov/population/www/projections/downloadablefiles.html. Retrieved 2009-12-08.
- ^ "World Population Prospects: The 2006 Revision, Highlights, Working Paper No. ESA/P/WP.202; Table A.2" (PDF). United Nations, Department of Economic and Social Affairs, Population Division (2007). http://www.un.org/esa/population/publications/wpp2006/WPP2006_Highlights_rev.pdf. Retrieved 2009-01-10.
- ^ "Not Just Black and White: Historical and Contemporary Perspectives on Immigration, Race, and Ethnicity in the United States". Nancy Foner, George M. Fredrickson (2005). p.120. ISBN 0-87154-270-6
- ^ "Immigrants in the United States and the Current Economic Crisis", Demetrios G. Papademetriou and Aaron Terrazas, Migration Policy Institute, April 2009.
- ^ "Immigration Worldwide: Policies, Practices, and Trends". Uma A. Segal, Doreen Elliott, Nazneen S. Mayadas (2010). Oxford University Press US. p.32. ISBN 0-19-538813-5
- ^ "CBO: 748,000 Foreign Nationals Granted U.S. Permanent Residency Status in 2009 Because They Had Immediate Family Legally Living in America". CNSnews.com. January 11, 2011
- ^ ""The First Measured Century: An Illustrated Guide to Trends in America, 1900–2000"". Public Broadcasting Service (PBS).
- ^ "Changing Face of Western Cities". The Washington Post. August 21, 2006.
- ^ "U.S. Nears Racial Milestone". The Wall Street Journal. June 11, 2010.
- ^ "The 2008 Global Cities Index". Foreign Policy (November/December 2008). October 21, 2008. http://www.foreignpolicy.com/story/cms.php?story_id=4509. Retrieved 2009-01-30.
- ^ "The World According to GaWC - Classification of cities 2008". 2008. http://www.lboro.ac.uk/gawc/world2008t.html. Retrieved 2010-06-24.
- ^ "The World According to GaWC - Cartogram of alpha cities 2008". 2008. http://www.lboro.ac.uk/gawc/world2008c.html. Retrieved 2010-06-24.
- ^ American cities on the rebound
- ^ "Table 1: Annual Estimates of the Resident Population for Incorporated Places Over 100,000, Ranked by July 1, 2008 Population: April 1, 2000 to July 1, 2008" (PDF). 2008 Population Estimates. U.S. Census Bureau, Population Division. 2009-07-01. http://hawaii.gov/dbedt/info/census/popestimate/copy_of_2008-subcounty-population-hawaii/SUB_EST2008_01.pdf. Retrieved 2009-10-11.
- ^ "Table 5. Estimates of Population Change for Metropolitan Statistical Areas and Rankings: July 1, 2007 to July 1, 2008" (PDF). 2008 Population Estimates. U.S. Census Bureau. 2009-03-19. http://hawaii.gov/dbedt/info/census/popestimate/2008_MSA_Hawaii/CBSA_EST2008_05.pdf. Retrieved 2009-10-11.
- ^ "Figure A–3. Census Regions, Census Divisions, and Their Constituent States". U.S. Census Bureau. http://www.census.gov/geo/www/tiger/glossry2.pdf. Retrieved 2007-06-17.
- ^ Census 2010 Population Distribution in the United States and Puerto Rico. U.S. Census Bureau. http://www.census.gov/geo/www/maps/2010_census_nighttime_map/nighttime_map_2010.html.
- ^ Density Using Land Area For States, Counties, Metropolitan Areas, and Places. U.S. Census Bureau. http://www.census.gov/population/www/censusdata/density.html. Retrieved 2007-12-14.
- ^ a b Overview of Race and Hispanic Origin: 2010
- ^ "U.S. Census Bureau Guidance on the Presentation and Comparison of Race and Hispanic Origin Data". http://www.census.gov/population/www/socdemo/compraceho.html. Retrieved 2007-04-05. "Race and Hispanic origin are two separate concepts in the federal statistical system. People who are Hispanic may be of any race. People in each race group may be either Hispanic or Not Hispanic. Each person has two attributes, their race (or races) and whether or not they are Hispanic."
- ^ "American FactFinder Help: Hispanic or Latino origin". U.S. Census Bureau. http://factfinder.census.gov/home/en/epss/glossary_h.html. Retrieved 2008-06-13.
- ^ "U.S. Census Bureau Data". U.S. Census Bureau. http://quickfacts.census.gov/qfd/index.html. Retrieved 2011-07-13.
- ^ a b "Table 4. Projections of the Population by Sex, Race, and Hispanic Origin for the United States: 2010 to 2050" (Excel). U.S. Census Bureau. http://www.census.gov/population/www/projections/files/nation/summary/np2008-t4.xls. Retrieved 2010-10-24.
- ^ U.S. Hispanic population to triple by 2050, USATODAY.com
- ^ White Americans no longer a majority by 2042[dead link]
- ^ U.S. to Grow Grayer, More Diverse
- ^ Pew Research Center: Immigration to Play Lead Role In Future U.S. Growth
- ^ Whites to become minority in U.S. by 2050, Reuters
- ^ An Older and More Diverse Nation by Midcentury, U.S. Census Press Releases, 14 August 2008 (archived from the original on 2008-08-22)
- ^ Kanell, Michael E. (16 November 2009). "Number of veterans, October". Atlanta, Georgia: Atlanta Constitution-Journal. pp. A6. http://www.ajc.com/business/vets-jobs-challenges-in-199084.html. quoting the Bureau of Labor Statistics
- ^ Hsu, Spencer S. (2 May 2010). "Senate Democrats' plan highlights nation's shift to the right on immigration". Washington, DC: Washington Post. pp. A3. http://www.washingtonpost.com/wp-dyn/content/article/2010/05/01/AR2010050100990.html.
- ^ Gerson, Michael (5 January 2010). "Column:More second chances". Melbourne, Florida: Florida Today. pp. 7A. http://jacksonville.com/opinion/blog/406107/carol-boone/2011-01-04/michael-gerson-power-second-chance.
- ^ "2000 Census information on Gay and Lesbian Couples". gaydemographics.org. http://www.gaydemographics.org/USA/USA.htm.
- ^ a b Gary J. Gates Same-sex Couples and the Gay, Lesbian, Bisexual Population: New Estimates from the American Community SurveyPDF (2.07 MB). The Williams Institute on Sexual Orientation Law and Public Policy, UCLA School of Law October, 2006. Retrieved April 20, 2007.
- ^ Press, Associated (March 1, 2011). "Research 4M adults in US identify as gay". Florida Today (Melbourne, Florida): pp. 1A. http://www.boston.com/news/nation/articles/2011/04/08/demographer_puts_gay_population_at_4m/?rss_id=Boston+Globe+--+Today%27s+paper+A+to+Z.
- ^ Davenport, Christian (20 April 2010). "A disconnect at Magruder". Washington, DC: Washington Post. pp. B1. http://www.washingtonpost.com/wp-dyn/content/article/2010/04/19/AR2010041903879.html?nav=emailpage.
- ^ Table No. 68. Religious Bodies—Selected Data (p. 59), "Statistical Abstract of the United States: 2004-2005 (tables 67-69)" (PDF). U.S. Census Bureau. http://www.census.gov/prod/2004pubs/04statab/pop.pdf.
- ^ "Statistical Abstract of the United States: 2004-2005 (tables 67-69)" (PDF). U.S. Census Bureau. http://www.census.gov/prod/2004pubs/04statab/pop.pdf.[clarification needed]
- ^ "Adherents.com". Adherents.com. http://www.adherents.com/Na/Na_139.html. Retrieved 2011-09-19.
- ^ "Section 1. Population". Statistical Abstract of the United States: 2004-2005. U.S. Census Bureau. p. 55. http://www.census.gov/prod/2004pubs/04statab/pop.pdf. Retrieved 2008-06-29. (Table No. 67. Self-described religious identification of adult population: 1990 and 2001; data for 2001).
- ^ a b Barry A. Kosmin and Ariela Keysar (2009). "AMERICAN RELIGIOUS IDENTIFICATION SURVEY (ARIS) 2008" (PDF). Hartford, Connecticut, USA: Trinity College. http://b27.cc.trincoll.edu/weblogs/AmericanReligionSurvey-ARIS/reports/ARIS_Report_2008.pdf. Retrieved 2009-04-01.
- ^ Riley, Naomi Schaefer (6 June 2010). "Love conquers all. Except religion". Washington, DC: Washington Post. pp. B1, B4. http://www.washingtonpost.com/wp-dyn/content/article/2010/06/04/AR2010060402011.html.
- ^ Larry Copeland (2011-03-22). "Caution: Wide Load (and Just Getting Wider)". Florida Today. http://www.floridatoday.com/apps/pbcs.dll/article?AID=2011103220305.
- ^ Caryn, Roni (2011-09-15). "Childhood - Hearing Loss Grows Among Teenagers". NYTimes.com. https://www.nytimes.com/2010/08/24/health/research/24child.html. Retrieved 2011-09-19.
- ^ Schuman, H. and Scott, J. (1989), Generations and collective memories, American Sociological Review, vol. 54, 1989, pp. 359-81.
- ^ [1]
- ^ [2]
- ^ [3]
- ^ Daddy's Gone to War: The Second ... - William M. Tuttle, Jr. - Google Books. Books.google.com. 1941-12-07. http://books.google.com/books?id=CjgLHG82ZXUC&pg=PA25&dq=%22daddy%27s+gone+to+war%22+Taeubers+Philip+Hauser+William&ei=Unt-R4evAYLusgOe06jFBA&sig=tclt1S4wCOF5gtXqb_AXEVSwA-M#PPA25,M1. Retrieved 2011-09-19.
- ^ "CIA - The World Factbook -- United States". CIA. https://www.cia.gov/library/publications/the-world-factbook/geos/us.html. Retrieved 2010-02-16.
- ^ Marchione, Marilynn (August 27, 2010). "Recession may have pushed U.S. birth rate to a new low". Associated Press. USA Today. http://www.usatoday.com/news/health/2010-08-27-birth-decline_N.htm. Retrieved 2010-10-09.
- ^ Births, Marriages, Divorces, and Deaths: Provisional Data for 2009 National Vital Statistics Report Volume 58, Number 25, accessed August 28, 2010
- ^ Amy Sullivan (March 20, 2009). "Behind the Boom in Adult Single Motherhood". Time. http://www.time.com/time/nation/article/0,8599,1886814,00.html.
- ^ Press, Associated (7 November 2010). "Blacks rank highest in unwed births". Melbourne, Florida: Florida Today. pp. 9A. http://www.theledger.com/article/20101107/APA/1011070508.
- ^ "Birthrate Is Lowest in a Century" Associated Press article printed in The New York Times August 27, 2010, accessed August 28, 2010
- ^ Starr, Tena (28 April 2010). "Mexican farmworker's life like living in a "golden cage"". Barton, Vermont: the Chronicle. p. 12.
- ^ "Table A-15. Alternative measures of labor underutilization". U.S. Bureau of Labor. http://www.bls.gov/news.release/empsit.t15.htm. Retrieved 2011-11-13.
- ^ "U6 Unemployment Rate". Portal Seven. http://portalseven.com/employment/unemployment_rate_u6.jsp. Retrieved 2011-09-19.
- ^ Employment Situation Summary, U.S. Bureau of Labor Statistice, August 5, 2011.
External links
- New York Times: "Mapping the 2010 U.S. Census"
- 2000 Census of Population and Housing United States, U.S. Census Bureau
- U.S. Demographics and State Rankings
- Asian-Nation: Demographics of Asian American /2006-07-04-us-population_x.htm?csp=34 Countdown to 300 million
- Census Ancestry Map
- USA Today 2004 Election County by County Map
- BeliefNet State by State Religious Affiliation (archived from the original on 2008-04-21)
- Health by State
- U.S. Demographics and Maps
- America's Changing Demographics a Nightly Business Report special
- The Realignment of America - The Wall Street Journal
- Religion U.S. Census Bureau
- Google - public data "Population in the U.S."
Demographics of the United States by state Demographics by state Alabama • Alaska • Arizona • Arkansas • California • Colorado • Connecticut • Delaware • Florida • Georgia • Hawaii • Idaho • Illinois • Indiana • Iowa • Kansas • Kentucky • Louisiana • Maine • Maryland • Massachusetts • Michigan • Minnesota • Mississippi • Missouri • Montana • Nebraska • Nevada • New Hampshire • New Jersey • New Mexico • New York • North Carolina • North Dakota • Ohio • Oklahoma • Oregon • Pennsylvania • Rhode Island • South Carolina • South Dakota • Tennessee • Texas • Utah • Vermont • Virginia • Washington • West Virginia • Wisconsin • WyomingFederal district Demographics by city United States (Outline) History Pre-Columbian era · Colonial era (Thirteen Colonies · Colonial American military history) · American Revolution (War) · Federalist Era · War of 1812 · Territorial acquisitions · Territorial evolution · Mexican–American War · Civil War · Reconstruction era · Indian Wars · Gilded Age · African-American Civil Rights Movement (1896–1954) · Spanish–American War · Imperialism · World War I · Roaring Twenties · Great Depression · World War II (Home front) · Cold War · Korean War · Space Race · African-American Civil Rights Movement (1955–1968) · Feminist Movement · Vietnam War · Post-Cold War (1991–present) · War on Terror (War in Afghanistan · Iraq War) · Timeline of modern American conservatismTopicsDemographic · Discoveries · Economic (Debt Ceiling) · Inventions (before 1890 · 1890–1945 · 1946–1991 · after 1991) · Military · Postal · Technological and industrialFederal
governmentLegislature - Congress
Senate
· Vice President
· President pro tem
House of Representatives
· Speaker
Judiciary - Supreme Court
Federal courts
Courts of appeal
District courtsExecutive - President
Executive Office
Cabinet / Executive departments
Civil service
Independent agencies
Law enforcement
Public policy
Intelligence
Central Intelligence Agency
Defense Intelligence Agency
National Security Agency
Federal Bureau of InvestigationPolitics Divisions · Elections (Electoral College) · Foreign policy · Foreign relations · Ideologies · Local governments · Parties (Democratic Party · Republican Party · Third parties) · Political status of Puerto Rico · Red states and blue states · Scandals · State governments · Uncle SamGeography Cities, towns, and villages · Counties · Extreme points · Islands · Mountains (Peaks · Appalachian · Rocky) · National Park System · Regions (Great Plains · Mid-Atlantic · Midwestern · New England · Northwestern · Southern · Southwestern · Pacific · Western) · Rivers (Colorado · Columbia · Mississippi · Missouri · Ohio · Rio Grande) · States · Territory · Water supply and sanitationEconomy Agriculture · Banking · Communications · Companies · Dollar · Energy · Federal Budget · Federal Reserve System · Financial position · Insurance · Mining · Public debt · Taxation · Tourism · Trade · Transportation · Wall StreetSociety TopicsCrime · Demographics · Education · Family structure · Health care · Health insurance · Incarceration · Languages (American English · Spanish · French) · Media · People · Public holidays · Religion · SportsArchitecture · Art · Cinema · Cuisine · Dance · Fashion · Flag · Folklore · Literature · Music · Philosophy · Radio · Television · TheaterIssues Book ·
  Category ·
  Portal ·
  WikiProject
Demographics of North America Sovereign states Antigua and Barbuda · Bahamas · Barbados · Belize · Canada · Costa Rica · Cuba · Dominica · Dominican Republic · El Salvador · Grenada · Guatemala · Haiti · Honduras · Jamaica · Mexico · Nicaragua · Panama · Saint Kitts and Nevis · Saint Lucia · Saint Vincent and the Grenadines · Trinidad and Tobago · United States
Dependencies and
other territoriesAnguilla · Aruba · Bermuda · Bonaire · British Virgin Islands · Cayman Islands · Curaçao · Greenland · Guadeloupe · Martinique · Montserrat · Puerto Rico · Saint Barthélemy · Saint Martin · Saint Pierre and Miquelon · Saba · Sint Eustatius · Sint Maarten · Turks and Caicos Islands · United States Virgin Islands
Categories:


Wikimedia Foundation. 2010.