- Dow Jones Industrial Average
-
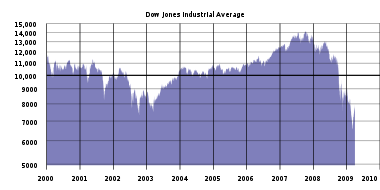 Recent logarithmic graph of the DJIA from Jan 2000 through Jul 2011.
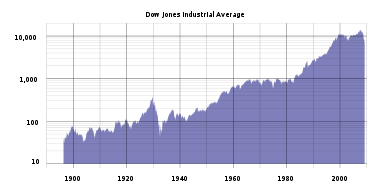 Historical logarithmic graph of the DJIA from the 1890s to the late 2000s.
The Dow Jones Industrial Average (
 /ˌdaʊ ˈdʒoʊnz/), also called the Industrial Average, the Dow Jones, the Dow 30, or simply the Dow, is a stock market index, and one of several indices created by Wall Street Journal editor and Dow Jones & Company co-founder Charles Dow. It was founded on May 26, 1896, and is now owned by Dow Jones Indexes, which is majority owned by the CME Group. The average is named after Dow and one of his business associates, statistician Edward Jones. It is an index that shows how 30 large, publicly owned companies based in the United States have traded during a standard trading session in the stock market.[1] It is the second oldest U.S. market index after the Dow Jones Transportation Average, which was also created by Dow.
The Industrial portion of the name is largely historical, as many of the modern 30 components have little or nothing to do with traditional heavy industry. The average is price-weighted, and to compensate for the effects of stock splits and other adjustments, it is currently a scaled average. The value of the Dow is not the actual average of the prices of its component stocks, but rather the sum of the component prices divided by a divisor, which changes whenever one of the component stocks has a stock split or stock dividend, so as to generate a consistent value for the index.
Along with the NASDAQ Composite, the S&P 500 Index, and the Russell 2000 Index, the Dow is among the most closely watched U.S. benchmark indices tracking targeted stock market activity. Although Dow compiled the index to gauge the performance of the industrial sector within the American economy, the index's performance continues to be influenced by not only corporate and economic reports, but also by domestic and foreign political events such as war and terrorism, as well as by natural disasters that could potentially lead to economic harm. Components of the Dow trade on both the NASDAQ OMX and the NYSE Euronext, two of the largest stock market companies. Derivatives of the Dow trade on the Chicago Board Options Exchange and through the CME Group, the world's largest futures exchange company, which owns 90% of the indexing business founded by Dow Jones, including the Industrial Average.[2][3]
Contents
Components
The Dow Jones Industrial Average currently consists of the following 30 major American companies:[4]
Company Symbol Industry Date Added 3M MMM Conglomerate 1976-08-09 (as Minnesota Mining and Manufacturing) Alcoa AA Aluminum 1959-06-01 (as Aluminum Company of America) American Express AXP Consumer finance 1982-08-30 AT&T T Telecommunication 1999-11-01 (as SBC Communications) Bank of America BAC Banking 2008-02-19 Boeing BA Aerospace and defense 1987-03-12 Caterpillar CAT Construction and mining equipment 1991-05-06 Chevron Corporation CVX Oil & gas 2008-02-19 Cisco Systems CSCO Computer networking 2009-06-08 Coca-Cola KO Beverages 1987-03-12 DuPont DD Chemical industry 1935-11-20 (also 1924-01-22 to 1925-08-31) ExxonMobil XOM Oil & gas 1928-10-01 (as Standard Oil) General Electric GE Conglomerate 1907-11-07 Hewlett-Packard HPQ Technology 1997-03-17 The Home Depot HD Home improvement retailer 1999-11-01 Intel INTC Semiconductors 1999-11-01 IBM IBM Computers and technology 1979-06-29 Johnson & Johnson JNJ Pharmaceuticals 1997-03-17 JPMorgan Chase JPM Banking 1991-05-06 (as J.P. Morgan & Company) Kraft Foods KFT Food processing 2008-09-22 McDonald's MCD Fast food 1985-10-30 Merck MRK Pharmaceuticals 1979-06-29 Microsoft MSFT Software 1999-11-01 Pfizer PFE Pharmaceuticals 2004-04-08 Procter & Gamble PG Consumer goods 1932-05-26 Travelers TRV Insurance 2009-06-08 United Technologies Corporation UTX Conglomerate 1939-03-14 (as United Aircraft) Verizon Communications VZ Telecommunication 2004-04-08 Wal-Mart WMT Retail 1997-03-17 Walt Disney DIS Broadcasting and entertainment 1991-05-06 Former components
The components of the DJIA have changed 48 times in its 115 year history, and none of the original twelve companies remain in the index. As of 2011, General Electric has had the longest continuous presence on the index, being added in 1907. When companies are replaced, the scale factor used to calculate the index is adjusted so that the value of the average remains the same. A summary of the more recent changes to the index include the following:
On February 19, 2008, Chevron and Bank of America replaced Altria Group and Honeywell. Chevron had previously been a Dow component from July 18, 1930, to November 1, 1999. During Chevron's absence, its split-adjusted price per share had gone from forty-four dollars to eighty-five, while the price of petroleum had risen from twenty-four dollars to a hundred. On September 22, 2008, Kraft Foods replaced the American International Group (AIG) in the index.[5] On June 8, 2009, General Motors and Citigroup were replaced by The Travelers Companies and Cisco Systems, which became the third company traded on the NASDAQ to be part of the Dow.[6]
History
Early years
The Dow Jones Industrial Average was founded by Charles Dow on May 26, 1896, and represented the dollar average of 12 stocks from leading American industries. Previously in 1884, Dow had composed an initial stock average called the Dow Jones Averages, which contained nine railroads and two industrial companies that appeared in the Customer's Afternoon Letter, a daily two-page financial news bulletin which was the precursor to The Wall Street Journal. The original group of 12 stocks ultimately chosen to form the Dow Jones Industrial Average did not contain any railroad stocks, but purely industrial stocks. Of these, only General Electric currently remains part of that index.[7] The other 11 were:[8]
- American Cotton Oil Company, a predecessor company to Bestfoods, now part of Unilever.
- American Sugar Company, became Domino Sugar in 1900, now Domino Foods, Inc.
- American Tobacco Company, broken up in a 1911 antitrust action.
- Chicago Gas Company, bought by Peoples Gas Light in 1897, now an operating subsidiary of Integrys Energy Group.
- Distilling & Cattle Feeding Company, now Millennium Chemicals, formerly a division of LyondellBasell, the latter of which is now in Chapter 11 bankruptcy.
- Laclede Gas Company, still in operation as the Laclede Group, Inc., removed from the Dow Jones Industrial Average in 1899.
- National Lead Company, now NL Industries, removed from the Dow Jones Industrial Average in 1916.
- North American Company, an electric utility holding company, broken up by the U.S. Securities and Exchange Commission (SEC) in 1946.
- Tennessee Coal, Iron and Railroad Company in Birmingham, Alabama, bought by U.S. Steel in 1907; U.S. Steel was removed from the Dow Jones Industrial Average in 1991.
- U.S. Leather Company, dissolved in 1952.
- United States Rubber Company, changed its name to Uniroyal in 1961, merged with private B.F. Goodrich in 1986, bought by Michelin in 1990.
When it was first published in the late 1890s, the index stood at a level of 40.94, but ended up hitting its all-time low of 28.48 during the summer of 1896 during the depths of what later became known as the Panic of 1896. Many of the biggest percentage price moves in the Dow occurred early in its history, as the nascent industrial economy matured. A brief war in 1898 between the U.S. and the Spanish Empire might have only had a minor impact in the Dow's direction.[citation needed]
The decade of the 1900s would see the Dow halt its momentum as it worked its way through a pair of cataclysmic financial crises; the Panic of 1901 and the Panic of 1907. The Dow would be stuck in a trading range of between the 50 and 100 point levels till late 1909. The negativity surrounding the 1906 San Francisco earthquake did little to improve the economic climate. International disturbances such as the Russo-Japanese War were few and far between and seemed to have little if any influence on the Dow. The average would end off the decade near the vicinity of the 100 point level.[citation needed]
At the start of the 1910s, the decade would begin with the Panic of 1910–1911 stifling economic growth for a lengthy period of time. History would later take its course on July 30, 1914; as the average stood at a level of 71.42 when a decision was made to close down the New York Stock Exchange, and suspend trading for a span of 4½ months. Some historians believe the exchange closed because of a concern that markets would plunge as a result of panic over the onset of World War I. An alternative explanation is that the Secretary of the Treasury, William Gibbs McAdoo, closed the exchange because he wanted to conserve the U.S. gold stock in order to launch the Federal Reserve System later that year, with enough gold to keep the U.S. at par with the gold standard. When the markets reopened on December 12, 1914, the index closed at 54, a drop of 24.39%.[9] Also, in trying to explain the huge percentage drop, there was a new recalculation performed on the index in September 1916. Additions to the index raised the number of companies to 20, resulting in a mathematical inconsistency to the average from previous years in the past including 1914.[10] Following World War I, the U.S. would experience another downturn in economic activity in what became known as the Post-World War I recession. The Dow's performance would remain virtually unchanged from the closing value of the previous decade, adding only around 5%, from about the 100 level to 105.[citation needed]
During the 1920s, specifically in 1928, the components of the Dow were increased to 30 stocks near the economic height of that decade, which was nicknamed the Roaring Twenties. The prosperous nature of the economic climate, muted the negative influence of an early 1920s recession plus certain international conflicts such as the Polish-Soviet war, the Irish Civil War, the Turkish War of Independence and the initial phase of the Chinese Civil War. The Crash of 1929 and the ensuing Great Depression returned the average to its starting point, almost 90% below its peak. By July 8, 1932, following its intra-day low of 40.56, the Dow would end up closing the session at 41.22. The high of 381.17 on September 3, 1929, would not be surpassed until 1954, in inflation-adjusted numbers. However, the bottom of the 1929 Crash came just 2½ months later on November 13, 1929, when intra-day it was at the 195.35 level, closing slightly higher at 198.69.[11] For the decade, the Dow would end off with a healthy 173% gain from around the 105 level to a level of 286.
Marked by global instability, the 1930s contended with several consequential European and Asian outbreaks of war, leading up to catastrophic World War II; including the Spanish Civil War, the Second Italo-Abyssinian War, the Soviet-Japanese Border War and the Second Sino-Japanese War. On top of that, the U.S. dealt with a painful recession in 1937 and 1938. The largest one-day percentage gain in the index, 15.34%, happened on March 15, 1933, in the depths of the 1930s bear market. However, as a whole, the Dow posted some of its worst performances, for a negative return. For the decade, the average was down from around the 286 level to 148, a loss of about 48%.
Post-war years
Post-war reconstruction during the 1940s, along with renewed optimism of peace and prosperity, brought about a 39% surge in the Dow from around the 148 level to 206. The strength in the Dow occurred despite a brief recession in 1949 and other global conflicts which started a short time later including the latter stages of the Chinese Civil War, the Greek Civil War, the Indo-Pakistani War of 1947 and the 1948 Arab-Israeli War.
During the 1950s, the Korean War, the Algerian War, the Cold War and other political tensions such as the Cuban Revolution, as well as widespread political and economic changes in Africa during the initial stages of European Decolonization, did not stop the Dow's bullish climb higher. Additionally, the U.S. would also make its way through two grinding recessions; one in 1953 and another in 1958. A 200% increase in the average from a level of 206 to 616 ensued over the course of that decade.
The Dow's bullish behavior began to stall during the 1960s as the U.S. became entangled with foreign political issues. They included the Bay of Pigs Invasion involving Cuba, the Vietnam War, the Portuguese Colonial War, the Colombian Civil War which the U.S. assisted with short-lived counter-guerrilla campaigns, as well as domestic issues such as the Civil Rights Movement and several influential political assassinations. For the decade though, and despite a mild recession between 1960 and 1961, the average still managed a respectable 30% gain from the 616 level to 800.
The 1970s marked a time of economic uncertainty and troubled relations between the U.S. and certain Middle-Eastern countries. To begin with, the decade started off with the ongoing Recession of 1969–70. Following that, the 1970s Energy Crisis ensued which included the 1973–75 recession, the 1973 Oil Crisis as well as the 1979 energy crisis beginning as a prelude to a disastrous economic climate injected with stagflation; the combination between high unemployment and high inflation. However, on November 14, 1972, the average closed above the 1,000 mark (1,003.16) for the first time, during a brief relief rally in the midst of a lengthy bear market. Between January 1973 and December 1974, the average lost 48% of its value in what became known as the 1973–1974 Stock Market Crash; with the situation being exacerbated by the events surrounding the Yom Kippur War. Although the Vietnam War ended in 1975, new tensions arose towards Iran surrounding the Iranian Revolution in 1979. Other notable disturbances such as the Lebanese Civil War, the Ethiopian Civil War, the Indo-Pakistani War of 1971 and the Angolan Civil War which the U.S. and Soviet Union considered critical to the global balance of power, seemed to have had little influence towards the financial markets. Performance-wise for the decade, gains remained virtually flat, rising less than 5% from about the 800 level to 838.
 The Dow fell 22.61% on Black Monday (1987) from about the 2,500 level to around 1,750. Two days later, it rose 10.15% above the 2,000 level for a mild recovery attempt.
The 1980s saw a rapid increase in the average, though severe corrections did occur along the way. The largest one-day percentage drop occurred on Black Monday; October 19, 1987, when the average fell 22.61%. There were no clear reasons given to explain the crash, but program trading may have been a major contributing factor. On October 13, 1989, the Dow stumbled into another downfall, the 1989 Mini-Crash which initiated the collapse of the junk bond market as the Dow registered a loss of almost 7%. However, for the rest of the 1980s as a whole, the Dow made a 228% increase from the 838 level to 2,753; despite the market crashes, Silver Thursday, an Early 1980s recession, the 1980s oil glut, the Japanese asset price bubble and other political distractions such as the Soviet War in Afghanistan, the Falklands War, the Iran-Iraq War, the Second Sudanese Civil War and the First Intifada in the Middle East.
Dot-com boom
The 1990s brought on rapid advances in technology along with the introduction of the dot-com era. To start off, the markets contended with the 1990 oil price shock compounded with the effects of the Early 1990s recession and a brief European situation surrounding Black Wednesday. Certain influential foreign conflicts such as the 1991 Soviet coup d'état attempt which took place as part of the initial stages of the Dissolution of the USSR and the Fall of Communism; the First and Second Chechen Wars, the Persian Gulf War and the Yugoslav Wars failed to dampen economic enthusiasm surrounding the ongoing Information Age and the "Irrational Exuberance" (a phrase coined by Alan Greenspan) of the Internet Boom. Even the occurrences of the Rwandan Genocide and the Second Congo War, termed as "Africa's World War" that involved 8 separate African nations which together between the two killed over 5 million people; didn't seem to have any noticeable negative financial impact on the Dow either. Between late 1992 and early 1993, the Dow staggered through the 3,000 level making only modest gains as the Biotechnology sector suffered through the downfall of the Biotech Bubble; as many biotech companies saw their share prices rapidly rise to record levels and then subsequently fall to new all-time lows.
 A linear chart which approximates the shape of the rise in the DJIA during the 1990s acceleration. From a trading low of under 4,000 in 1990 to above the 12,000 mark in the year 2000 with intermittent slides throughout the decade.
On November 21, 1995, the DJIA closed above the 5,000 level (5,023.55) for the first time. Over the following two years, the Dow would rapidly tower above the 6,000 level during the month of October in 1996, and the 7,000 level in February 1997. On its march higher into record territory, the Dow easily made its way through the 8,000 level in July 1997. However, later in that year during October, the events surrounding the Asian Financial Crisis plunged the Dow into a 554 point loss to a close of 7,161.15; a retrenchment of 7.18% in what became known as the 1997 Mini-Crash. Although internationally there was negativity surrounding the 1998 Russian financial crisis, the Dow would go on to surpass the 9,000 level during the month of April in 1998, making its sentimental push towards the symbolic 10,000 level. On March 29, 1999, the average closed above the 10,000 mark (10,006.78) after flirting with it for two weeks. This prompted a celebration on the trading floor, complete with party hats. The scene at the exchange made front page headlines on many U.S. newspapers such as The New York Times. On May 3, 1999, the Dow achieved its first close above the 11,000 mark (11,014.70). Total gains for the decade exceeded 315%; from the 2,753 level to 11,497.
The Dow averaged a 5.3% return compounded annually for the 20th century, a record Warren Buffett called "a wonderful century"; when he calculated that to achieve that return again, the index would need to close at about 2,000,000 by December 2099.[12] Even during the height of the dot-com era, authors James K. Glassman and Kevin A. Hassett went so far as to publish a book entitled Dow 36,000: The New Strategy for Profiting From the Coming Rise in the Stock Market. Their theory was to imply that stocks were still cheap and it was not too late to benefit from rising prices during the Internet boom.
Characterized by fear on the part of newer investors, the uncertainty of the 2000s brought on a significant bear market. There was indecision on whether the cyclical bull market represented a prolonged temporary bounce or a new long-term trend. Ultimately, there was widespread resignation and disappointment as the lows were revisited, and in some cases, surpassed near the end of the decade.
September 11 attacks
The third largest one-day point drop in DJIA history, and largest at the time, occurred on September 17, 2001, the first day of trading after the September 11, 2001 attacks, when the Dow fell 684.81 points, or 7.1%. It should be noted that the Dow had been in a downward trend for virtually all of 2001 prior to Sept 11, losing well over 1000 points between Jan 2 and Sept. 10, and had lost 187.51 points on Sept. 6, followed by losing 235.4 points on Sept. 7.[13] By the end of that week, the Dow had fallen 1,369.70 points, or 14.3%. However, the Dow began an upward trend shortly after the attacks and quickly regained all lost ground to close above the 10,000 level for the year.
 The Dow fell 14.3% from the mid-9,000 level to the low 8,000 level after the September 11, 2001 attacks. Exchanges were closed between September 10 and September 17.
During 2002, the average remained subdued without making substantial gains due to the Stock market downturn of 2002 as well as the lingering effects of the Dot-com bubble. In 2003, the Dow held steady within the 7,000 to 9,000 point level range by the Early 2000s Recession, the Afghan War and the Iraq War. But by December of that year, the Dow remarkably returned to the 10,000 mark. In October 2006, four years after its bear market low, the DJIA set fresh record theoretical, intra-day, daily close, weekly, and monthly highs for the first time in almost seven years, closing above the 12,000 level for the first time on the 19th anniversary of Black Monday (1987). On February 27, 2007, the Dow Jones Industrial Average fell 3.3% (415.30 points), its biggest point drop since 2001. The initial drop was caused by a global sell-off after Chinese stocks experienced a Mini-Crash, yet by April 25, the Dow passed the 13,000 level in trading and closed above that milestone for the first time. On July 19, 2007, the average passed the 14,000 level, completing the fastest 1,000-point advance for the index since 1999. One week later, a 450 point intra-day loss, owing to turbulence in the U.S. sub-prime mortgage market and the soaring value of the yuan,[14][15] initiated another correction falling below the 13,000 mark, about 10% from its highs.
On October 9, 2007, the Dow Jones Industrial Average closed at the record level of 14,164.53. Two days later on October 11, the Dow would trade at its highest intra-day level ever, at the 14,198.10 mark.[16] In what would normally take many years to accomplish; numerous reasons were cited for the Dow's extremely rapid rise from the 11,000 level in early 2006, to the 14,000 level in late 2007. They included future possible takeovers and mergers, healthy earnings reports particularly in the tech sector, and moderate inflationary numbers; fueling speculation the Federal Reserve would not raise interest rates. Roughly on par with the 2000 record when adjusted for inflation, this represented the final high of the cyclical bull.
Late-2000s recession
On September 15, 2008, a wider financial crisis became evident when Lehman Brothers filed for Chapter 11 bankruptcy along with the economic effect of record high oil prices which reached almost $150 per barrel two months earlier. The DJIA lost more than 500 points for only the sixth time in history, returning to its mid-July lows below the 11,000 level. A series of "bailout" packages, including the Emergency Economic Stabilization Act of 2008, proposed and implemented by the Federal Reserve and U.S. Treasury, as well as FDIC-sponsored bank mergers, did not prevent further losses. After two months of extreme volatility during which the Dow experienced its largest one day point loss, largest daily point gain, and largest intra-day range (more than 1,000 points), the index closed at a new twelve-year low of 6,547.05 on March 9, 2009 (after an intra-day low of 6,469.95[17] during the March 6 session), its lowest close since April 1997, and had lost 20% of its value in only six weeks. Towards the latter half of 2009, the average rallied towards the 10,000 level amid optimism that the Late-2000s Recession, the United States Housing Bubble and the Global Financial Crisis of 2008–2009, were easing and possibly coming to an end. For the decade, the Dow saw a rather substantial pullback for a negative return from the 11,497 level to 10,428, a loss of a little over 9%.
During the early part of the 2010s, the Dow made a fairly notable rally attempt in the face of growing global concerns such as the 2010 European sovereign debt crisis and the Dubai debt crisis. Although for the most part just a political event, the Dow closed at the 10,785.89 level on March 22, 2010 following the passage of the landmark Patient Protection and Affordable Care Act in Washington. On May 6, 2010, just after 2:30 pm EDT, the Dow Jones Industrial Average plunged by 998.50 points, an intra-day loss of 9.2%. The event later became known as the 2010 Flash Crash or the "Flash Crash".[18] Although there was an immediate recovery, it was the biggest intra-day fall ever. This would have put the trading day as the fifth-worst market sell-off on a percentage basis as well. The Dow bottomed out at 9,869, and then recovered quickly, eventually ending at 10,520.32, a loss of 347.80 points or 3.2%.[18] On February 1, 2011, the Dow settled at the 12,040.16 level, reaching past the 12,000 mark for the first time in over two and a half years.[19] Following negative reaction to news surrounding the United States debt ceiling crisis, the Dow closed in correction territory at the 11,383.68 level, after a 512.76 point drop on August 4, 2011. Later on August 8, following the U.S. Sovereign debt downgrade from Standard & Poor's to AA+ from AAA, the Dow plummeted 634.76 points, closing at 10,809.85, its first close under 11,000 since November 2010.[20]
Investing
Investing in the DJIA is made widely accessible in equities through exchange-traded funds (ETFs) as well as in derivatives through option contracts and futures contracts.
Equities
Within equities, asset manager SSgA, issue a family of ETFs the SPDRs; one of which attempts to match the daily performance of the index, the DIAMONDS, introduced in 1998 (NYSE: DIA). Another asset management firm, ProFunds, issue other related DJIA ETFs through ProShares such as the Inverse Performance (NYSE: DOG) for a bearish strategy on the average. That is, when the Dow trades in negative territory, the ETF trades higher; thus, making it not needed to sell short if one has a bearish goal in mind.
Due to the advent of pre-market trading, the DIAMONDS ETF provides a very accurate opening value for the average. As an example, if the ETF opens the trading session with a 76¢ loss; then that would strongly indicate roughly a 76-point loss for the Dow within the first few seconds or so, even before all of its components open for trade. Likewise, if the ETF starts the trading session higher by $1.12, then that would signal an approximate gain for the Dow of 112 points at the open, even if some components begin trading at 9:31 am or 9:33 am due to a delay.
Leveraged equities
Profunds also issues the 2x (NYSE: DDM), which attempts to match the daily performance of the DJIA by 200% and the Inverse 2x (NYSE: DXD), which attempts to match the inverse daily performance by 200%. In the case of 2x performance, the ETF increases the buying power by leveraging money without using margin. Currently, there are also 3x performance ETFs issued by ProShares that exist too; which attempt to replicate (300% leverage) against the Dow. For 3x performance, the symbol is (NYSE: UDOW), and for Inverse 3x performance, it is (NYSE: SDOW).[21][22]
Futures contracts
In the derivatives market, the CME Group through its subsidiaries the Chicago Mercantile Exchange (CME) and the Chicago Board of Trade (CBOT), issues Futures Contracts; including the E-mini Dow ($5) Futures (YM), the DJIA ($10) Futures (DJ) and the Big Dow DJIA ($25) Futures (DD) which track the average and trade on their exchange floors respectively. Trading is typically carried out in an Open Outcry auction, or over an electronic network such as CME's Globex platform.
Options contracts
The Chicago Board Options Exchange (CBOE) issues Options Contracts on the Dow through the root symbol DJX in combination with long term expiration options called DJX LEAPS. Concerning equities, the exchange issues options contracts on Performance ETFs, Inverse Performance ETFs, 2x Performance ETFs, Inverse 2x Performance ETFs, 3x Performance ETFs, and Inverse 3x Performance ETFs.
Calculation
To calculate the DJIA, the sum of the prices of all 30 stocks is divided by a divisor, the Dow Divisor. The divisor is adjusted in case of stock splits, spinoffs or similar structural changes, to ensure that such events do not in themselves alter the numerical value of the DJIA. Early on, the initial divisor was composed of the original number of component companies; which made the DJIA at first, a simple arithmetic average. The present divisor, after many adjustments, is less than one (meaning the index is larger than the sum of the prices of the components). That is:
where p are the prices of the component stocks and d is the Dow Divisor.
Events like stock splits or changes in the list of the companies composing the index alter the sum of the component prices. In these cases, in order to avoid discontinuity in the index, the Dow Divisor is updated so that the quotations right before and after the event coincide:
The Dow Divisor is currently 0.132129493.[23] Presently, every $1 change in price in a particular stock within the average, equates to a 7.57 (1/0.132129493) point movement.
Assessment
With the current inclusion of only 30 stocks, critics like Ric Edelman argue that the DJIA is not a very accurate representation of overall market performance. Still, it is the most cited and most widely recognized of the stock market indices.[24][25] Additionally, the DJIA is criticized for being a price-weighted average, which gives higher-priced stocks more influence over the average than their lower-priced counterparts, but takes no account of the relative industry size or market capitalization of the components. For example, a $1 increase in a lower-priced stock can be negated by a $1 decrease in a much higher-priced stock, even though the lower-priced stock experienced a larger percentage change. In addition, a $1 move in the smallest component of the DJIA has the same effect as a $1 move in the largest component of the average. The Dow would see the negative effects of this price weighted average during September–October 2008 with a former component AIG. Before its reverse-split adjusted stock price change, the stock collapsed from $22.76 on September 8 to $1.35 on October 27; contributing to a roughly 3,000 point drop in the index.[26]
As of September 2011, IBM and Chevron are among the highest priced stocks in the average and therefore have the greatest influence on it. Alternately, Bank of America and Alcoa are among the lowest priced stocks in the average and have the least amount of sway in the price movement. Many critics of the DJIA recommend the float-adjusted market-value weighted S&P 500 or the Wilshire 5000, the latter of which includes all U.S. equity securities, as better indicators of the U.S. stock market.
See also
- Dow Jones Indexes
- List of largest daily changes in the Dow Jones Industrial Average
- Closing milestones of the Dow Jones Industrial Average
- List of stock market crashes
References
- ^ Sullivan, Arthur; Steven M. Sheffrin (2003). Economics: Principles in action. Upper Saddle River, New Jersey 07458: Pearson Prentice Hall. pp. 290. ISBN 0-13-063085-3. http://www.pearsonschool.com/index.cfm?locator=PSZ3R9&PMDbSiteId=2781&PMDbSolutionId=6724&PMDbCategoryId=&PMDbProgramId=12881&level=4.
- ^ Berman, Dennis K. and McCracken, Jeffrey (February 11, 2010). "CME Buys 90% of Dow Jones Indexes". The Wall Street Journal. Retrieved February 11, 2010.
- ^ TheStreet Staff (February 11, 2010). "CME Buys 90% of Dow Jones Indexes". TheStreet.com. Retrieved February 11, 2010.
- ^ Dow Jones Indexes Symbols and Components. Dow Jones Indexes. Retrieved March 14, 2010.
- ^ "Dow Jones to change the composition of the Dow Jones Industrial Average" (Press release). Dow Jones. 2008-02-11. http://www.djindexes.com/mdsidx/html/pressrelease/press-release-archive.html#20080211. Retrieved 2008-02-11.
- ^ Browning, E.S. (2009-06-01). "Travelers, Cisco Replace Citi, GM in Dow". Wall Street Journal (Dow Jones & Company). http://online.wsj.com/article/SB124386244318072033.html. Retrieved 2009-06-02.
- ^ Dow Jones Indexes Website. Dow Jones Indexes. Retrieved March 14, 2010.
- ^ What happened to the original 12 companies in the DJIA?. Dow Jones Indexes. Retrieved March 14, 2010.
- ^ Dow Jones Indexes Events and Statistics. Dow Jones Indexes. Retrieved March 14, 2010.
- ^ Setting the Record Straight on the Dow Drop. The New York Times. Retrieved March 22, 2010.
- ^ Anderson, Benjamin (1949). Economics and the Public Welfare: A Financial and Economic History of the United States, 1914–1946. LibertyPress (2nd ed., 1979). p. 219. ISBN 091396669X.
- ^ Buffett, Warren (February 2008). "Letter to Shareholders" (PDF). Berkshire Hathaway. http://www.berkshirehathaway.com/letters/2007ltr.pdf. Retrieved 2008-03-04.
- ^ Dow Jones Industrial Average Historical Prices. Yahoo Finance. Retrieved March 14, 2010.
- ^ McHugh, Robert D. (July 1, 2007). July 26, 2007…Black Thursday?. Gold Eagle Financial News. Retrieved February 14, 2010.
- ^ Murchie, Kay (August 17, 2007). Black Thursday on Stock Market. FinanceMarkets.co.uk. Retrieved February 14, 2010.
- ^ Dow Jones Industrial Average Historical Prices. Google Finance. Retrieved March 14, 2010.
- ^ Dow Jones Industrial Average Historical Prices. Google Finance. Retrieved March 14, 2010.
- ^ a b Paradis, Tim (May 6, 2010). Wall St. rollercoaster: Stocks fall nearly 10 pct. Associated Press. Retrieved May 7, 2010.
- ^ Dow over 12,000 as remarkable bull market rolls on. Yahoo Finance. Retrieved February 2, 2011.
- ^ "Dow posts 6th-biggest point loss". The Jakarta Post. 2011-08-09. http://www.thejakartapost.com/news/2011/08/09/dow-posts-6th-biggest-point-loss.html. Retrieved 2011-08-09.
- ^ IndexUniverse Staff (February 8, 2010). "ProShares Plans More 300% Geared ETFs". IndexUniverse.com. Retrieved February 10, 2010.
- ^ S.E.C. (February 5, 2010). "ProShares Registration Statement". S.E.C.. Retrieved February 10, 2010.
- ^ Dow Jones Industrial Average Historical Divisor Changes. CME Group. Retrieved March 2, 2011.
- ^ Edelman, Ric (December 23, 2003). The Truth About Money 3rd Edition. Harper Paperbacks. p. 126. ISBN 978-0060566586.
- ^ How Dow Jones Wrecked The Dow Jones Industrial Average. Business Insider. Retrieved March 14, 2010.
- ^ La Monica, Paul (September 15, 2008). Toss AIG from the Dow!. CNN. Retrieved September 21, 2010.
External links
- Official website
- Dow Jones Industrial Average at NASDAQ
- Dow Jones Industrial Average at NYSE Euronext
- Dow Jones Industrial Average at the Chicago Board Options Exchange
- Dow Jones Industrial Average Component Quotes at Yahoo! Finance
Major United States stock market indexes Dow Jones Industrial Average (30 large stocks; popular indicator) · NYSE Composite Index (all companies on the NYSE) · Nasdaq Composite Index (all companies on the NASDAQ; technology-heavy) · NASDAQ-100 Index (100 large NASDAQ non-financial stocks) · S&P 500 Index (500 large companies; general market analysis) · Russell 2000 Index (small-cap stocks) · Wilshire 5000 Index (total U.S. market)News Corporation Percentages indicate percentage ownership Corporate directors:
Rupert Murdoch · José María Aznar · Natalie Bancroft · Chase Carey · David DeVoe · Arthur Siskind · Rod Eddington · Andrew Knight · James Murdoch · Lachlan Murdoch · Rod Paige · Thomas Perkins · Viet Dinh · John L. ThorntonDow Jones & Company National consumer products All Things Digital · Barron's · Financial News · FINS.com · MarketWatch.com (BigCharts · VSE) · SmartMoney · Vedomosti · The Wall Street Journal · The Wall Street Journal Asia · The Wall Street Journal Europe · Wall Street Journal Radio Network · WSJ.Dow Jones Local Media Group Enterprise products Fox Filmed Entertainment 20th Century Fox · 20th Century Fox Animation · 20th Century Fox Home Entertainment · 20th Century Fox Television · 20th Television · Fox 21 · Fox Star Studios · Blue Sky Studios · Fox Faith · Fox Searchlight Pictures · Fox Studios Australia · Fox Television Studios · Fox Music · Shine Group (Dragonfly · Friday TV · Kudos · Metronome · Princess Productions · Reveille Productions · Shine Limited)Fox Broadcasting Company Fox Television Stations Fox Cable Networks FX · Fox Movie Channel · Fox Sports Net1 · Fox Soccer · Fox Soccer Plus · Speed Channel · FUEL TV · Fox College SportsFox News Network Fox International Channels Fox (Asia · Germany · Italy · Latin America · Poland · Portugal · Spain · Turkey) · Fox Life (Greece · Italy) · FX (Asia · Australia · Greece · Latin America · UK) · Fox Crime (Asia · Italy) · Fox Retro · Fox Sports · BabyTV · Utilisima · Speed · tvN6 · Fox Family Movies · Fox History & Traveller · Cult · Voyage · National Geographic International Channels (52%)4 (National Geographic Channel (Asia · Germany · Greece · Scandinavia5 · UK5) · Nat Geo WILD4 · Nat Geo Mundo4 · National Geographic Adventure · Nat Geo Music · Premier Media Group (50%)Fox Sports International Fox Pan American Sports (33%)7 (Fox Deportes · Fox Sports Latinoamérica)News Corp. Digital Media FoxSports.com (Scout.com · WhatIfSports · Yardbarker) IGN Entertainment (AskMen.com · GameScoop · GameSpy · GameStats · IGN · Planet Network · TeamXbox · UGO Networks (1UP.com · GameTab) · Vault Network)Investments Big Ten Network (51%)8 · Fox Telecolombia (51%) LAP TV (55%) · National Geographic Channel (70%) (National Geographic Wild)4 · Telecine (13%)9 Showtime Australia (50%)10 · STATS (50%)11 LAP TV4 Owned with the National Geographic Society 5 Originally a joint venture with sister company British Sky Broadcasting (1997 – 2007) 6 Joint venture with CJ Media Korea 7 Owned with HM Capital Partners 8 Owned with Big Ten Conference 9 Owned with Globosat, Paramount Pictures, Universal Pictures, MGM and DreamWorks 10 Owned with Sony Pictures Entertainment, NBCUniversal, Viacom, and Liberty Global 11 Owned with Associated Press
USA Amistad · Avon · Caedmon · Ecco · Greenwillow · Harper · Harper Perennial · HarperOne · I Can Read! · It · Joanna Cotler · Katherine Tegan · Laura Gerringer · Morrow · Newmarket · Rayo · Thomas Nelson · Zondervan
UK Collins · Collins Bartholomew · Fourth Estate · The Friday Project · Blue Door · Thorsons/Element · Voyager
Australia Angus & Robertson
Metropolitan newspapers Community newspapers Sun newspapers (Northern Territory)Regional newspapers Sports Other properties Newspoll (50%)Papua New Guinea Post-Courier (63%) · Premier Media Group (50%)
Channels Defunct channels SKY Vivo · SKY ShowJoint ventures
(Radio stations)Sky Music · 50 Songs · Yesterjay '90 · Yesterjay '80 · Capital '70 · Vintage '60 · Rock Classic · Rock Shock · Soulsista · Hit Italia · ItalianVintage · Livetime · Heart 'n Song · B-Side · Ritmo Latino · Dance · Yesterday 2000 · Jazz & Fusion · Jazz Gold · Soul Train · Extrabeat · Sinfonia · Opera · Cinema Deejay · Baby Mix · Disc JokerSee also Sky HD (Italy) · List of channels on Sky ItaliaIndia Channel [V] · STAR Gold · STAR Jalsha · STAR Movies · STAR One · Star Plus · Star Pravah · STAR Utsav · STAR World · Asianet Communications (81%)8 (Asianet · Asianet Sitara · Asianet Suvarna)( · ESPN Star Sports (50%)9 · Hathway (17%) · MCCS (26%)10 (STAR News · STAR Ananda · STAR Majha) · Vijay (81%) · Tata Sky (30%)11China STAR Chinese Channel · STAR Chinese Movies · Xing Kong (47%)12 · Channel [V] · Phoenix Television (18%)Star Select Broadcast Middle East (50%)11 (FARSI1 · Zemzemeh) · Rotana (15%)8 With Jupiter Entertainment 9 With ESPN 10 With ABP Group 11 With China Media Capital 11 With Tata Group 12 With MOBY Group US newspapers The Daily · New York Post · Community Newspaper Group (Bronx Times-Reporter · The Brooklyn Paper · Courier-Life Newspapers · TimesLedger Newspapers)Satellite investments BSkyB (39.1%) · Foxtel (25%) · Sky Deutschland (49.90%) · Sky Network Television (44%)
Other assets News America Marketing · NDS (49%) · News Outdoor · STAR DEN (50%) · Hulu1 · MySpace (5%)
1 Joint venture with NBC Universal and The Walt Disney Company.
Annual revenue $30.4 billion USD ( 17% FY 2009) · Employees 64,000 · Stock symbols NYSE: NWS / NYSE: NWSa / ASX: NWS / LSE: NCRA
See also List of assets owned by News CorporationCategories:- Companies listed on the New York Stock Exchange
- Dow Jones Industrial Average
- American stock market indices
- Dow Jones & Company
- 1896 establishments in the United States
- Warrants issued in Hong Kong Stock Exchange
- Callable Bull/Bear Contracts issued in Hong Kong Stock Exchange


Wikimedia Foundation. 2010.