- Computer graphics
-
- This article is about graphics created using computers. For the article about the scientific study of computer graphics, see Computer graphics (computer science). For other uses, see Computer graphics (disambiguation).
 A Blender 2.45 screenshot, displaying the 3D test model Suzanne.
 A 2D rendering of a 3D projection of a 4D Pentachoron performing a double rotation about two orthogonal planes.
Computer graphics are graphics created using computers and, more generally, the representation and manipulation of image data by a computer with help from specialized software and hardware.
The development of computer graphics has made computers easier to interact with, and better for understanding and interpreting many types of data. Developments in computer graphics have had a profound impact on many types of media and have revolutionized animation, movies and the video game industry.
Contents
Overview
The term computer graphics has been used in a broad sense to describe "almost everything on computers that is not text or sound".[1] Typically, the term computer graphics refers to several different things:
- the representation and manipulation of image data by a computer
- the various technologies used to create and manipulate images
- the images so produced, and
- the sub-field of computer science which studies methods for digitally synthesizing and manipulating visual content, see study of computer graphics
Today, computers and computer-generated images touch many aspects of daily life. Computer imagery is found on television, in newspapers, for example in weather reports, or for example in all kinds of medical investigation and surgical procedures. A well-constructed graph can present complex statistics in a form that is easier to understand and interpret. In the media "such graphs are used to illustrate papers, reports, thesis", and other presentation material.[2]
Many powerful tools have been developed to visualize data. Computer generated imagery can be categorized into several different types: 2D, 3D, and animated graphics. As technology has improved, 3D computer graphics have become more common, but 2D computer graphics are still widely used. Computer graphics has emerged as a sub-field of computer science which studies methods for digitally synthesizing and manipulating visual content. Over the past decade, other specialized fields have been developed like information visualization, and scientific visualization more concerned with "the visualization of three dimensional phenomena (architectural, meteorological, medical, biological, etc.), where the emphasis is on realistic renderings of volumes, surfaces, illumination sources, and so forth, perhaps with a dynamic (time) component".[3]
History
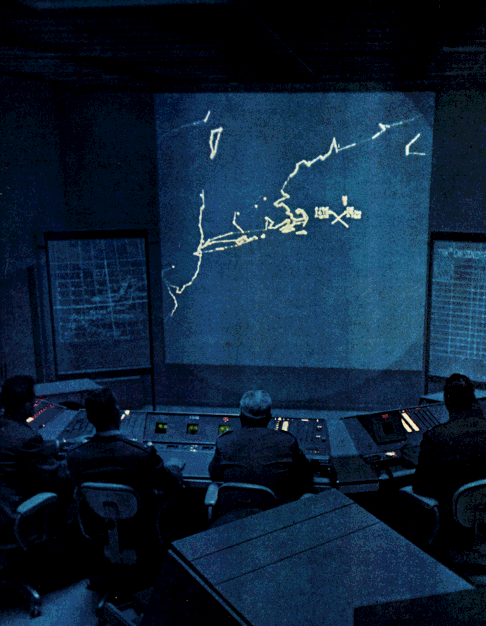
The phrase “Computer Graphics” was coined in 1960 by William Fetter, a graphic designer for Boeing.[4] The field of computer graphics developed with the emergence of computer graphics hardware. Early projects like the Whirlwind and SAGE Projects introduced the CRT as a viable display and interaction interface and introduced the light pen as an input device.
 SAGE Sector Control Room.
Initial 1960s developments
Further advances in computing led to greater advancements in interactive computer graphics. In 1959, the TX-2 computer was developed at MIT's Lincoln Laboratory. The TX-2 integrated a number of new man-machine interfaces. A light pen could be used to draw sketches on the computer using Ivan Sutherland's revolutionary Sketchpad software.[4] Using a light pen, Sketchpad allowed one to draw simple shapes on the computer screen, save them and even recall them later. The light pen itself had a small photoelectric cell in its tip. This cell emitted an electronic pulse whenever it was placed in front of a computer screen and the screen's electron gun fired directly at it. By simply timing the electronic pulse with the current location of the electron gun, it was easy to pinpoint exactly where the pen was on the screen at any given moment. Once that was determined, the computer could then draw a cursor at that location.
Sutherland seemed to find the perfect solution for many of the graphics problems he faced. Even today, many standards of computer graphics interfaces got their start with this early Sketchpad program. One example of this is in drawing constraints. If one wants to draw a square for example, s/he does not have to worry about drawing four lines perfectly to form the edges of the box. One can simply specify that s/he wants to draw a box, and then specify the location and size of the box. The software will then construct a perfect box, with the right dimensions and at the right location. Another example is that Sutherland's software modeled objects - not just a picture of objects. In other words, with a model of a car, one could change the size of the tires without affecting the rest of the car. It could stretch the body of the car without deforming the tires.
These early computer graphics were vector graphics, composed of thin lines whereas modern day graphics are Raster based using pixels.
Further 1960s developments
 Spacewar! running on the Computer History Museum's PDP-1.
Also in 1961 another student at MIT, Steve Russell, created the first video game, Spacewar. Written for the DEC PDP-1, Spacewar was an instant success and copies started flowing to other PDP-1 owners and eventually even DEC got a copy. The engineers at DEC used it as a diagnostic program on every new PDP-1 before shipping it. The sales force picked up on this quickly enough and when installing new units, would run the world's first video game for their new customers.
E. E. Zajac, a scientist at Bell Telephone Laboratory (BTL), created a film called "Simulation of a two-giro gravity attitude control system" in 1963.[5] In this computer generated film, Zajac showed how the attitude of a satellite could be altered as it orbits the Earth. He created the animation on an IBM 7090 mainframe computer. Also at BTL, Ken Knowlton, Frank Sindon and Michael Noll started working in the computer graphics field. Sindon created a film called Force, Mass and Motion illustrating Newton's laws of motion in operation. Around the same time, other scientists were creating computer graphics to illustrate their research. At Lawrence Radiation Laboratory, Nelson Max created the films, "Flow of a Viscous Fluid" and "Propagation of Shock Waves in a Solid Form." Boeing Aircraft created a film called "Vibration of an Aircraft."
It was not long before major corporations started taking an interest in computer graphics. TRW, Lockheed-Georgia, General Electric and Sperry Rand are among the many companies that were getting started in computer graphics by the mid-1960s. IBM was quick to respond to this interest by releasing the IBM 2250 graphics terminal, the first commercially available graphics computer.
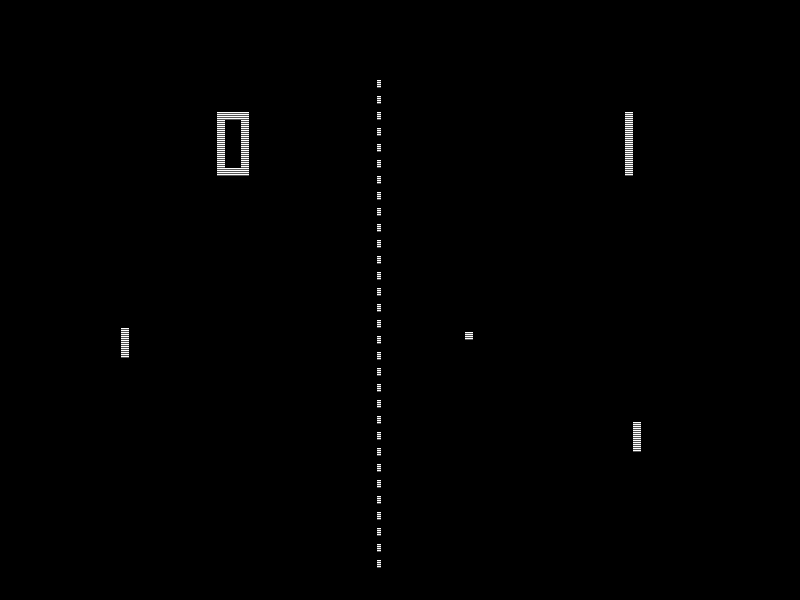
 Pong arcade version
Ralph Baer, a supervising engineer at Sanders Associates, came up with a home video game in 1966 that was later licensed to Magnavox and called the Odyssey. While very simplistic, and requiring fairly inexpensive electronic parts, it allowed the player to move points of light around on a screen. It was the first consumer computer graphics product.
Also in 1966, Sutherland at MIT invented the first computer controlled head-mounted display (HMD). Called the Sword of Damocles because of the hardware required for support, it displayed two separate wireframe images, one for each eye. This allowed the viewer to see the computer scene in stereoscopic 3D. After receiving his Ph.D. from MIT, Sutherland became Director of Information Processing at ARPA (Advanced Research Projects Agency), and later became a professor at Harvard.
David C. Evans was director of engineering at Bendix Corporation's computer division from 1953 to 1962, after which he worked for the next five years as a visiting professor at Berkeley. There he continued his interest in computers and how they interfaced with people. In 1968 the University of Utah recruited Evans to form a computer science program, and computer graphics quickly became his primary interest. This new department would become the world's primary research center for computer graphics.
In 1967 Sutherland was recruited by Evans to join the computer science program at the University of Utah. There he perfected his HMD. Twenty years later, NASA would re-discover his techniques in their virtual reality research. At Utah, Sutherland and Evans were highly sought after consultants by large companies but they were frustrated at the lack of graphics hardware available at the time so they started formulating a plan to start their own company.
In 1969, the ACM initiated A Special Interest Group in Graphics (SIGGRAPH) which organizes conferences, graphics standards, and publications within the field of computer graphics. In 1973, the first annual SIGGRAPH conference was held, which has become one of the focuses of the organization. SIGGRAPH has grown in size and importance as the field of computer graphics has expanded over time.
1970s
Many of the most important early breakthroughs in computer graphics research occurred at the University of Utah in the 1970s. A student by the name of Edwin Catmull started at the University of Utah in 1970 and signed up for Sutherland's computer graphics class. Catmull had just come from The Boeing Company and had been working on his degree in physics. Growing up on Disney, Catmull loved animation yet quickly discovered that he did not have the talent for drawing. Now Catmull (along with many others) saw computers as the natural progression of animation and they wanted to be part of the revolution. The first animation that Catmull saw was his own. He created an animation of his hand opening and closing. It became one of his goals to produce a feature length motion picture using computer graphics. In the same class, Fred Parke created an animation of his wife's face. Because of Evan's and Sutherland's presence, UU was gaining quite a reputation as the place to be for computer graphics research so Catmull went there to learn 3D animation.
As the UU computer graphics laboratory was attracting people from all over, John Warnock was one of those early pioneers; he would later found Adobe Systems and create a revolution in the publishing world with his PostScript page description language. Tom Stockham led the image processing group at UU which worked closely with the computer graphics lab. Jim Clark was also there; he would later found Silicon Graphics, Inc.
The first major advance in 3D computer graphics was created at UU by these early pioneers, the hidden-surface algorithm. In order to draw a representation of a 3D object on the screen, the computer must determine which surfaces are "behind" the object from the viewer's perspective, and thus should be "hidden" when the computer creates (or renders) the image.
1980s
In the 1980s, artists and graphic designers began to see the personal computer, particularly the Commodore Amiga and Macintosh, as a serious design tool, one that could save time and draw more accurately than other methods. In the late 1980s, SGI computers were used to create some of the first fully computer-generated short films at Pixar. The Macintosh remains a highly popular tool for computer graphics among graphic design studios and businesses. Modern computers, dating from the 1980s often use graphical user interfaces (GUI) to present data and information with symbols, icons and pictures, rather than text. Graphics are one of the five key elements of multimedia technology.
1990s
3D graphics became more popular in the 1990s in gaming, multimedia and animation. At the end of the 80s and beginning of the nineties were created, in France, the very first computer graphics TV series: "La Vie des bêtes" by studio Mac Guff Ligne (1988), Les Fables Géométriques J.-Y. Grall, Georges Lacroix and Renato (studio Fantome, 1990-1993) and Quarxs, the first HDTV computer graphics series by Maurice Benayoun and François Schuiten (studio Z-A production, 1991-1993). In 1995, Toy Story, the first full-length computer-generated animation film, was released in cinemas worldwide. In 1996, Quake, one of the first fully 3D games, was released. Since then, computer graphics have only become more detailed and realistic, due to more powerful graphics hardware and 3D modeling software.
Image types
Two-dimensional

2D computer graphics are the computer-based generation of digital images—mostly from two-dimensional models, such as 2D geometric models, text, and digital images, and by techniques specific to them.
2D computer graphics are mainly used in applications that were originally developed upon traditional printing and drawing technologies, such as typography, cartography, technical drawing, advertising, etc.. In those applications, the two-dimensional image is not just a representation of a real-world object, but an independent artifact with added semantic value; two-dimensional models are therefore preferred, because they give more direct control of the image than 3D computer graphics, whose approach is more akin to photography than to typography.
Pixel art
Pixel art is a form of digital art, created through the use of raster graphics software, where images are edited on the pixel level. Graphics in most old (or relatively limited) computer and video games, graphing calculator games, and many mobile phone games are mostly pixel art.
Vector graphics
 Example showing effect of vector graphics versus raster (bitmap) graphics.
Vector graphics formats are complementary to raster graphics, which is the representation of images as an array of pixels, as it is typically used for the representation of photographic images [6] Vector graphics consists in encoding information about shapes and colors that comprise the image, which can allow for more flexibility in rendering. There are instances when working with vector tools and formats is best practice, and instances when working with raster tools and formats is best practice. There are times when both formats come together. An understanding of the advantages and limitations of each technology and the relationship between them is most likely to result in efficient and effective use of tools.
Three-dimensional
3D computer graphics in contrast to 2D computer graphics are graphics that use a three-dimensional representation of geometric data that is stored in the computer for the purposes of performing calculations and rendering 2D images. Such images may be for later display or for real-time viewing.
Despite these differences, 3D computer graphics rely on many of the same algorithms as 2D computer vector graphics in the wire frame model and 2D computer raster graphics in the final rendered display. In computer graphics software, the distinction between 2D and 3D is occasionally blurred; 2D applications may use 3D techniques to achieve effects such as lighting, and primarily 3D may use 2D rendering techniques.
3D computer graphics are often referred to as 3D models. Apart from the rendered graphic, the model is contained within the graphical data file. However, there are differences. A 3D model is the mathematical representation of any three-dimensional object. A model is not technically a graphic until it is visually displayed. Due to 3D printing, 3D models are not confined to virtual space. A model can be displayed visually as a two-dimensional image through a process called 3D rendering, or used in non-graphical computer simulations and calculations. There are some 3D computer graphics software for users to create 3D images.
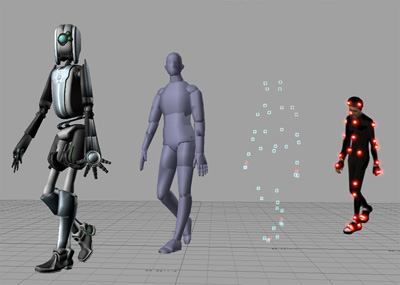
Computer animation


Computer animation is the art of creating moving images via the use of computers. It is a subfield of computer graphics and animation. Increasingly it is created by means of 3D computer graphics, though 2D computer graphics are still widely used for stylistic, low bandwidth, and faster real-time rendering needs. Sometimes the target of the animation is the computer itself, but sometimes the target is another medium, such as film. It is also referred to as CGI (Computer-generated imagery or computer-generated imaging), especially when used in films.
Virtual entities may contain and be controlled by assorted attributes, such as transform values (location, orientation, and scale) stored in an object's transformation matrix. Animation is the change of an attribute over time. Multiple methods of achieving animation exist; the rudimentary form is based on the creation and editing of keyframes, each storing a value at a given time, per attribute to be animated. The 2D/3D graphics software will interpolate between keyframes, creating an editable curve of a value mapped over time, resulting in animation. Other methods of animation include procedural and expression-based techniques: the former consolidates related elements of animated entities into sets of attributes, useful for creating particle effects and crowd simulations; the latter allows an evaluated result returned from a user-defined logical expression, coupled with mathematics, to automate animation in a predictable way (convenient for controlling bone behavior beyond what a hierarchy offers in skeletal system set up).
To create the illusion of movement, an image is displayed on the computer screen then quickly replaced by a new image that is similar to the previous image, but shifted slightly. This technique is identical to the illusion of movement in television and motion pictures.
Concepts and principles
Images are typically produced by optical devices;such as cameras, mirrors, lenses, telescopes, microscopes, etc. and natural objects and phenomena, such as the human eye or water surfaces.
A digital image is a representation of a two-dimensional image in binary format as a sequence of ones and zeros. Digital images include both vector images and raster images, but raster images are more commonly used.
Pixel
 In the enlarged portion of the image individual pixels are rendered as squares and can be easily seen.
In digital imaging, a pixel (or picture element[7]) is a single point in a raster image. Pixels are normally arranged in a regular 2-dimensional grid, and are often represented using dots or squares. Each pixel is a sample of an original image, where more samples typically provide a more accurate representation of the original. The intensity of each pixel is variable; in color systems, each pixel has typically three components such as red, green, and blue.
Graphics
Graphics are visual presentations on some surface, such as a wall, canvas, computer screen, paper, or stone to brand, inform, illustrate, or entertain. Examples are photographs, drawings, line art, graphs, diagrams, typography, numbers, symbols, geometric designs, maps, engineering drawings, or other images. Graphics often combine text, illustration, and color. Graphic design may consist of the deliberate selection, creation, or arrangement of typography alone, as in a brochure, flier, poster, web site, or book without any other element. Clarity or effective communication may be the objective, association with other cultural elements may be sought, or merely, the creation of a distinctive style.
Rendering
Rendering is the process of generating an image from a model (or models in what collectively could be called a scene file), by means of computer programs. A scene file contains objects in a strictly defined language or data structure; it would contain geometry, viewpoint, texture, lighting, and shading information as a description of the virtual scene. The data contained in the scene file is then passed to a rendering program to be processed and output to a digital image or raster graphics image file. The rendering program is usually built into the computer graphics software, though others are available as plug-ins or entirely separate programs. The term "rendering" may be by analogy with an "artist's rendering" of a scene. Though the technical details of rendering methods vary, the general challenges to overcome in producing a 2D image from a 3D representation stored in a scene file are outlined as the graphics pipeline along a rendering device, such as a GPU. A GPU is a purpose-built device able to assist a CPU in performing complex rendering calculations. If a scene is to look relatively realistic and predictable under virtual lighting, the rendering software should solve the rendering equation. The rendering equation does not account for all lighting phenomena, but is a general lighting model for computer-generated imagery. 'Rendering' is also used to describe the process of calculating effects in a video editing file to produce final video output.
- 3D projection
- 3D projection is a method of mapping three dimensional points to a two dimensional plane. As most current methods for displaying graphical data are based on planar two dimensional media, the use of this type of projection is widespread, especially in computer graphics, engineering and drafting.
- Ray tracing
- Ray tracing is a technique for generating an image by tracing the path of light through pixels in an image plane. The technique is capable of producing a very high degree of photorealism; usually higher than that of typical scanline rendering methods, but at a greater computational cost.
- Shading
 Example of shading.
- Shading refers to depicting depth in 3D models or illustrations by varying levels of darkness. It is a process used in drawing for depicting levels of darkness on paper by applying media more densely or with a darker shade for darker areas, and less densely or with a lighter shade for lighter areas. There are various techniques of shading including cross hatching where perpendicular lines of varying closeness are drawn in a grid pattern to shade an area. The closer the lines are together, the darker the area appears. Likewise, the farther apart the lines are, the lighter the area appears. The term has been recently generalized to mean that shaders are applied.
- Texture mapping
- Texture mapping is a method for adding detail, surface texture, or colour to a computer-generated graphic or 3D model. Its application to 3D graphics was pioneered by Dr Edwin Catmull in 1974. A texture map is applied (mapped) to the surface of a shape, or polygon. This process is akin to applying patterned paper to a plain white box. Multitexturing is the use of more than one texture at a time on a polygon.[8] Procedural textures (created from adjusting parameters of an underlying algorithm that produces an output texture), and bitmap textures (created in an image editing application or imported from a digital camera) are, generally speaking, common methods of implementing texture definition on 3D models in computer graphics software, while intended placement of textures onto a model's surface often requires a technique known as UV mapping (arbitrary, manual layout of texture coordinates) for polygon surfaces, while NURBS surfaces have their own intrinsic parameterization used as texture coordinates.
- Anti-aliasing
- Rendering resolution-independent entities (such as 3D models) for viewing on a raster (pixel-based) device such as a LCD display or CRT television inevitably causes aliasing artifacts mostly along geometric edges and the boundaries of texture details; these artifacts are informally called "jaggies". Anti-aliasing methods rectify such problems, resulting in imagery more pleasing to the viewer, but can be somewhat computationally expensive. Various anti-aliasing algorithms (such as supersampling) are able to be employed, then customized for the most efficient rendering performance versus quality of the resultant imagery; a graphics artist should consider this trade-off if anti-aliasing methods are to be used. A pre-anti-aliased bitmap texture being displayed on a screen (or screen location) at a resolution different than the resolution of the texture itself (such as a textured model in the distance from the virtual camera) will exhibit aliasing artifacts, while any procedurally-defined texture will always show aliasing artifacts as they are resolution-independent; techniques such as mipmapping and texture filtering help to solve texture-related aliasing problems.
Volume rendering
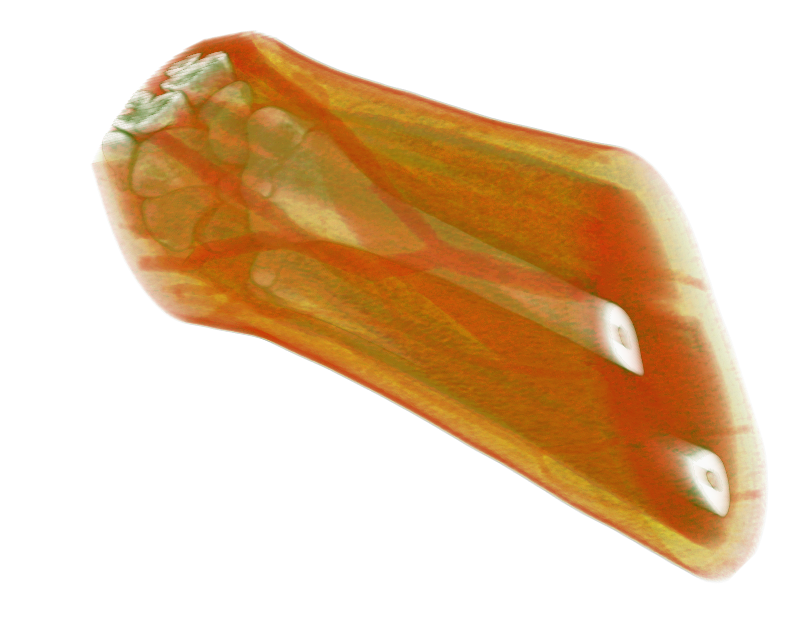
 Volume rendered CT scan of a forearm with different colour schemes for muscle, fat, bone, and blood.
Volume rendering is a technique used to display a 2D projection of a 3D discretely sampled data set. A typical 3D data set is a group of 2D slice images acquired by a CT or MRI scanner.
Usually these are acquired in a regular pattern (e.g., one slice every millimeter) and usually have a regular number of image pixels in a regular pattern. This is an example of a regular volumetric grid, with each volume element, or voxel represented by a single value that is obtained by sampling the immediate area surrounding the voxel.
3D modeling
3D modeling is the process of developing a mathematical, wireframe representation of any three-dimensional object, called a "3D model", via specialized software. Models may be created automatically or manually; the manual modeling process of preparing geometric data for 3D computer graphics is similar to plastic arts such as sculpting. 3D models may be created using multiple approaches: use of NURBS curves to generate accurate and smooth surface patches, polygonal mesh modeling (manipulation of faceted geometry), or polygonal mesh subdivision (advanced tessellation of polygons, resulting in smooth surfaces similar to NURBS models). A 3D model can be displayed as a two-dimensional image through a process called 3D rendering, used in a computer simulation of physical phenomena, or animated directly for other purposes. The model can also be physically created using 3D Printing devices.
Pioneers in graphic design
- Charles Csuri
- Charles Csuri is a pioneer in computer animation and digital fine art and created the first computer art in 1964. Csuri was recognized by Smithsonian as the father of digital art and computer animation, and as a pioneer of computer animation by the Museum of Modern Art (MoMA) and Association for Computing Machinery-SIGGRAPH.
- Donald P. Greenberg
- Donald P. Greenberg is a leading innovator in computer graphics. Greenberg has authored hundreds of articles and served as a teacher and mentor to many prominent computer graphic artists, animators, and researchers such as Robert L. Cook, Marc Levoy, and Wayne Lytle. Many of his former students have won Academy Awards for technical achievements and several have won the SIGGRAPH Achievement Award. Greenberg was the founding director of the NSF Center for Computer Graphics and Scientific Visualization.
- Aaron Marcus
- Aaron Marcus is one of the first graphic designer in the world to work with computer graphics. He has written over 250 articles and written/co-written six books. He has published, lectured, tutored, and consulted internationally for more than 40 years and has been an invited keynote/plenary speaker at conferences of ACM/SIGCHI, ACM/SIGGRAPH, Usability Professionals Association (UPA). He was was named an AIGA Fellow in 2007 and was elected in 2008 to the CHI Academy. He is the founder of Aaron Marcus and Associates, Inc., a pioneering, world-renowned design firm specializing in user-interface/user-experience development applications.
- A. Michael Noll
- Noll was one of the first researchers to use a digital computer to create artistic patterns and to formalize the use of random processes in the creation of visual arts. He began creating digital computer art in 1962, making him one of the earliest digital computer artists. In 1965, Noll along with Frieder Nake and Georg Nees were the first to publicly exhibit their computer art. During April 1965, the Howard Wise Gallery exhibited Noll's computer art along with random-dot patterns by Bela Julesz.
 A modern render of the Utah teapot, an iconic model in 3D computer graphics created by Martin Newell, 1975.
- Other pioneers
- Jim Blinn
- Arambilet
- Benoît B. Mandelbrot
- Henri Gouraud
- Bui Tuong Phong
- Pierre Bézier
- Paul de Casteljau
- Daniel J. Sandin
- Alvy Ray Smith
- Ton Roosendaal
- Ivan Sutherland
- Steve Russell
The study of computer graphics
The study of computer graphics is a sub-field of computer science which studies methods for digitally synthesizing and manipulating visual content. Although the term often refers to three-dimensional computer graphics, it also encompasses two-dimensional graphics and image processing.
As an academic discipline, computer graphics studies the manipulation of visual and geometric information using computational techniques. It focuses on the mathematical and computational foundations of image generation and processing rather than purely aesthetic issues. Computer graphics is often differentiated from the field of visualization, although the two fields have many similarities.
Applications
Computer graphics may be used in the following areas:
- Computational biology
- Computational physics
- Computer-aided design
- Computer simulation
- Digital art
- Education
- Graphic design
- Infographics
- Information visualization
- Rational drug design
- Scientific visualization
- Video Games
- Virtual reality
- Web design
References
- ^ What is Computer Graphics?, Cornell University Program of Computer Graphics. Last updated 04/15/98. Accessed November 17, 2009.
- ^ University of Leeds ISS (2002). "What are computer graphics?". Last updated: 22 September 2008
- ^ Michael Friendly (2008). "Milestones in the history of thematic cartography, statistical graphics, and data visualization".
- ^ a b Wayne Carlson (2003) A Critical History of Computer Graphics and Animation. The Ohio State University
- ^ David Salomon (1999). Computer graphics and geometric modeling. p. ix
- ^ Ira Greenberg (2007). Processing: Creative Coding and Computational Art. Apress. ISBN 159059617X. http://books.google.com/books?id=WTl_7H5HUZAC&pg=PA115&dq=raster+vector+graphics+photographic&lr=&as_brr=0&ei=llOVR5LKCJL0iwGZ8-ywBw&sig=YEjfPOYSUDIf1CUbL5S5Jbzs7M8.
- ^ Rudolf F. Graf (1999). Modern Dictionary of Electronics. Oxford: Newnes. p. 569. ISBN 0-7506-43315. http://books.google.com/books?id=o2I1JWPpdusC&pg=PA569&dq=pixel+intitle:%22Modern+Dictionary+of+Electronics%22+inauthor:graf&lr=&as_brr=0&ei=5ygASM3qHoSgiwH45-GIDA&sig=7tg-LuGdu6Njypaawi2bbkeq8pw.
- ^ Blythe, David. Advanced Graphics Programming Techniques Using OpenGL. Siggraph 1999. (see: Multitexture)
Further reading
- David Rogers (1998). Procedural Elements for Computer Graphics. McGraw-Hill.
- James D. Foley, Andries Van Dam, Steven K. Feiner and John F. Hughes (1995). Computer Graphics: Principles and Practice. Addison-Wesley
- Donald Hearn and M. Pauline Baker (1994). Computer Graphics. Prentice-Hall.
- Francis S. Hill (2001). Computer Graphics. Prentice Hall.
- John Lewell (1985). Computer Graphics: A Survey of Current Techniques and Applications. Van Nostrand Reinhold.
- Jeffrey J. McConnell (2006). Computer Graphics: Theory Into Practice. Jones & Bartlett Publishers.
- R. D. Parslow, R. W. Prowse, Richard Elliot Green (1969). Computer Graphics: Techniques and Applications.
- Peter Shirley and others. (2005). Fundamentals of computer graphics. A.K. Peters, Ltd.
- M. Slater, A. Steed, Y. Chrysantho (2002). Computer graphics and virtual environments: from realism to real-time. Addison-Wesley
External links
- A Critical History of Computer Graphics and Animation
- History of Computer Graphics series of articles
Categories:


Wikimedia Foundation. 2010.