- Mira Monte, California
-
Not to be confused with Miramonte, California.
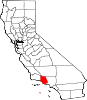
Mira Monte — census-designated place — Location in Ventura County and the state of California
Coordinates: 34°25′39″N 119°17′27″W / 34.4275°N 119.29083°WCoordinates: 34°25′39″N 119°17′27″W / 34.4275°N 119.29083°W Country  United States
State  California
County Ventura Government – N/A – Senate Tom McClintock (R) – Assembly Audra Strickland (R) – U. S. Congress Elton Gallegly (R) Area[1] – Total 4.587 sq mi (11.881 km2) – Land 4.570 sq mi (11.837 km2) – Water 0.017 sq mi (0.045 km2) 0.38% Elevation 643 ft (196 m) Population (2010) – Total 6,854 – Density 1,494.2/sq mi (576.9/km2) Time zone PST (UTC-8) – Summer (DST) PDT (UTC-7) ZIP code 93023 Area code(s) 805 FIPS code 06-48046 GNIS feature ID 1661036 Mira Monte is a census-designated place (CDP) in Ventura County, California, United States. According to the 2010 census, the population of Mira Monte is 6,845, down from 7,177 at the 2000 census.
Contents
Geography
Mira Monte is located in the mid-section of the Ojai Valley surrounded by the towns of Oak View, Meiners Oaks (both census designated), and the City of Ojai, California at 34°25′39″N 119°17′27″W / 34.427463°N 119.290725°W.[2]
According to the United States Census Bureau, the CDP has a total area of 4.6 square miles (12 km2), of which, 4.6 square miles (12 km2) of it is land and 0.017 square miles (0.044 km2) of it (0.38%) is water.
Education
Mira Monte is served by the Ojai Unified School District, and there is only one public school within the town, Mira Monte Elementary School, which is located at the northeast intersection of Loma Drive and Highway 33 (Ojai Avenue/Ventura Avenue) or more specifically at 1216 Loma Drive.
Demographics
2010
The 2010 United States Census[3] reported that Mira Monte had a population of 6,854. The population density was 1,494.1 people per square mile (576.9/km²). The racial makeup of Mira Monte was 5,989 (87.4%) White, 43 (0.6%) African American, 61 (0.9%) Native American, 129 (1.9%) Asian, 3 (0.0%) Pacific Islander, 406 (5.9%) from other races, and 223 (3.3%) from two or more races. Hispanic or Latino of any race were 1,254 persons (18.3%).
The Census reported that 6,824 people (99.6% of the population) lived in households, 30 (0.4%) lived in non-institutionalized group quarters, and 0 (0%) were institutionalized.
There were 2,800 households, out of which 742 (26.5%) had children under the age of 18 living in them, 1,436 (51.3%) were opposite-sex married couples living together, 274 (9.8%) had a female householder with no husband present, 130 (4.6%) had a male householder with no wife present. There were 115 (4.1%) unmarried opposite-sex partnerships, and 22 (0.8%) same-sex married couples or partnerships. 792 households (28.3%) were made up of individuals and 439 (15.7%) had someone living alone who was 65 years of age or older. The average household size was 2.44. There were 1,840 families (65.7% of all households); the average family size was 2.97.
The population was spread out with 1,330 people (19.4%) under the age of 18, 488 people (7.1%) aged 18 to 24, 1,286 people (18.8%) aged 25 to 44, 2,301 people (33.6%) aged 45 to 64, and 1,449 people (21.1%) who were 65 years of age or older. The median age was 48.0 years. For every 100 females there were 93.2 males. For every 100 females age 18 and over, there were 90.0 males.
There were 3,009 housing units at an average density of 655.9 per square mile (253.3/km²), of which 2,227 (79.5%) were owner-occupied, and 573 (20.5%) were occupied by renters. The homeowner vacancy rate was 2.2%; the rental vacancy rate was 4.0%. 5,338 people (77.9% of the population) lived in owner-occupied housing units and 1,486 people (21.7%) lived in rental housing units.
2000
As of the census[4] of 2000, there were 7,177 people, 2,619 households, and 1,893 families residing in the CDP. The population density was 1,705.1 people per square mile (658.2/km²). There were 2,698 housing units at an average density of 641.0 per square mile (247.4/km²). The racial makeup of the CDP was 89.37% White, 0.53% African American, 0.78% Native American, 1.14% Asian, 0.08% Pacific Islander, 5.02% from other races, and 3.08% from two or more races. Hispanic or Latino of any race were 13.25% of the population.
There were 2,619 households out of which 33.4% had children under the age of 18 living with them, 59.3% were married couples living together, 9.7% had a female householder with no husband present, and 27.7% were non-families. 22.5% of all households were made up of individuals and 11.4% had someone living alone who was 65 years of age or older. The average household size was 2.65 and the average family size was 3.11.
In the CDP the population was spread out with 25.2% under the age of 18, 6.8% from 18 to 24, 25.7% from 25 to 44, 27.3% from 45 to 64, and 15.0% who were 65 years of age or older. The median age was 41 years. For every 100 females there were 91.2 males. For every 100 females age 18 and over, there were 86.2 males.
The median income for a household in the CDP was $55,377, and the median income for a family was $62,083. Males had a median income of $49,931 versus $36,201 for females. The per capita income for the CDP was $25,393. About 3.6% of families and 6.2% of the population were below the poverty line, including 6.2% of those under age 18 and 1.7% of those age 65 or over.
References
- ^ U.S. Census
- ^ "US Gazetteer files: 2010, 2000, and 1990". United States Census Bureau. 2011-02-12. http://www.census.gov/geo/www/gazetteer/gazette.html. Retrieved 2011-04-23.
- ^ All data are derived from the United States Census Bureau reports from the 2010 United States Census, and are accessible on-line here. The data on unmarried partnerships and same-sex married couples are from the Census report DEC_10_SF1_PCT15. All other housing and population data are from Census report DEC_10_DP_DPDP1. Both reports are viewable online or downloadable in a zip file containing a comma-delimited data file. The area data, from which densities are calculated, are available on-line here. Percentage totals may not add to 100% due to rounding. The Census Bureau defines families as a household containing one or more people related to the householder by birth, opposite-sex marriage, or adoption. People living in group quarters are tabulated by the Census Bureau as neither owners nor renters. For further details, see the text files accompanying the data files containing the Census reports mentioned above.
- ^ "American FactFinder". United States Census Bureau. http://factfinder.census.gov. Retrieved 2008-01-31.
Municipalities and communities of Ventura County, California Cities Camarillo | Fillmore | Moorpark | Ojai | Oxnard | Port Hueneme | Santa Paula | Simi Valley | Thousand Oaks | Ventura
CDPs Bell Canyon | Casa Conejo | Channel Islands Beach | El Rio | Lake Sherwood | Meiners Oaks | Mira Monte | Oak Park | Oak View | Piru | Santa Rosa Valley | Santa Susana | Saticoy
Unincorporated
communitiesBardsdale | Buckhorn | Casitas Springs | Dulah | Faria | La Conchita | Newbury Park | Point Mugu | Sea Cliff | Somis | Upper Ojai
Categories:- Census-designated places in Ventura County, California


Wikimedia Foundation. 2010.