- Infant mortality
-
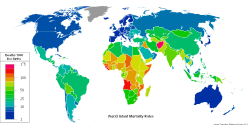 World infant mortality rates in 2008[1]
Infant mortality is defined as the number of infant deaths (one year of age or younger) per 1000 live births. Traditionally, the most common cause worldwide was dehydration from diarrhea. However, the spreading information about Oral Re-hydration Solution (a mixture of salts, sugar, and water) to mothers around the world has decreased the rate of children dying from dehydration. Currently, the most common cause is pneumonia. Other causes of infant mortality include: malnutrition, malaria, congenital malformation, infection and SIDS.
Infanticide, child abuse, child abandonment, and neglect also contribute to a lesser extent.[citation needed] Related statistical categories:
- Perinatal mortality only includes deaths between the foetal viability (22 weeks gestation) and the end of the 7th day after delivery.
- Neonatal mortality only includes deaths in the first 28 days of life.
- Postneonatal mortality only includes deaths after 28 days of life but before one year.
- Child mortality includes deaths within the first five years after birth.
World historical and predicted infant mortality rates per 1,000 births (1950–2050)
UN, medium variant, 2008 rev.[2]Years Rate Years Rate 1950–1955 152 2000–2005 52 1955–1960 136 2005–2010 47 1960–1965 116 2010–2015 43 1965–1970 100 2015–2020 40 1970–1975 91 2020–2025 37 1975–1980 83 2025–2030 34 1980–1985 74 2030–2035 31 1985–1990 65 2035–2040 28 1990–1995 61 2040–2045 25 1995–2000 57 2045–2050 23  Cemetery at Cades Cove with three graves of infants born to the same parents in 1916, 1917 and 1918.
Contents
Infant mortality rate
Infant mortality rate (IMR) indicates the number of deaths of babies under one year of age per 1,000 live births. The rate in a given region, therefore, is the total number of newborns dying under one year of age divided by the total number of live births during the year, then all multiplied by 1,000. The infant mortality rate is also called the infant death rate (per 1,000 live births).
Historically, infant mortality claimed a considerable percentage of children born, in the 1850s in America it was estimated to be as 216.8 per 1,000 for whites and 340.0 for African Americans but rates have significantly declined in the West in modern times. This has been mainly due to improvements in basic health care, though high-technology medical advances have also helped. Infant mortality rate is commonly included as a part of standard of living evaluations in economics.[3]
Comparing infant mortality rates
The infant mortality rate correlates very strongly with, and is among the best predictors of, state failure.[4] IMR is therefore also a useful indicator of a country's level of health or development, and is a component of the physical quality of life index. However, the method of calculating IMR often varies widely between countries, and is based on how they define a live birth and how many premature infants are born in the country. The World Health Organization (WHO) defines a live birth as any born human being who demonstrates independent signs of life, including breathing, voluntary muscle movement, or heartbeat. Many countries, however, including certain European states and Japan, only count as live births cases where an infant breathes at birth, which makes their reported IMR numbers somewhat lower and raises their rates of perinatal mortality.[5]
The exclusion of any risk infants from the denominator or numerator in reported IMRs can be problematic for comparisons. Many countries, including the United States, Sweden or Germany, count an infant exhibiting any sign of life as alive, no matter the month of gestation or the size, but according to United States Centers for Disease Control (CDC) researchers,[6] some other countries differ in these practices. All of the countries named adopted the WHO definitions in the late 1980s or early 1990s,[7] which are used throughout the European Union.[8] However, in 2009, the US CDC issued a report that stated that the American rates of infant mortality were affected by the United States' high rates of premature babies compared to European countries. It also outlined the differences in reporting requirements between the United States and Europe, noting that France, the Czech Republic, Ireland, the Netherlands, and Poland do not report all live births of babies under 500 g and/or 22 weeks of gestation.[6][9][10] The report concluded, however, that the differences in reporting are unlikely to be the primary explanation for the United States’ relatively low international ranking.[10]
Another well-documented example also illustrates this problem. Until the 1990s, Russia and the Soviet Union did not count, as a live birth or as an infant death, extremely premature infants (less than 1,000 g, less than 28 weeks gestational age, or less than 35 cm in length) that were born alive (breathed, had a heartbeat, or exhibited voluntary muscle movement) but failed to survive for at least seven days.[11] Although such extremely premature infants typically accounted for only about 0.005% of all live-born children, their exclusion from both the numerator and the denominator in the reported IMR led to an estimated 22%-25% lower reported IMR.[12] In some cases, too, perhaps because hospitals or regional health departments were held accountable for lowering the IMR in their catchment area, infant deaths that occurred in the 12th month were "transferred" statistically to the 13th month (i.e., the second year of life), and thus no longer classified as an infant death.[13]
UNICEF uses a statistical methodology to account for reporting differences among countries:
“ UNICEF compiles infant mortality country estimates derived from all sources and methods of estimation obtained either from standard reports, direct estimation from micro data sets, or from UNICEF’s yearly exercise. In order to sort out differences between estimates produced from different sources, with different methods, UNICEF developed, in coordination with WHO, the WB and UNSD, an estimation methodology that minimizes the errors embodied in each estimate and harmonize trends along time. Since the estimates are not necessarily the exact values used as input for the model, they are often not recognized as the official IMR estimates used at the country level. However, as mentioned before, these estimates minimize errors and maximize the consistency of trends along time.[14] ” Another challenge to comparability is the practice of counting frail or premature infants who die before the normal due date as miscarriages (spontaneous abortions) or those who die during or immediately after childbirth as stillborn. Therefore, the quality of a country's documentation of perinatal mortality can matter greatly to the accuracy of its infant mortality statistics. This point is reinforced by the demographer Ansley Coale, who finds dubiously high ratios of reported stillbirths to infant deaths in Hong Kong and Japan in the first 24 hours after birth, a pattern that is consistent with the high recorded sex ratios at birth in those countries. It suggests not only that many female infants who die in the first 24 hours are misreported as stillbirths rather than infant deaths, but also that those countries do not follow WHO recommendations for the reporting of live births and infant deaths.[15]
Another seemingly paradoxical finding is that when countries with poor medical services introduce new medical centers and services, instead of declining the reported IMRs often increase for a time. This is mainly because improvement in access to medical care is often accompanied by improvement in the registration of births and deaths. Deaths that might have occurred in a remote or rural area, and not been reported to the government, might now be reported by the new medical personnel or facilities. Thus, even if the new health services reduce the actual IMR, the reported IMR may increase.
Infant mortality rate in war
In most cases, war-affected areas will experience a significant increase in infant mortality rates. The primary causes of the increase are external factors such as murder and abuse. However, many other significant factors influence infant mortality rates in war-torn areas. Health care systems in developing countries in the midst of war often collapse. Attaining basic medical supplies and care becomes increasingly difficult. During the Yugoslav Wars in the 1990s Bosnia experienced a 60% decrease in child immunizations. Preventable diseases can quickly become epidemic given the medical conditions during war.[16]
Many developing countries rely on foreign aid for basic nutrition. Transport of aid becomes significantly more difficult in times of war. In most situations the average weight of a population will drop substantially.[17] Expecting mothers are affected even more by lack of access to food and water. During the Yugoslav Wars in Bosnia the number of premature babies born increased and the average birth weight decreased.[16]
There have been several instances in recent years of systematic rape as a weapon of war. Women who become pregnant as a result of war rape face even more significant challenges in bearing a healthy child. Studies suggest that women who experience sexual violence before or during pregnancy are more likely to experience infant death in their children.[18][19][20] Causes of infant mortality in abused women range from physical side effects of the initial trauma to psychological effects that lead to poor adjustment to society. Many women who became pregnant by rape in Bosnia were isolated from their hometowns making life after childbirth exponentially more difficult.[21]
Global infant mortality trends
For the world, and for both Less Developed Countries (LDCs) and More Developed Countries (MDCs), IMR declined significantly between 1960 and 2001. According to the Save the Children State of the World's Mothers report, the world infant mortality rate declined from 126 in 1960 to 57 in 2001.[22]
However, IMR was, and remains, higher in LDCs. In 2001, the Infant Mortality Rate for Less Developed Countries (91) was about 10 times as large as it was for More Developed Countries (8). For Least Developed Countries, the Infant Mortality Rate is 17 times as high as it is for More Developed Countries. Also, while both LDCs and MDCs made dramatic reductions in infant mortality rates, reductions among less developed countries are, on average, much less than those among the more developed countries.
Infant mortality rate in countries
Main article: List of countries by infant mortality rate Nikolai Yaroshenko. Funeral of Firstborn, 1893
Nearly two orders of magnitude separate countries with the highest and lowest reported infant mortality rates. The top and bottom five countries by this measure (taken from The World Factbook's 2009 estimates) are shown below.
Rank Country Infant mortality rate
(deaths/1,000 live births)1 Angola 180.21 2 Sierra Leone 154.43 3 Afghanistan 151.95 4 Liberia 138.24 5 Niger 116.66 219 Hong Kong 2.92 220 Japan 2.79 221 Sweden 2.75 222 Bermuda 2.46 223 Singapore 2.31 Afghanistan's infant mortality rate is expected to improved by at least 60% in the next ten years due to billions of dollars of international aid.[23]
United States
In the United States, infant mortality is 629 per 100,000 live births or 6.3 per 1000 live births.[24][25]
 Infant mortality rates in the United States per 100,000 live births for 10 leading causes of, 2005[26]
The infant mortality rate for European Americans was 5.7 per 1000 births in 2003-05. For African Americans it was 13.6 per 1000, and for Hispanic Americans it was 5.6 per 1000. Overall, the infant mortality rate for the United States was 6.9 per 1000 in 2003-05. Source from Statehealthfacts.org
Infant Mortality Rate by State (2005)
State Infant mortality Rate per 1000 births Alabama 8.96[27] Alaska 6.45[28] Arizona 6.69[29] Arkansas 8.29 [30] California 5.22[31] Colorado 6.27[32] Connecticut 5.53[33] Delaware 9.03[34] District of Columbia 14.1[35] Florida 7.24[36] Georgia 8.35[37] Hawaii 6.67[38] Idaho 6.12[39] Illinois 7.53[40] Indiana 7.87[41] Iowa 5.40[42] Kansas 7.12[43] Kentucky 6.79[44] Louisiana 9.79[45] Maine 5.87[46] Maryland 8.00[47] Massachusetts 4.89[48] Michigan 8.02[49] Minnesota 4.78[50] Mississippi 10.74[51] Missouri 7.63[52] Montana 6.35[53] Nebraska 5.89[54] Nevada 5.86[42] New Hampshire 5.05[55] New Jersey 5.44[56] New Mexico 6.13[57] New York 6.02[58] North Carolina 8.85[59] North Dakota 6.35[60] Ohio 7.82[61] Oklahoma 7.86[62] Oregon 5.68[63] Pennsylvania 7.30[64] Rhode Island 6.20[65] South Carolina 9.03[66] South Dakota 7.18[67] Tennessee 8.87[68] Texas 6.45[69] Utah 4.92[70] Vermont 5.37[71] Virginia 7.50[72] Washington 5.39[73] West Virginia 8.1[35] Wisconsin 6.34[74] Wyoming 6.95[75] Infant Mortality as a Historical Economic Indicator
In the United States, historically there has been a negative relationship between infant mortality rates and economic factors such as average wage. This relationship is likely caused indirectly by several variables, both exogenous and endogenous.
Research into the era between 1900 and 1920 by Karen Clay, Warner Troeskin and Michael R. Haines reveals that infant mortality is a reliable indicator of median wages in an urban population. They found that cities that had an infant mortality rate that was one standard deviation above the mean, had wages that were 4.0 -5.4% lower than average.[76] They attributed most of this effect to the prevalence of lead pipes in some American cities during this time period. For reference, in 1897 approximately 67% of US cities were partially using lead in their piping systems.[76] Clay, Troeskin and Haines found a positive relationship between lead pipes and infant mortality rates in early American cities. In fact, between 1900 and 1920, 25% of the decrease in infant mortality can be attributed to decreased use of lead in pipes.[76]
Another contributing factor to this relationship between infant mortality and economic factors is demographics. Economic inequality has a lot to do with infant mortality in some US cities, both historically and today. While education is often linked to income, it can also be linked to infant mortality. Looking at recent data, fathers with no formal education saw an infant mortality rate that was twice the normal rate.[77] Over the period between 1912 and 1915, the Children’s Bureau examined data across eight cities and nearly 23,000 live births.[77] What they found was that income had a lot to do with infant mortality. If the father had no income, the rate of infant mortality was 357% more than that for the highest income earners ($1,250+).[77] As well, differences between races were apparent during this time period. African-American mothers experience an infant mortality at a rate 44% higher than average.[77]
While infant mortality is normally negatively correlated with GDP, there may indeed be some opposing short-term effects to a recession. A recent study by The Economist shows that economic slowdowns reduce the amount of air pollution, which results in a lower infant mortality rate. During the late 1970s and early 1980s, the recession’s impact on air quality is estimated to have saved around 1,300 US babies.[78] It is only during deep recessions that infant mortality increases. According to Norbert Schady and Marc-Francois Smitz, recessions where GDP per capita drops by 15% or more have a negative impact on infant mortality.[79]
While the historical link between infant mortality and wages is significant, infant mortality merely serves as an indicator for other variables such as lead poisoning, demographics and standard of living.
See also
- Diarrheal diseases
- Childlessness
- Rotavirus
- Pneumonia
- Pneumococcal disease
References
- ^ World Infant Mortality Rates in 2008 Population Reference Bureau
- ^ UNdata: Infant mortality rate (per 1,000 births)
- ^ Sullivan, Arthur; Steven M. Sheffrin (2003). Economics: Principles in action. Upper Saddle River, New Jersey 07458: Pearson Prentice Hall. pp. 474. ISBN 0-13-063085-3. http://www.pearsonschool.com/index.cfm?locator=PSZ3R9&PMDbSiteId=2781&PMDbSolutionId=6724&PMDbCategoryId=&PMDbProgramId=12881&level=4.
- ^ Gary King; Langche Zeng (July 2001). "Improving forecasts of state failure" (PDF). World Politics 53 (4): 623–658. doi:10.1353/wp.2001.0018. http://muse.jhu.edu/journals/world_politics/v053/53.4king02.pdf. Retrieved 2007-05-26.
- ^ Bernadine Healy (2006-09-24). "Behind the Baby Count". US News & World Report. http://health.usnews.com/usnews/health/articles/060924/2healy.htm. Retrieved 2007-06-25.
- ^ a b Bill Hendrick (2009-11-04). "Preemies Raise U.S. Infant Mortality Rate". WebMD. http://www.webmd.com/baby/news/20091103/preemies-raise-us-infant-mortality-rate. Retrieved 2009-11-04.
- ^ Gabriel Duc, "The crucial role of definition in perinatal epidemiology," Sozial- und Präventivmedizin/Social and Preventive Medicine, Vol. 40, No. 6 (November 1995): 357-360.
- ^ Definition of data collected in the European Union, see item 8
- ^ Mike Stobbe (2009-11-03). "Premature births worsen US infant death rate". Associated Press. http://www.google.com/hostednews/ap/article/ALeqM5gmPQMZ-AHwLe9mBCuGaXWve3F28wD9BO6LDG1. Retrieved 2009-11-04.
- ^ a b CDC (2009-11). "Behind International Rankings of Infant Mortality: How the United States Compares with Europe". Centers for Disease Control. http://www.cdc.gov/nchs/data/databriefs/db23.htm. Retrieved 2009-11-04.
- ^ Barbara A. Anderson; Brian D. Silver (December 1986). "Infant Mortality in the Soviet Union: regional differences and measurement issues". Population and Development Review (Population and Development Review, Vol. 12, No. 4) 12 (4): 705–737. doi:10.2307/1973432. JSTOR 1973432.
- ^ In 1990, the Baltic states moved to the WHO standard definition; in 1993 Russia also moved to this definition.
- ^ Alain Blum; Roland Pressat (November–December 1987). "Une nouvelle table de mortalité pour l'URSS (1984–1985)" (in French). Population 42 (6): 843–862. doi:10.2307/1532733. JSTOR 1532733. | N. Yu. Ksenofontova (1994). "Trends in infant mortality in the USSR". In W. Lutz; S. Scherbov; A. Volkov (eds.). Demographic Trends and Patterns in the Soviet Union before 1991. London: Routledge. pp. 359–378.
- ^ http://mdgs.un.org/unsd/mdg/Metadata.aspx?IndicatorId=0&SeriesId=562.
- ^ Ansley J. Coale; Judith Banister (December 1996). "Five decades of missing females in China". Proceedings of the American Philosophical Society 145 (4): 421–450. JSTOR 987286.
- ^ a b Krug, Etienne (2002). World Report on Violence and Health. Geneva: Geneva WHO. http://www.netlibrary.com.ezproxy1.lib.asu.edu/Reader/. Retrieved 2010-09-11.
- ^ Toole, Michael J.; Steven Galson, William Brady. "EBSCOhost: Are war and public health compatible?" (Academic Search Premier). EBSCOhost. http://web.ebscohost.com.ezproxy1.lib.asu.edu/ehost/detail?vid=2&hid=113&sid=99f5f8ca-cc59-46a3-b303-f5d476d453cc%40sessionmgr104&bdata=JnNpdGU9ZWhvc3QtbGl2ZQ%3d%3d#db=aph&AN=9305190119. Retrieved 2010-09-04.
- ^ Asling-Monemi, Kaja; Rodolfo PE√±a, Mary Carroll Ells berg, Lars Ake Person (2003). "Violence against women increases the risk of infant and child mortality: a case-referent study in Nicaragua". Bulletin of the World Health Organization 81 (1): 10–16. ISSN 0042-9686. PMC 2572309. PMID 12640470. http://www.ncbi.nlm.nih.gov.ezproxy1.lib.asu.edu/pubmed/12640470. Retrieved 2010-09-07.
- ^ Emenike, E; S Lawoko, K Dalal (2008-03). "Intimate partner violence and reproductive health of women in Kenya". International Nursing Review 55 (1): 97–102. doi:10.1111/j.1466-7657.2007.00580.x. ISSN 1466-7657. PMID 18275542. http://www.ncbi.nlm.nih.gov.ezproxy1.lib.asu.edu/pubmed/18275542. Retrieved 2010-09-07.
- ^ Jejeebhoy, Shireen J. (1998-09). "Associations between Wife-Beating and Fetal and Infant Death: Impressions from a Survey in Rural India". Studies in Family Planning 29 (3): 300–308. doi:10.2307/172276. ISSN 00393665. JSTOR 172276. PMID 9789323.
- ^ Fisher, Siobh√°n K. (1996-10). "Occupation of the Womb: Forced Impregnation as Genocide". Duke Law Journal 46 (1): 91–133. doi:10.2307/1372967. ISSN 00127086. JSTOR 1372967.
- ^ UNICEF, State of the World's Children 2003 infant mortality table
- ^ "Afghan medical college struggles to rise from the ashes". Reuters. 2008-05-06. http://www.reuters.com/article/healthNews/idUSISL1059520080506.
- ^ United Nations World Population Prospects report, for the period 2005-2010: 2006 revision – Table A.18, A.19
- ^ CIA World Factbook, last updated on April 2, 2009
- ^ Centers for Disease Control and Prevention --> QuickStats October 26, 2007 / 56(42);1115, in turn citing: Kung HC, Hoyert DL, Xu JQ, Murphy, SL. E-stat deaths: preliminary data for 2005 health E-stats. Hyattsville, MD: US Department of Health and Human Services, CDC; 2007. Available at http://www.cdc.gov/nchs/data/hestat/prelimdeaths05/preliminarydeaths05_tables.pdf#A
- ^ "NCHS State Profiles 2009: Alabama". Centers for Disease Control and Prevention. 2005. http://www.cdc.gov/nchs/pressroom/data/Alabama09.pdf. Retrieved 2010-04-09.
- ^ "NCHS State Profiles 2009: Alaska". Centers for Disease Control and Prevention. 2005. http://www.cdc.gov/nchs/pressroom/data/Alaska09.pdf. Retrieved 2010-04-09.
- ^ "NCHS State Profiles 2009: Arizona". Centers for Disease Control and Prevention. 2005. http://www.cdc.gov/nchs/pressroom/data/Arizona09.pdf. Retrieved 2010-04-09.
- ^ "NCHS State Profiles 2009: Arkansas". Centers for Disease Control and Prevention. 2005. http://www.cdc.gov/nchs/pressroom/data/Arkansas09.pdf. Retrieved 2010-04-09.
- ^ "NCHS State Profiles 2009: California". Centers for Disease Control and Prevention. 2005. http://www.cdc.gov/nchs/pressroom/data/California09.pdf. Retrieved 2010-04-09.
- ^ "NCHS State Profiles 2009: Colorado". Centers for Disease Control and Prevention. 2005. http://www.cdc.gov/nchs/pressroom/data/Colorado09.pdf. Retrieved 2010-04-09.
- ^ "NCHS State Profiles 2009: Connecticut". Centers for Disease Control and Prevention. 2005. http://www.cdc.gov/nchs/pressroom/data/Connecticut09.pdf. Retrieved 2010-04-09.
- ^ "NCHS State Profiles 2009: Delaware". Centers for Disease Control and Prevention. 2005. http://www.cdc.gov/nchs/pressroom/data/Delaware09.pdf. Retrieved 2010-04-09.
- ^ a b "US Census Bureau". http://www.census.gov/statab/ranks/rank17.html.
- ^ "NCHS State Profiles 2009: Florida". Centers for Disease Control and Prevention. 2005. http://www.cdc.gov/nchs/pressroom/data/Florida09.pdf. Retrieved 2010-04-09.
- ^ "NCHS State Profiles 2009: Georgia". Centers for Disease Control and Prevention. 2005. http://www.cdc.gov/nchs/pressroom/data/Georgia09.pdf. Retrieved 2010-04-09.
- ^ "NCHS State Profiles 2009: Hawaii". Centers for Disease Control and Prevention. 2005. http://www.cdc.gov/nchs/pressroom/data/Hawaii09.pdf. Retrieved 2010-04-09.
- ^ "NCHS State Profiles 2009: Idaho". Centers for Disease Control and Prevention. 2005. http://www.cdc.gov/nchs/pressroom/data/Idaho09.pdf. Retrieved 2010-04-09.
- ^ "NCHS State Profiles 2009: Illinois". Centers for Disease Control and Prevention. 2005. http://www.cdc.gov/nchs/pressroom/data/Illinois09.pdf. Retrieved 2010-04-09.
- ^ "NCHS State Profiles 2009: Indiana". Centers for Disease Control and Prevention. 2005. http://www.cdc.gov/nchs/pressroom/data/Indiana09.pdf. Retrieved 2010-04-09.
- ^ a b "NCHS State Profiles 2009: Iowa". Centers for Disease Control and Prevention. 2005. http://www.cdc.gov/nchs/pressroom/data/Iowa09.pdf. Retrieved 2010-04-09.
- ^ "NCHS State Profiles 2009: Kansas". Centers for Disease Control and Prevention. 2005. http://www.cdc.gov/nchs/pressroom/data/Kansas09.pdf. Retrieved 2010-04-09.
- ^ "NCHS State Profiles 2009: Kentucky". Centers for Disease Control and Prevention. 2005. http://www.cdc.gov/nchs/pressroom/data/Kentucky09.pdf. Retrieved 2010-04-09.
- ^ "NCHS State Profiles 2009: Louisiana". Centers for Disease Control and Prevention. 2005. http://www.cdc.gov/nchs/pressroom/data/Loisiana09.pdf. Retrieved 2010-04-09.
- ^ "NCHS State Profiles 2009: Maine". Centers for Disease Control and Prevention. 2005. http://www.cdc.gov/nchs/pressroom/data/Maine09.pdf. Retrieved 2010-04-09.
- ^ "NCHS State Profiles 2009: Maryland". Centers for Disease Control and Prevention. 2005. http://www.cdc.gov/nchs/pressroom/data/Maryland09.pdf. Retrieved 2010-04-09.
- ^ "NCHS State Profiles 2009: Massachusetts". Centers for Disease Control and Prevention. 2005. http://www.cdc.gov/nchs/pressroom/data/Massachusetts09.pdf. Retrieved 2010-04-09.
- ^ "NCHS State Profiles 2009: Michigan". Centers for Disease Control and Prevention. 2005. http://www.cdc.gov/nchs/pressroom/data/Michigan09.pdf. Retrieved 2010-04-09.
- ^ "NCHS State Profiles 2009: Minnesota". Centers for Disease Control and Prevention. 2005. http://www.cdc.gov/nchs/pressroom/data/Minnesota09.pdf. Retrieved 2010-04-09.
- ^ "NCHS State Profiles 2009: Mississippi". Centers for Disease Control and Prevention. 2005. http://www.cdc.gov/nchs/pressroom/data/MIssissippi09.pdf. Retrieved 2010-04-09.
- ^ "NCHS State Profiles 2009: Missouri". Centers for Disease Control and Prevention. 2005. http://www.cdc.gov/nchs/pressroom/data/Missouri09.pdf. Retrieved 2010-04-09.
- ^ "NCHS State Profiles 2009: Montana". Centers for Disease Control and Prevention. 2005. http://www.cdc.gov/nchs/pressroom/data/Montana09.pdf. Retrieved 2010-04-09.
- ^ "NCHS State Profiles 2009: Nebraska". Centers for Disease Control and Prevention. 2005. http://www.cdc.gov/nchs/pressroom/data/Nebraska09.pdf. Retrieved 2010-04-09.
- ^ "NCHS State Profiles 2009: New Hampshire". Centers for Disease Control and Prevention. 2005. http://www.cdc.gov/nchs/pressroom/data/NewHampshire09.pdf. Retrieved 2010-04-09.
- ^ "NCHS State Profiles 2009: New Jersey". Centers for Disease Control and Prevention. 2005. http://www.cdc.gov/nchs/pressroom/data/NewJersey09.pdf. Retrieved 2010-04-09.
- ^ "NCHS State Profiles 2009: New Mexico". Centers for Disease Control and Prevention. 2005. http://www.cdc.gov/nchs/pressroom/data/NewMexico09.pdf. Retrieved 2010-04-09.
- ^ "NCHS State Profiles 2009: New York". Centers for Disease Control and Prevention. 2005. http://www.cdc.gov/nchs/pressroom/data/NewYork09.pdf. Retrieved 2010-04-09.
- ^ "NCHS State Profiles 2009: North Carolina". Centers for Disease Control and Prevention. 2005. http://www.cdc.gov/nchs/pressroom/data/NorthCarolina09.pdf. Retrieved 2010-04-09.
- ^ "NCHS State Profiles 2009: North Dakota". Centers for Disease Control and Prevention. 2005. http://www.cdc.gov/nchs/pressroom/data/NorthDakota09.pdf. Retrieved 2010-04-09.
- ^ "NCHS State Profiles 2009: Ohio". Centers for Disease Control and Prevention. 2005. http://www.cdc.gov/nchs/pressroom/data/Ohio09.pdf. Retrieved 2010-04-09.
- ^ "NCHS State Profiles 2009: Oklahoma". Centers for Disease Control and Prevention. 2005. http://www.cdc.gov/nchs/pressroom/data/Oklahoma09.pdf. Retrieved 2010-04-09.
- ^ "NCHS State Profiles 2009: Oregon". Centers for Disease Control and Prevention. 2005. http://www.cdc.gov/nchs/pressroom/data/Oregon09.pdf. Retrieved 2010-04-09.
- ^ "NCHS State Profiles 2009: Pennsylvania". Centers for Disease Control and Prevention. 2005. http://www.cdc.gov/nchs/pressroom/data/Pennsylvania09.pdf. Retrieved 2010-04-09.
- ^ "NCHS State Profiles 2009: Rhode Island". Centers for Disease Control and Prevention. 2005. http://www.cdc.gov/nchs/pressroom/data/RhodeIsland09.pdf. Retrieved 2010-04-09.
- ^ "NCHS State Profiles 2009: South Carolina". Centers for Disease Control and Prevention. 2005. http://www.cdc.gov/nchs/pressroom/data/SouthCarolina09.pdf. Retrieved 2010-04-09.
- ^ "NCHS State Profiles 2009: South Dakota". Centers for Disease Control and Prevention. 2005. http://www.cdc.gov/nchs/pressroom/data/SouthDakota09.pdf. Retrieved 2010-04-09.
- ^ "NCHS State Profiles 2009: Tennessee". Centers for Disease Control and Prevention. 2005. http://www.cdc.gov/nchs/pressroom/data/Tennessee09.pdf. Retrieved 2010-04-09.
- ^ "NCHS State Profiles 2009: Texas". Centers for Disease Control and Prevention. 2005. http://www.cdc.gov/nchs/pressroom/data/Texas09.pdf. Retrieved 2010-04-09.
- ^ "NCHS State Profiles 2009: Utah". Centers for Disease Control and Prevention. 2005. http://www.cdc.gov/nchs/pressroom/data/Utah09.pdf. Retrieved 2010-04-09.
- ^ "NCHS State Profiles 2009: Vermont". Centers for Disease Control and Prevention. 2005. http://www.cdc.gov/nchs/pressroom/data/Vermont09.pdf. Retrieved 2010-04-09.
- ^ "NCHS State Profiles 2009: Virginia". Centers for Disease Control and Prevention. 2005. http://www.cdc.gov/nchs/pressroom/data/Virgina09.pdf. Retrieved 2010-04-09.
- ^ "NCHS State Profiles 2009: Washington". Centers for Disease Control and Prevention. 2005. http://www.cdc.gov/nchs/pressroom/data/Washington09.pdf. Retrieved 2010-04-09.
- ^ "NCHS State Profiles 2009: Wisconsin". Centers for Disease Control and Prevention. 2005. http://www.cdc.gov/nchs/pressroom/data/Wisconsin09.pdf. Retrieved 2010-04-09.
- ^ "NCHS State Profiles 2009: Wyoming". Centers for Disease Control and Prevention. 2005. http://www.cdc.gov/nchs/pressroom/data/Wyoming09.pdf. Retrieved 2010-04-09.
- ^ a b c http://www.nber.org/papers/w16480.pdf
- ^ a b c d http://www.nber.org/papers/w16133.pdf
- ^ The Economist. http://www.economist.com/research/articlesBySubject/displaystory.cfm?subjectid=7933604&story_id=13764868.
- ^ http://siteresources.worldbank.org/INTAFRICA/Resources/SchadySmitz_080509.pdf
External links
- The State of the World's Children 2008: Child Survival
- Infant mortality on the Children's Rights Portal
- Infant mortality rate - Country comparison
- The World Health Report 2005 – Make Every Mother and Child Count
- World Health Statistics - Probability of dying (per 1000) under age five years (under-5 mortality rate)
- World Health Statistics - Neonatal mortality rate (per 1000 live births)
- Born in Bradford - a 2006 UK-based research cohort study investigating the causes of infant mortality and low birth rate in Bradford, UK.
- State of the World's Mothers 2006 Up to date 2006 analysis of infant mortality rates published by Save the Children.
Certain conditions originating in the perinatal period / fetal disease (P, 760–779) Maternal factors and
complications of pregnancy,
labour and deliveryLength of gestation
and fetal growthSmall for gestational age/Large for gestational age · Preterm birth/Postmature birth · Intrauterine growth restrictionBirth trauma By system Vitamin K deficiency (Haemorrhagic disease of the newborn)HDN (ABO • Anti-Kell • Rh c • Rh D • Rh E) · Hydrops fetalis · Hyperbilirubinemia (Kernicterus, Neonatal jaundice)Integument and
temperature regulationErythema toxicum · Sclerema neonatorumInfectious Other Categories:- Population
- Infancy
- Demography
- Children and death


Wikimedia Foundation. 2010.