- Osmius
-
Osmius 
Osmius DesktopDeveloper(s) Peopleware SL Initial release July 14, 2006 Stable release 10.7 / July 23, 2010 Development status Active Written in C++, Java, Groovy Operating system Linux, Windows, Solaris Available in English, Spanish, French Type System monitoring, Business monitoring, KPI tracking Website osmius.com Osmius is a monitoring tool prepared to deal with thousands of devices, servers, applications and business indicators with incredible performance.[clarification needed] Osmius was designed from the beginning to offer both the technical and the business view of your systems so the user can see that Server "Moon" is down but also what Services and Applications are affected. Osmius keeps track of the state and availability of every component and check the Service Level Agreements regularly providing Business Intelligence and DataMining tools and Control Panels.
Contents
History
Osmius started as an idea from some of the final development team members to address the problem of 2000's monitoring tools:
- Hard to implement and difficult to understand.
- Privative tools were very expensive and closed to learn and to expand.
- Free Tools were too technical, complicated and based on heavy scripting.
- Documentation is expensive or incomplete (or non-existent).
- Few of them were Business Oriented and ITIL integrated tools.
After spending years in the monitoring career, it was clear that there is room and that there are needs about monitoring systems and services, and that an initially small team could design a new tool with these traits:
- Easy to understand. Few and powerful concepts.
- Easy to administer. No scattered scripting and no more lack of central management.
- Robust and scalable. Real time event processing and tiny footprints on the monitored "things".
- Business Oriented. SLA management, offering technical impact analysis as well as business views.
- Prepared to monitor KPIs whether they are CPU Load or number of sells in Michigan.
- Open: Open Source, open documentation.
- Professional: Support, development and consulting services.
In 2010 Osmius is a consolidated product with thousands of download from SourceForge.
Architecture
Osmius is a web based interface tool from which the user can manage the overall infrastructure that can be as simple as a single Central Osmius server, or use Master Agents from where monitor and administer monitoring and monitored platform.
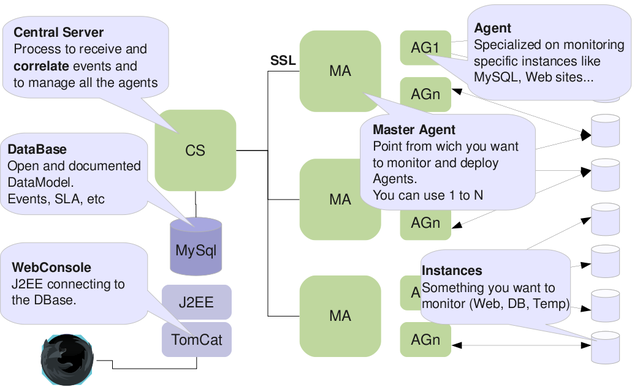
You can choose between intrusive (agent based) or external monitoring depending on your needs and restrictions. If any the connections with the agents are properly encrypted and there are process in the Central Server that deal with tasks such as sending new configuration parameters, prepare a server to monitor new systems or applications or to receive measurements in a robust and reliable way.
Osmius uses MySQL and the underlying storage engine (InnoDB) and is prepared to receive millions of events every day. Osmius implements a Round Robin Database policy so the user can apply event grouping as the data gets older and loose relevance.
New monitoring capabilities can be added creating user defined events or adding plug-ins to the platform, and there are modules to create new events based on current measures and to derive new data using statistical functions.
The Osmius Engine (agents, master agent and central processes) is based on the Adaptive Communication Environment (ACE).
Monitoring Capabilities
Osmius agents can monitor devices, systems and applications in Windows, Linux, Solaris and HP-UX and they normally rely on native APIs and connection pools to reduce footprints. Every Osmius agent can be configured to use "silent mode" to prevent network resources starvation and they are intelligent enough to recover lost from lost connections and even from process failures.
Operative systems
Linux: local and remote monitoring. Monitors uptime, system resource consumption, processes running state, resource consumption per process, filesystems, system temperature, network traffic.
Solaris: local monitoring. Monitors uptime, system resource consumption (cpu, memory, swap ...), processes and daemons running state, filesystems, users connected ...
Windows: local and remote monitoring. Monitors uptime, system resources consumption (cpu, memory, disk, virtual memory ... ), processes and services running state, Windows EventLog, network traffic, resources consumption per process, your own WMI queries
Databases
MS SQL Server: local and remote monitoring. Monitors memory used by database server, split pages, used space by log and data, locks, number of connections, free pages, batch request ...
MySQL: local and remote monitoring. Monitors connections, threads, network traffic, queries per second, locks, slow queries, uptime, open tables ...
Oracle: local and remote monitoring. Monitors availability, uptime, locks, connections, invalid objects, performance problems, extensions problems, used space, slow queries, tablespaces usage, data and instructions cache success percentage, cursor consumption ...
PostgreSQL: local and remote monitoring. Monitors availability, number of connections, percentage of maximum connections used and database size in Megabytes.
SNMP Devices
Osmius agent to obtain v1 and v2c SNMP variables and traps from any SNMP device.
In addition Osmius have a preconfigured agent to monitors generic CISCO routers.Osmius has Autodiscovery of new traps.
Applications
Apache: local and remote monitoring. Monitors availability, uptime, request and a lot of data from your Apache server.
Asterisk: local and remote monitoring. Using AMI monitors availability, uptime, extensions state and mailbox messages.
Exchange: local and remote monitoring. Monitors Exchange 2003 and 2007 performance counters such as connected users, queues size, delivered, sent and failed messages, RPC requests and latency.
IIS: local and remote monitoring. Monitors uptime, connections, network traffic, request types and IIS errors.
Tomcat: local and remote monitoring. Using JMX monitors availability, uptime, applications running state, deployment status, memory usage, threads, pending objects and processor usage.
Technologies
SSH: local and remote monitoring. Monitors any SSH able device and use your own commands.
WMI: local and remote monitoring. Monitors any Microsoft and Windows WMI application.
IP: ping time reply, service availability such us http, ftp, ssh, telnet, imap, pop3, smtp ... at any IP address.
IPMI: local and remote monitoring. Monitors availability, uptime and any data from IPMI able device sensors.
LOG: local monitoring. Monitors log file size and content using regular expressions.
WEB: local and remote monitoring. Monitors,with extraordinary performance, web availability, load time, transfer time, download size and content (using regular expressions) of any http or https source.
Performance
In order to guarantee Osmius scalability and its smooth running in data intensive installations Osmius is tested in high-performance-requirement environments. Over an Intel Core Duo 2.5 GHz:
- Process 1.500 events each minute.
- Store millions of measures.
- Monitor thousands of instances.
- Manage the SLAs of thousands of services.
- Desploy 1000 agents in 15 minutes aprox.
Releases
Osmius releases are numbered the same way as Ubuntu does. That is two figures for the year and the next two for the month.
Osmius 10.07 corresponds to July, 2010 release.
The Osmius development Team create a new version every month, but they are only made public twice a year, normally in January and July every year.
See also
External links
Categories:- Internet Protocol based network software
- Free software
- Multi-agent systems


Wikimedia Foundation. 2010.