- Optical resolution
-
This article is about optical resolution in optics. For the method of separating enantiomers in chemistry, see Chiral resolution.
Optical resolution describes the ability of an imaging system to resolve detail in the object that is being imaged.
An imaging system may have many individual components including a lens and recording and display components. Each of these contributes to the optical resolution of the system, as will the environment in which the imaging is done.
Contents
Lateral resolution
Two point sources radiate incoherently, the interaction of the separate object images can be described using intensity point spread functions and objects are resolved when the center of Airy disk from one overlaps the first dark ring in the diffraction pattern of the second:
R = 1.22λf# = 0.61λ/NA
where
- R is the resolution,
- λ is the wavelength of light,
- f# is the F-number
- and NA is the Numerical aperture
Lens resolution
The ability of a lens to resolve detail is usually determined by the quality of the lens but is ultimately limited by diffraction. Light coming from a point in the object diffracts through the lens aperture such that it forms a diffraction pattern in the image which has a central spot and surrounding bright rings, separated by dark nulls; this pattern is known as an Airy pattern, and the central bright lobe as an Airy disk. The angular radius of the Airy disk (measured from the center to the first null) is given by
-

where
- θ is the angular resolution,
- λ is the wavelength of light,
- and D is the diameter of the lens aperture.
Two adjacent points in the object give rise to two diffraction patterns. If the angular separation of the two points is significantly less than the Airy disk angular radius, then the two points cannot be resolved in the image, but if their angular separation is much greater than this, distinct images of the two points are formed and they can therefore be resolved. Rayleigh defined the somewhat arbitrary "Rayleigh criterion" that two points whose angular separation is equal to the Airy disk radius to first null can be considered to be resolved. It can be seen that the greater the diameter of the lens or its aperture, the greater the resolution. Astronomical telescopes have increasingly large lenses so they can 'see' ever finer detail in the stars.
Only the very highest quality lenses have diffraction limited resolution, however, and normally the quality of the lens limits its ability to resolve detail. This ability is expressed by the Optical Transfer Function which describes the spatial (angular) variation of the light signal as a function of spatial (angular) frequency. When the image is projected onto a flat plane, such as photographic film or a solid state detector, spatial frequency is the preferred domain, but when the image is referred to the lens alone, angular frequency is preferred. OTF may be broken down into the magnitude and phase components as follows:
where
- and (ξ,η) are spatial frequency in the x- and y-plane, respectively.
The OTF accounts for aberration, which the limiting frequency expression above does not. The magnitude is known as the Modulation Transfer Function (MTF) and the phase portion is known as the Phase Transfer Function (PTF).
In imaging systems, the phase component is typically not captured by the sensor. Thus, the important measure with respect to imaging systems is the MTF.
Phase is critically important to adaptive optics and holographic systems.
Sensor resolution (spatial)
Some optical sensors are designed to detect spatial differences in electromagnetic energy. These include photographic film, solid-state devices (CCD, CMOS detectors, and infrared detectors like PtSi and InSb), tube detectors (vidicon, plumbicon, and photomultiplier tubes used in night-vision devices), scanning detectors (mainly used for IR), pyroelectric detectors, and microbolometer detectors. The ability of such a detector to resolve those differences depends mostly on the size of the detecting elements.
Spatial resolution is typically expressed in line pairs per millimeter (lppmm), lines (of resolution, mostly for analog video), contrast vs. cycles/mm, or MTF (the modulus of OTF)). The MTF may be found by taking the two-dimensional Fourier transform of the spatial sampling function. Smaller pixels result in wider MTF curves and thus better detection of higher frequency energy.
This is analogous to taking the Fourier transform of a signal sampling function; as in that case, the dominant factor is the sampling period, which is analogous to the size of the picture element (pixel).
Other factors include pixel noise, pixel cross-talk, substrate penetration, and fill factor.
A common problem among non-technicians is the use of the number of pixels on the detector to describe the resolution. If all sensors were the same size, this would be acceptable. Since they are not, the use of the number of pixels can be misleading. For example, a 2 megapixel camera of 20 micrometre square pixels will have worse resolution than a 1 megapixel camera with 8 micrometre pixels, all else being equal.
For resolution measurement, film manufacturers typically publish a plot of Response (%) vs. Spatial Frequency (cycles per millimeter). The plot is derived experimentally. Solid state sensor and camera manufacturers normally publish specifications from which the user may derive a theoretical MTF according to the procedure outlined below. A few may also publish MTF curves, while others (especially intensifier manufacturers) will publish the response (%) at the Nyquist frequency, or, alternatively, publish the frequency at which the response is 50%.
To find a theoretical MTF curve for a sensor, it is necessary to know three characteristics of the sensor: the active sensing area, the area comprising the sensing area and the interconnection and support structures ("real estate"), and the total number of those areas (the pixel count). The total pixel count is almost always given. Sometimes the overall sensor dimensions are given, from which the real estate area can be calculated. Whether the real estate area is given or derived, if the active pixel area is not given, it may be derived from the real estate area and the fill factor, where fill factor is the ratio of the active area to the dedicated real estate area.
where
- the active area of the pixel has dimensions a×b
- the pixel real estate has dimensions c×d
In Gaskill's notation, the sensing area is a 2D comb(x, y) function of the distance between pixels (the pitch), convolved with a 2D rect(x, y) function of the active area of the pixel, bounded by a 2D rect(x, y) function of the overall sensor dimension. The Fourier transform of this is a
 function governed by the distance between pixels, convolved with a
  function governed by the number of pixels, and multiplied by the function corresponding to the active area. That last function serves as an overall envelope to the MTF function; so long as the number of pixels is much greater than one (1), then the active area size dominates the MTF.
Sampling function:
where the sensor has M×N pixels
Sensor resolution (temporal)
An imaging system running at 24 frames per second is essentially a discrete sampling system that samples a 2D area. The same limitations described by Nyquist apply to this system as to any signal sampling system.
All sensors have a characteristic time response. Film is limited at both the short resolution and the long resolution extremes by reciprocity breakdown. These are typically held to be anything longer than 1 second and shorter than 1/10,000 second. Furthermore, film requires a mechanical system to advance it through the exposure mechanism, or a moving optical system to expose it. These limit the speed at which successive frames may be exposed.
CCD and CMOS are the modern preferences for video sensors. CCD is speed-limited by the rate at which the charge can be moved from one site to another. CMOS has the advantage of having individually addressable cells, and this has led to its advantage in the high speed photography industry.
Vidicons, Plumbicons, and image intensifiers have specific applications. The speed at which they can be sampled depends upon the decay rate of the phosphor used. For example, the P46 phosphor has a decay time of less than 2 microseconds, while the P43 decay time is on the order of 2-3 milliseconds. The P43 is therefore unusable at frame rates above 1000 frames per second ( frame/s). See External links for links to phosphor information.
Pyroelectric detectors respond to changes in temperature. Therefore, a static scene will not be detected, so they require choppers. They also have a decay time, so the pyroelectric system temporal response will be a bandpass, while the other detectors discussed will be a lowpass.
If objects within the scene are in motion relative to the imaging system, the resulting motion blur will result in lower spatial resolution. Short integration times will minimize the blur, but integration times are limited by sensor sensitivity. Furthermore, motion between frames in motion pictures will impact digital movie compression schemes (e.g. MPEG-1, MPEG-2). Finally, there are sampling schemes that require real or apparent motion inside the camera (scanning mirrors, rolling shutters) that may result in incorrect rendering of image motion. Therefore, sensor sensitivity and other time-related factors will have a direct impact on spatial resolution.
Analog bandwidth effect on resolution
The spatial resolution of digital systems (e.g. HDTV and VGA) are fixed independently of the analog bandwidth because each pixel is digitized, transmitted, and stored as a discrete value. Digital cameras, recorders, and displays must be selected so that the resolution is identical from camera to display. However, in analog systems, the resolution of the camera, recorder, cabling, amplifiers, transmitters, receivers, and display may all be independent and the overall system resolution is governed by the bandwidth of the lowest performing component.
In analog systems, each horizontal line is transmitted as a high-frequency analog signal. Each picture element (pixel) is therefore converted to an analog electrical value (voltage), and changes in values between pixels therefore become changes in voltage. The transmission standards require that the sampling be done in a fixed time (outlined below), so more pixels per line becomes a requirement for more voltage changes per unit time, i.e. higher frequency. Since such signals are typically band-limited by cables, amplifiers, recorders, transmitters, and receivers, the band-limitation on the analog signal acts as an effective low-pass filter on the spatial resolution. The difference in resolutions between VHS (240 discernible lines per scanline), Betamax (280 lines), and the newer ED Beta format (500 lines) is explained primarily by the difference in the recording bandwidth.
In the NTSC transmission standard, each field contains 262.5 lines, and 59.94 fields are transmitted every second. Each line must therefore take 63 microseconds, 10.7 of which are for reset to the next line. Thus, the retrace rate is 15.734 kHz. For the picture to appear to have approximately the same horizontal and vertical resolution (see Kell factor), it should be able to display 228 cycles per line, requiring a bandwidth of 4.28 MHz. If the line (sensor) width is known, this may be converted directly into cycles per millimeter, the unit of spatial resolution.
B/G/I/K television system signals (usually used with PAL colour encoding) transmit frames less often (50 Hz), but the frame contains more lines and is wider, so bandwidth requirements are similar.
Note that a "discernible line" forms one half of a cycle (a cycle requires a dark and a light line), so "228 cycles" and "456 lines" are equivalent measures.
System resolution
There are two methods by which to determine system resolution. The first is to perform a series of two dimensional convolutions, first with the image and the lens, then the result of that procedure with the sensor, and so on through all of the components of the system. This is computationally expensive, and must be performed anew for each object to be imaged.


The other method is to transform each of the components of the system into the spatial frequency domain, and then to multiply the 2-D results. A system response may be determined without reference to an object. Although this method is considerably more difficult to comprehend conceptually, it becomes easier to use computationally, especially when different design iterations or imaged objects are to be tested.
The transformation to be used is the Fourier transform.


Ocular resolution
The human eye is a limiting feature of many systems, when the goal of the system is to present data to humans for processing.
For example, in a security or air traffic control function, the display and work station must be constructed so that average humans can detect problems and direct corrective measures. Other examples are when a human is using eyes to carry out a critical task such as flying (piloting by visual reference), driving a vehicle, and so forth.
The best visual acuity of the human eye at its optical centre (the fovea) is less than 1 arc minute per line pair, reducing rapidly away from the fovea.
The human brain requires more than just a line pair to understand what the eye is imaging. Johnson's Criteria defines the number of line pairs of ocular resolution, or sensor resolution, needed to recognize or identify an item.
Atmospheric resolution
Systems looking through long atmospheric paths may be limited by turbulence. A key measure of the quality of atmospheric turbulence is the seeing diameter, also known as Fried's seeing diameter. A path which is temporally coherent is known as an isoplanatic patch.
Large apertures may suffer from aperture averaging, the result of several paths being integrated into one image.
Turbulence scales with wavelength at approximately a 6/5 power. Thus, seeing is better at infrared wavelengths than at visible wavelengths.
Short exposures suffer from turbulence less than longer exposures due to the "inner" and "outer" scale turbulence; short is considered to be much less than 10 ms for visible imaging (typically, anything less than 2 ms). Inner scale turbulence arises due to the eddies in the turbulent flow, while outer scale turbulence arises from large air mass flow. These masses typically move slowly, and so are reduced by decreasing the integration period.
A system limited only by the quality of the optics is said to be diffraction-limited. However, since atmospheric turbulence is normally the limiting factor for visible systems looking through long atmospheric paths, most systems are turbulence-limited. Corrections can be made by using adaptive optics or post-processing techniques.
where
- ν is the spatial frequency
- λ is the wavelength
- f is the focal length
- D is the aperture diameter
- b is a constant (1 for far-field propagation)
- and r0 is Fried's seeing diameter
Super resolution
Discussion of super-resolution, multi-frame blind deconvolution, and other methods.
Measuring optical resolution
A variety of measurement systems are available, and use may depend upon the system being tested.
Typical test charts for Contrast Transfer Function (CTF) consist of repeated bar patterns (see Discussion below). The limiting resolution is measured by determining the smallest group of bars, both vertically and horizontally, for which the correct number of bars can be seen. By calculating the contrast between the black and white areas at several different frequencies, however, points of the CTF can be determined with the contrast equation.

where
- Cmax is the normalized value of the maximum (for example, the voltage or grey value of the white area)
- Cmin is the normalized value of the minimum (for example, the voltage or grey value of the black area)
When the system can no longer resolve the bars, the black and white areas have the same value, so Contrast = 0. At very low spatial frequencies, Cmax = 1 and Cmin = 0 so Modulation = 1. Some modulation may be seen above the limiting resolution; these may be aliased and phase-reversed.
When using other methods, including the interferogram, sinusoid, and the edge in the ISO 12233 target, it is possible to compute the entire MTF curve. The response to the edge is similar to a step response, and the Fourier Transform of the first difference of the step response yields the MTF.
Interferogram
An interferogram created between two coherent light sources may be used for at least two resolution-related purposes. The first is to determine the quality of a lens system (see LUPI), and the second is to project a pattern onto a sensor (especially photographic film) to measure resolution.
NBS 1010a/ ISO #2 target
This 5 bar resolution test chart is often used for evaluation of microfilm systems and scanners. It is convenient for a 1:1 range (typically covering 1-18 cycles/mm) and is marked directly in cycles/mm. Details can be found in ISO-3334.
USAF 1951 target
 SilverFast Resolution Target USAF 1951 for determining a scanner's optimum resolution
The USAF 1951 resolution test target consists of a pattern of 3 bar targets. Often found covering a range of 0.25 to 228 cycles/mm. Each group consists of six elements. The group is designated by a group number (-2, -1, 0, 1, 2, etc.) which is the power to which 2 should be raised to obtain the spatial frequency of the first element (e.g., group -2 is 0.25 line pairs per millimeter). Each element is the 6th root of 2 smaller than the preceding element in the group (e.g. element 1 is 2^0, element 2 is 2^(-1/6), element 3 is 2(-1/3), etc.). By reading off the group and element number of the first element which cannot be resolved, the limiting resolution may be determined by inspection. The complex numbering system and use of a look-up chart can be avoided by use of a newer layout chart, which labels the groups directly in cycles/mm and is available in the links below from Applied Image.

NBS 1952 target
The NBS 1952 target is a 3 bar pattern (long bars). The spatial frequency is printed alongside each triple bar set, so the limiting resolution may be determined by inspection. This frequency is normally only as marked after the chart has been reduced in size (typically 25 times). The original application called for placing the chart at a distance 26 times the focal length of the imaging lens used. The bars above and to the left are in sequence, separated by approximately the square root of two (12, 17, 24, etc.), while the bars below and to the left have the same separation but a different starting point (14, 20, 28, etc.)
EIA 1956 video resolution target
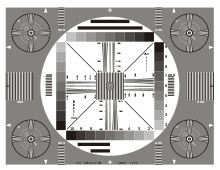 EIA 1956 video resolution target
The EIA 1956 resolution target was specifically designed to be used with television systems. The gradually expanding lines near the center are marked with periodic indications of the corresponding spatial frequency. The limiting resolution may be determined by inspection. The most important measure is the limiting horizontal resolution, since the vertical resolution is typically determined by the applicable video standard (I/B/G/K/NTSC/NTSC-J).
IEEE Std 208-1995 target
The IEEE 208-1995 resolution target is similar to the EIA target. Resolution is measured in horizontal and vertical TV lines.
ISO 12233 target
The ISO 12233 target was developed for digital camera applications, since modern digital camera spatial resolution may exceed the limitations of the older targets. It includes several knife-edge targets for the purpose of computing MTF by Fourier Transform. They are offset from the vertical by 5 degrees so that the edges will be sampled in many different phases, which allow estimation of the spatial frequency response beyond the Nyquist frequency of the sampling.
Random test patterns
The idea is analogous to the use of a white noise pattern in acoustics to determine system frequency response.
Monotonically increasing sinusoid patterns
The interferogram used to measure film resolution can be synthesized on personal computers and used to generate a pattern for measuring optical resolution. See especially Kodak MTF curves.
Multiburst
A multiburst signal is an electronic waveform used to test analog transmission, recording, and display systems. The test pattern consists of several short periods of specific frequencies. The contrast of each may be measured by inspection and recorded, giving a plot of attenuation vs. frequency. The NTSC3.58 multiburst pattern consists of 500 kHz, 1 MHz, 2 MHz, 3 MHz, and 3.58 MHz blocks. 3.58 MHz is important because it is the chrominance frequency for NTSC video.
Discussion
It should be noted whenever using a bar target that the resulting measure is the Contrast Transfer Function (CTF) and not the MTF. The difference arises from the subharmonics of the square waves and can be easily computed.
See also
- Image resolution, in computing
- Minimum resolvable contrast
- Siemens star, a pattern used for resolution testing
- Square meters per pixel
- Superlens
References
- Gaskill, Jack D. (1978), Linear Systems, Fourier Transforms, and Optics, Wiley-Interscience. ISBN 0-471-29288-5
- Goodman, Joseph W. (2004), Introduction to Fourier Optics (Third Edition), Roberts & Company Publishers. ISBN 0-9747077-2-4
- Fried, David L. (1966), "Optical resolution through a randomly inhomogeneous medium for very long and very short exposures.", J. Opt. Soc. Amer. 56:1372-9
- Robin, Michael, and Poulin, Michael (2000), Digital Television Fundamentals (2nd edition), McGraw-Hill Professional. ISBN 0-07-135581-2
- Smith, Warren J. (2000), Modern Optical Engineering (Third Edition), McGraw-Hill Professional. ISBN 0-07-136360-2
- Accetta, J. S. and Shumaker, D. L. (1993), The Infrared and Electro-optical Systems Handbook, SPIE/ERIM. ISBN 0-8194-1072-1
- Roggemann, Michael and Welsh, Byron (1996), Imaging Through Turbulence, CRC Press. ISBN 0-8493-3787-9
- Tatarski, V. I. (1961), Wave Propagation in a Turbulent Medium, McGraw-Hill, NY
External links
- Norman Koren's website includes several downloadable test patterns
- UC Santa Cruz Prof. Claire Max's lectures and notes from Astronomy 289C, Adaptive Optics
- George Ou re-created the EIA 1956 chart from a high-resolution scan.
- Do Sensors “Outresolve” Lenses?; on lens and sensor resolution interaction.
Categories:


![\mathbf{S}(x,y) =
\left[\operatorname{comb}\left(\frac{x}{c},\frac{y}{d}\right) *
\operatorname{rect}\left(\frac{x}{a}, \frac{y}{b}\right)\right] \cdot
\operatorname{rect}\left(\frac{x}{M \cdot c}, \frac{y}{N \cdot d}\right)](6/2d6992d57542c7b5d66d9e35b7876bf5.png)


![=[\operatorname{sinc}((M\cdot c) \cdot \xi, (N \cdot d)\cdot\eta) *
\operatorname{comb}(c \cdot \xi, d \cdot \eta)] \cdot
\operatorname{sinc}(a \cdot \xi, b \cdot \eta)](a/fda2cd0955736ec1b91aeccd77f8a734.png)
![\operatorname{MTF}_s(\nu)= e^{-3.44 \cdot (\lambda f \nu /r_0)^{5/3} \cdot [1-b \cdot (\lambda f \nu /D)^{1/3}]}](5/a85f8e916159b5ce2bcb44dbca9debaf.png)

Wikimedia Foundation. 2010.