- North West Leicestershire (UK Parliament constituency)
-
North West Leicestershire County constituency for the House of Commons 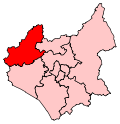
Boundary of North West Leicestershire in Leicestershire.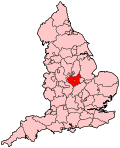
Location of Leicestershire within England.County Leicestershire Electorate 72,022 (December 2010)[1] Current constituency Created 1983 Member of Parliament Andrew Bridgen (Conservative) Number of members One Created from Bosworth and Loughborough Overlaps European Parliament constituency East Midlands North West Leicestershire is a county constituency represented in the House of Commons of the Parliament of the United Kingdom. It elects one Member of Parliament (MP) by the first-past-the-post system of election.
Contents
Boundaries
North West Leicestershire constituency was created in 1983 from parts of the seats of Bosworth and Loughborough. It covers the same area as the North West Leicestershire district in the East Midlands. A key marginal seat with the main population centres being Coalville and Ashby-de-la-Zouch, it is divided between Labour-voting former mining areas, and Conservative-inclined rural villages.
Members of Parliament
The constituency was won in 1983 by the Conservative David Ashby. He stood down in 1997 when the seat was won by Labour's David Taylor, who held the seat until he died of a heart attack in December 2009. Taylor had already announced he would stand down at the 2010 general election. With the next election being held on 6 May 2010, it was not considered feasible to arrange a by-election. The 2010 election saw Andrew Bridgen take the seat for the Conservatives with a swing of 12% from Labour to the Conservatives, resulting in a majority of 7,511 or 14.5% of the total votes cast.
Election Member [2] Party 1983 David Ashby Conservative 1997 David Taylor Labour Co-op 2010 Andrew Bridgen Conservative Elections
Elections in the 2010s
General Election 2010: North West Leicestershire[3] Party Candidate Votes % ±% Conservative Andrew Bridgen 23,147 44.6 +8.6 Labour Ross Willmott 15,636 30.1 -15.4 Liberal Democrat Paul Reynolds 8,639 16.6 +4.6 BNP Ian Meller 3,396 6.5 +3.4 UKIP Martin Green 1,134 2.2 -1.1 Majority 7,511 14.5 Turnout 51,952 72.9 +6.1 Conservative gain from Labour Swing 12.0 Elections in the 2000s
General Election 2005: North West Leicestershire[4] Party Candidate Votes % ±% Labour Co-op David Taylor 21,449 45.5 −6.6 Conservative Nicola Le Page 16,972 36.0 +2.1 Liberal Democrat Rod Keys 5,682 12.1 +1.8 UKIP John Blunt 1,563 3.3 +1.0 BNP Clive Potter 1,474 3.1 N/A Majority 4,477 9.5 Turnout 47,140 66.8 +1.0 Labour Co-op hold Swing −4.4 General Election 2001: North West Leicestershire Party Candidate Votes % ±% Labour Co-op David Taylor 23,431 52.1 -4.3 Conservative Nick Weston 15,274 33.9 +2.9 Liberal Democrat Charlie Fraser-Fleming 4,651 10.3 +1.7 UKIP William Nattrass 1,021 2.3 N/A Independent Robert Nettleton 632 1.4 N/A Majority 8,157 19.0 Turnout 43,219 60.9 -2.2 Labour Co-op hold Swing Elections in the 1990s
General Election 1997: North West Leicestershire Party Candidate Votes % ±% Labour Co-op David Taylor 29,332 56.4 Conservative Robert Goodwill 16,113 31.0 Liberal Democrat Stan Heptinstall 4,492 8.6 Referendum Party M Abney-Hastings 2,008 4.0 Majority 13,219 25.4 Turnout 51,945 Labour Co-op gain from Conservative Swing General Election 1992: Leicestershire North West[5] Party Candidate Votes % ±% Conservative David Ashby 28,379 45.5 −2.1 Labour David Taylor 27,400 43.9 +9.7 Liberal Democrat JWR Beckett 6,353 10.2 −7.0 Natural Law DJ Fawcett 229 0.4 +0.4 Majority 979 1.6 −11.8 Turnout 62,361 86.1 +3.3 Conservative hold Swing −5.9 See also
Notes and references
- ^ "Electorate Figures - Boundary Commission for England". 2011 Electorate Figures. Boundary Commission for England. 4 March 2011. http://www.boundarycommissionforengland.org.uk/electoral-figures/electoral-figures.htm. Retrieved 13 March 2011.
- ^ Leigh Rayment's Historical List of MPs – Constituencies beginning with "L" (part 2)
- ^ North West Leicestershire general election, 2010 results, UKPollingReport
- ^ North West Leicestershire general election, 2005 results, North West Leicestershire District Council
- ^ "Politics Resources". Election 1992. Politics Resources. 9 April 1992. http://www.politicsresources.net/area/uk/ge92/ge92index.htm. Retrieved 2010-12-06.
Constituencies in the East Midlands (46) Conservative (31) Amber Valley · Boston and Skegness · Bosworth · Broxtowe · Charnwood · Corby · Daventry · Derbyshire Dales · Erewash · Gainsborough · Grantham and Stamford · Harborough · High Peak · Kettering · Lincoln · Loughborough · Louth and Horncastle · Mid Derbyshire · Newark · Northampton North · Northampton South · North West Leicestershire · Rushcliffe · Rutland and Melton · Sherwood · Sleaford and North Hykeham · South Derbyshire · South Holland and The Deepings · South Leicestershire · South Northamptonshire · Wellingborough
Labour (15) East Midlands European constituency: Conservative (2) · Labour (1) · UKIP (1) · Liberal Democrats (1) Categories:- Parliamentary constituencies in Leicestershire
- United Kingdom Parliamentary constituencies established in 1983


Wikimedia Foundation. 2010.