- Demographics of Serbia
-
The demographics of Serbia have been shaped by its unique geographic location. Situated in the middle of the Balkans, many different ethnic groups are citizens of Serbia. Serbs are overwhelmingly the largest ethnic group in the country. Furthermore, Albanians have represented the largest minority group in modern Serbia. Other important ethnic groups by size include Hungarians, Bosniaks, Roma, Croats, Slovaks, Bulgarians, Romanians. Furthermore, with over 25 different national communities Vojvodina, Serbias northern region is one of the most ethnically diverse territories in Europe.[citation needed]
The two provinces of Vojvodina and Kosovo, have a sizable minority groups. Hungarians in Vojvodina are mainly Catholic stemming from the Austria-Hungary influence while Albanians in Kosovo are mainly Muslim stemming from the Ottoman Empire influence.
Contents
Statistics
1900-1912
- Source:[1]
Average population (x 1,000) Live births Deaths Natural change Crude birth rate (per 1,000) Crude death rate (per 1,000) Natural change (per 1,000) 1900 2,470 105,000 58,000 47,000 42.4 23.5 18.9 1901 2,520 96,000 53,000 43,000 38.0 21.0 17.0 1902 2,570 98,000 57,000 41,000 38.0 22.3 15.7 1903 2,580 106,000 60,000 46,000 40.9 23.5 17.4 1904 2,650 106,000 56,000 50,000 39.8 21.1 18.7 1905 2,660 100,000 65,000 35,000 37.3 24.8 2.5 1906 2,690 113,000 66,000 47,000 42.0 24.5 17.5 1907 2,770 111,000 62,000 49,000 40.0 22.4 17.6 1908 2,820 104,000 67,000 37,000 36.8 23.7 13.1 1909 2,840 110,000 83,000 27,000 38.7 29.3 9.4 1910 2,870 112,000 64,000 48,000 39.0 22.4 16.6 1911 2,940 107,000 64,000 43,000 36.3 21.8 14.5 1912 2,980 114,000 63,000 51,000 38.3 21.1 17.1 1950-2010
- Source:[2]
Average population (x 1000) Live births Deaths Natural change Crude birth rate (per 1000) Crude death rate (per 1000) Natural change (per 1000) 1950 5 970 163 297 76 851 86 446 27.4 12.9 14.5 1951 6 042 145 197 80 034 65 163 24.0 13.2 10.8 1952 6 112 161 306 67 870 93 436 26.4 11.1 15.3 1953 6 188 151 672 68 168 83 504 24.5 11.0 13.5 1954 6 274 152 569 62 610 89 959 24.3 10.0 14.3 1955 6 358 140 396 65 179 75 217 22.1 10.3 11.8 1956 6 425 132 078 67 055 65 023 20.6 10.4 10.1 1957 6 481 118 535 64 885 53 650 18.3 10.0 8.3 1958 6 535 118 425 55 564 62 861 18.1 8.5 9.6 1959 6 585 114 872 60 850 54 022 17.4 9.2 8.2 1960 6 635 119 298 61 872 57 426 18.0 9.3 8.7 1961 6 693 115 222 57 990 57 232 17.2 8.7 8.6 1962 6 752 110 008 62 830 47 178 16.3 9.3 7.0 1963 6 809 108 324 57 778 50 546 15.9 8.5 7.4 1964 6 863 103 847 62 100 41 747 15.1 9.0 6.1 1965 6 916 106 699 58 856 47 843 15.4 8.5 6.9 1966 6 974 103 775 55 471 48 304 14.9 8.0 6.9 1967 7 027 103 491 62 915 40 576 14.7 9.0 5.8 1968 7 078 103 621 60 932 42 689 14.6 8.6 6.0 1969 7 127 105 478 68 152 37 326 14.8 9.6 5.2 1970 7 171 102 453 67 211 35 242 14.3 9.4 4.9 1971 7 214 104 070 65 872 38 198 14.4 9.1 5.3 1972 7 258 106 859 70 822 36 037 14.7 9.8 5.0 1973 7 303 108 361 67 152 41 209 14.8 9.2 5.6 1974 7 351 110 458 66 457 44 001 15.0 9.0 6.0 1975 7 401 112 945 69 590 43 355 15.3 9.4 5.9 1976 7 452 114 035 68 565 45 470 15.3 9.2 6.1 1977 7 503 111 510 68 924 42 586 14.9 9.2 5.7 1978 7 550 110 622 71 986 38 636 14.7 9.5 5.1 1979 7 611 109 953 72 306 37 647 14.4 9.5 4.9 1980 7 688 109 597 76 180 33 417 14.3 9.9 4.3 1981 7 729 103 407 78 086 25 321 13.4 10.1 3.3 1982 7 738 106 575 78 473 28 102 13.8 10.1 3.6 1983 7 747 108 003 83 506 24 497 13.9 10.8 3.2 1984 7 754 107 036 82 742 24 294 13.8 10.7 3.1 1985 7 759 101 938 81 836 20 102 13.1 10.5 2.6 1986 7 759 99 419 83 977 15 442 12.8 10.8 2.0 1987 7 757 98 279 83 426 14 853 12.7 10.8 1.9 1988 7 755 97 471 83 616 13 855 12.6 10.8 1.8 1989 7 773 91 270 85 256 6 014 11.7 11.0 0.8 1990 7 806 90 590 85 932 4 658 11.6 11.0 0.6 1991 7 836 90 378 89 072 1 306 11.5 11.4 0.2 1992 7 852 86 877 93 475 -6 598 11.1 11.9 -0.8 1993 7 848 87 931 95 121 -7 190 11.2 12.1 -0.9 1994 7 843 85 292 93 011 -7 719 10.9 11.9 -1.0 1995 7 837 86 236 93 933 -7 697 11.0 12.0 -1.0 1996 7 828 82 548 98 370 -15 822 10.5 12.6 -2.0 1997 7 831 79 716 98 068 -18 352 10.2 12.5 -2.3 1998 7 568 76 330 99 376 -23 046 10.1 13.1 -3.0 1999 7 540 72 222 101 444 -29 222 9.6 13.5 -3.9 2000 7 516 73 764 104 042 -30 278 9.8 13.8 -4.0 2001 7 503 78 435 99 008 -20 573 10.5 13.2 -2.7 2002 7 500 78 101 102 785 -24 684 10.4 13.7 -3.3 2003 7 481 79 025 103 946 -24 921 10.6 13.9 -3.3 2004 7 463 78 186 104 320 -26 134 10.5 14.0 -3.5 2005 7 441 72 180 106 771 -34 591 9.7 14.3 -4.6 2006 7 412 70 997 102 884 -31 887 9.6 13.9 -4.3 2007 7 382 68 102 102 805 -34 703 9.2 13.9 -4.7 2008 7 350 69 083 102 711 -33 628 9.4 14.0 -4.6 2009 7 321 70 299 104 000 -33 701 9.6 14.2 -4.6 2010 7 291 68 304 103 211 -34 907 9.4 14.2 -4.8 p - preliminary results
Current ethnic composition
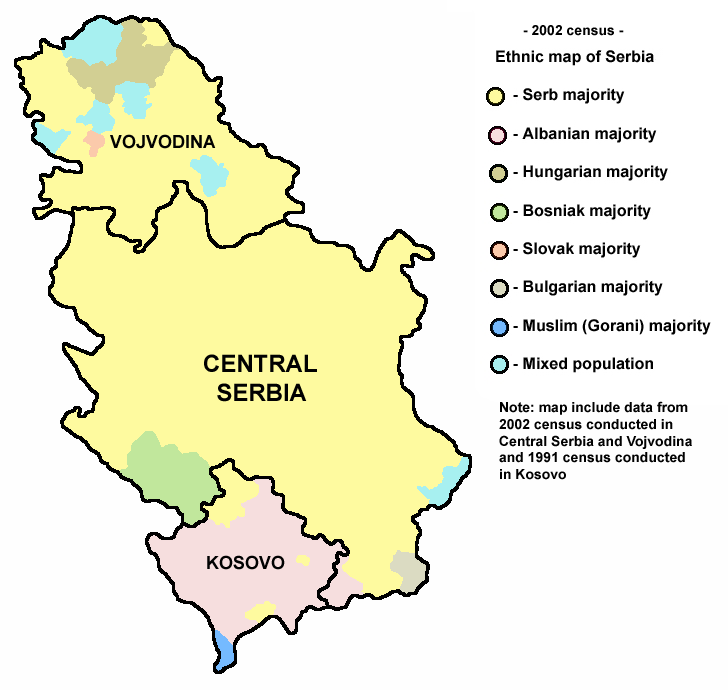
 Ethnic map of Serbia, based on municipality data

Serbia has a mixed population that varies in the three regions, Kosovo, Vojvodina and Central Serbia. Serbs are the largest ethnic group in Central Serbia and Vojvodina while they are a minority in Kosovo. In Central Serbia, Serbs represents 89.5 percent of the population, and Bosniaks are the second largest minority with 2.5 percent, followed by the Roma and Albanians. In Vojvodina, Serbs represent 65 percent of the population while Hungarians are the second largest ethnic group, representing 14% of provincial population. Kosovo is mainly populated by ethnic Albanians who make up 87 percent of the population. Serbs are the second largest ethnic group in Kosovo with 7 percent of the population, while Gorani, Roma, and Turks, represents six percent of the population combined.
Composition of Central Serbia and Vojvodina
Population of Central Serbia and Vojvodina according to ethnic group 1948-2002 Ethnic
groupcensus 1948 census 1953 census 1961 census 1971 census 1981 census 1991 census 2002[3] Number % Number % Number % Number % Number % Number % Number % Serbs 4,651,819 80.2 4,963,070 80.4 5,477,670 82.0 5,788,547 80.4 5,972,661 77.3 6,616,917 80.3 6,212,838 82.9 Croats 164,574 2.8 167,045 2.7 189,158 2.8 176,649 2.5 140,650 1.8 9412443 1.2 70,602 0.9 Montenegrins 46,810 0.8 54,718 0.9 67,165 1.0 93,705 1.3 120,438 1.6 117,761 1.6 69,049 0.9 Yugoslavs 14,873 0.2 122,904 1.7 439,265 5.7 312,595 4.1 80,721 1.1 Muslims 7,636 0.1 74,840 1.2 85,441 1.3 127,973 1.8 156,604 2.0 176,401 2.3 19,503 0.3 Bosniacs 136,087 1.8 Hungarians 433,618 7.5 441,748 7.2 449,377 6.7 430,145 6.0 390,321 5.0 337,479 4.5 293,299 3.9 Romani 40,951 0.7 46,896 0.8 6,624 0.1 35,301 0.5 76,833 1.0 90,853 1.2 108,193 1.4 Slovaks 73,138 1.3 75,006 1.2 77,816 1.2 76,707 1.1 73,170 0.9 65,363 0.9 59,021 0.8 Albanians 33,769 0.6 40,954 0.7 53,167 0.8 68,593 1.0 76,296 1.0 74,303 1.0 61,647 0.8 Vlachs 93,440 1.6 28,047 0.5 1,367 0.0 14,719 0.2 25,592 0.3 15,675 0.2 40,054 0.5 Romanians 63,112 1.1 59,689 1.0 59,492 0.9 57,399 0.8 53,676 0.7 37,818 0.5 34,576 0.5 Macedonians 17,391 0.3 26,302 0.4 35,146 0.5 41,627 0.6 47,930 0.6 44,028 0.6 25,847 0.3 Bulgarians 59,395 1.0 60,146 1.0 58,243 0.9 53,536 0.7 33,294 0.4 26,416 0.3 20,497 0.3 Others/undeclared 114,493 2.0 132,549 2.1 102,700 1.5 115,093 1.6 122,506 1.6 97,953 1.3 266,067 3.5 Total 5,800,146 6,171,013 6,678,239 7,202,898 7,729,236 7,552,806 7,498,001 The ethnic composition of Central Serbia and Vojvodina, according to the 2002 census:
Serbia (excluding Kosovo) Central Serbia Vojvodina Number % Number % Number % TOTAL 7,498,001 100 5,466,009 100 2,031,992 100 Serbs 6,212,838 82.86 4,891,031 89.48 1,321,807 65.05 Montenegrins 69,049 0.92 33,536 0.61 35,513 1.75 Yugoslavs 80,721 1.08 30,840 0.56 49,881 2.45 Albanians 61,647 0.82 59,952 1.1 1,695 0.08 Bosniaks 136,087 1.82 135,670 2.48 417 0.02 Bulgarians 20,497 0.27 18,839 0.34 1,658 0.08 Bunjevci 20,012 0.27 246 0 19,766 0.97 Gorani 4,581 0.06 3,975 0.07 606 0.03 Croats 70,602 0.94 14,056 0.26 56,546 2.78 Macedonians 25,847 0.35 14,062 0.26 11,785 0.58 Muslims (by nationality) 19,503 0.26 15,869 0.29 3,634 0.18 Roma and Sinti 108,193 1.44 79,136 1.45 29,057 1.43 Vlachs of Serbia 40,054 0.53 39,953 0.73 101 0 Romanians of Serbia 34,576 0.46 4,157 0.08 30,419 1.5 Germans 3,901 0.05 747 0.01 3,154 0.16 Ruthenes 15,905 0.21 279 0.01 15,626 0.77 Russians 2,588 0.03 1,648 0.03 940 0.05 Slovaks 59,021 0.79 2,384 0.04 56,637 2.79 Slovenes 5,104 0.07 3,099 0.06 2,005 0.1 Czechs 2,211 0.03 563 0.01 1,648 0.08 Ukrainians 5,354 0.07 719 0.01 4,635 0.23 Hungarians 293,299 3.91 3,092 0.06 290,207 14.28 Others (i.e. Armenians, Serbian Jews, Greeks, Turks and Egyptians). 11,711 0.16 6,400 0.12 5,311 0.26 Unspecified 107,732 1.44 52,716 0.97 55,016 2.71 Unknown 75,483 1.01 51,709 0.95 23,774 1.17 Current religious composition
Demographic statistics
Main article: Census in SerbiaThe following demographic statistics are from the CIA World Factbook, unless otherwise indicated.
Current population
9,200,000 (including Kosovo) (2010 est.)
Median age
- total: 41.1 years
- male: 39.4 years
- female: 42.9 years
Life expectancy at birth
- total population: 75.3 years
- male: 71.26 years
- female: 77.1 years
Total fertility rate
1.4 children born/woman (2011 est.)
Nationality
- noun: Serbian(s)
- adjective: Serbian
Religions
(2002 census)
- Christianity
- Eastern Orthodoxy — 84.1%
- Roman Catholicism — 6.24%
- Protestantism — 1.44%
- Islam — 4.82%
Languages
- Official: Serbian (official nationwide)
Literacy
(includes data for Montenegro)
definition: age 15 and over can read and write
- total population: 96.4%
- male: 98.9%
- female: 94.1% (2002 est.)
See also
- Demographic history of Serbia
- Demographic history of Vojvodina
- Demographic history of Kosovo
References
- ^ B.R. Mitchell. European historical statistics. 1750-1975.
- ^ Institut national d'études démographique (INED)
- ^ Official Results of Serbian Census 2003–PopulationPDF (441 KiB), pp. 12-13 (Serbian)
- Statistical Office of Serbia (2003) (in Serbian) (PDF). Србија у бројкама 2003.. Belgrade: Statistical Office of Serbia. http://webrzs.stat.gov.rs/Pod/srb2003s.pdf. Retrieved 2007-07-25.
Ethnic groups in Serbia Central Serbia Serbs · Albanians · Bosniaks · Ethnic Muslims · Bulgarians · Croats · Macedonians · Montenegrins · Roma · Romanians (Vlachs) · YugoslavsVojvodina Banat Bulgarians · Bunjevci · Croats (Šokci) · Germans (Danube Swabians and Banat Swabians) · Hungarians (Szekelys) · Montenegrins · Macedonians · Pannonian Rusyns · Roma · Serbs · Slovaks · Yugoslavs · Romanians · Czechs · Slovenes · Gorani people · Ukrainians · Albanians · RussiansKosovo[a] ^a Kosovo is the subject of a territorial dispute between the Republic of Serbia and the self-proclaimed Republic of Kosovo. The latter declared independence on 17 February 2008, while Serbia claims it as part of its own sovereign territory. Its independence is recognised by 85 UN member states.Demographics of Europe Sovereign
states- Albania
- Andorra
- Armenia
- Austria
- Azerbaijan
- Belarus
- Belgium
- Bosnia and Herzegovina
- Bulgaria
- Croatia
- Cyprus
- Czech Republic
- Denmark
- Estonia
- Finland
- France
- Georgia
- Germany
- Greece
- Hungary
- Iceland
- Ireland
- Italy
- Kazakhstan
- Latvia
- Liechtenstein
- Lithuania
- Luxembourg
- Macedonia
- Malta
- Moldova
- Monaco
- Montenegro
- Netherlands
- Norway
- Poland
- Portugal
- Romania
- Russia
- San Marino
- Serbia
- Slovakia
- Slovenia
- Spain
- Sweden
- Switzerland
- Turkey
- Ukraine
- United Kingdom
- (England
- Northern Ireland
- Scotland
- Wales)
- Vatican City
States with limited
recognition- Abkhazia
- Kosovo
- Nagorno-Karabakh
- Northern Cyprus
- South Ossetia
- Transnistria
Dependencies
and other territories- Åland
- Faroe Islands
- Gibraltar
- Guernsey
- Jan Mayen
- Jersey
- Isle of Man
- Svalbard
Other entities - European Union
Categories:- Serbian society
- Demographics of Serbia

Wikimedia Foundation. 2010.