- Convective storm detection
-
Convective storm detection is the meteorological observation of deep, moist convection (DMC) and consists of detection, monitoring, and short-term prediction. This term includes the minority of storms which do not produce lightning and thunder. Convective storms can produce tornadoes as well as large hail, strong winds, and heavy rain leading to flash flooding. The detection of convective storms relies on direct eyewitness observations, for example from storm spotters; and on remote sensing, especially weather radar. Some in situ measurements are used for direct detection as well, notably, wind speed reports from surface observation stations. It is part of the integrated warning system, consisting of prediction, detection, and dissemination of information on severe weather to users such as emergency management, storm spotters and chasers, the media, and the general public.[1]
Contents
History
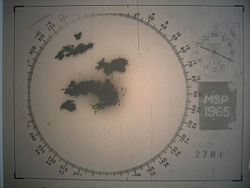 1960s radar technology (WSR-57) displaying supercells over the Twin Cities during the 1965 Twin Cities tornado outbreak.
Rigorous attempts to warn of tornadoes began in the United States in the mid-20th century. Before the 1950s, the only method of detecting a tornado was by someone seeing it on the ground. Often, news of a tornado would reach a local weather office after the storm.
But, with the advent of weather radar, areas near a local office could get advance warning of severe weather. The first public tornado warnings were issued in 1950 and the first tornado watches and convective outlooks in 1952.[2] In 1953 it was confirmed that hook echoes are associated with tornadoes. By recognizing these radar signatures, meteorologists could detect thunderstorms likely producing tornadoes from dozens of miles away.[3]
Storm spotting
In the mid 1970s, the US National Weather Service (NWS) increased its efforts to train storm spotters to identify and report key features of storms which indicate severe hail, damaging winds, and tornadoes, as well as damage itself and flash flooding. The program was called Skywarn, and the spotters were local sheriff's deputies, state troopers, firefighters, ambulance drivers, amateur radio operators, civil defense (now emergency management) spotters, storm chasers, and ordinary citizens. When severe weather is anticipated, local weather service offices request that these spotters look out for severe weather, and report any tornadoes immediately, so that the office can issue a timely warning.
Usually spotters are trained by the NWS on behalf of their respective organizations, and report to them. The organizations activate public warning systems such as sirens and the Emergency Alert System, and forward the reports to the NWS, which does directly disseminate information and warnings through its NOAA Weather Radio All Hazards network.[1] There are more than 230,000 trained Skywarn weather spotters across the United States.[4]
In Canada, a similar network of volunteer weather watchers, called Canwarn, helps spot severe weather, with more than 1,000 volunteers.[5] In Europe, several nations are organizing spotter networks under the auspices of Skywarn Europe[6] and the Tornado and Storm Research Organisation (TORRO) has maintained a network of spotters in the United Kingdom since the 1970s.
Storm spotters are needed because radar systems such as NEXRAD, and satellite images, do not detect tornadoes or hail, only indications that the storm has the potential.[7] Radar and satellite data interpretation will usually give a warning before there is any visual evidence of such events, but ground truth from an observer can either verify the threat or determine it is not imminent. The spotter's ability to see what these remote sensing devices cannot is especially important as distance from a radar site increases, because the radar beam becomes progressively higher in altitude further away from the radar, due to curvature of Earth and the spread of the beam with distance. Therefore, when far from a radar, only precipitations and velocities high in the storm are observed. The important areas might not then be sampled or the resolution of the data might be poor. Also, some meteorological situations leading to tornadogenesis are not readily detectable by radar and on occasion tornado development may occur more quickly than radar can complete a scan and send the batch of data.[7]
Visual evidence

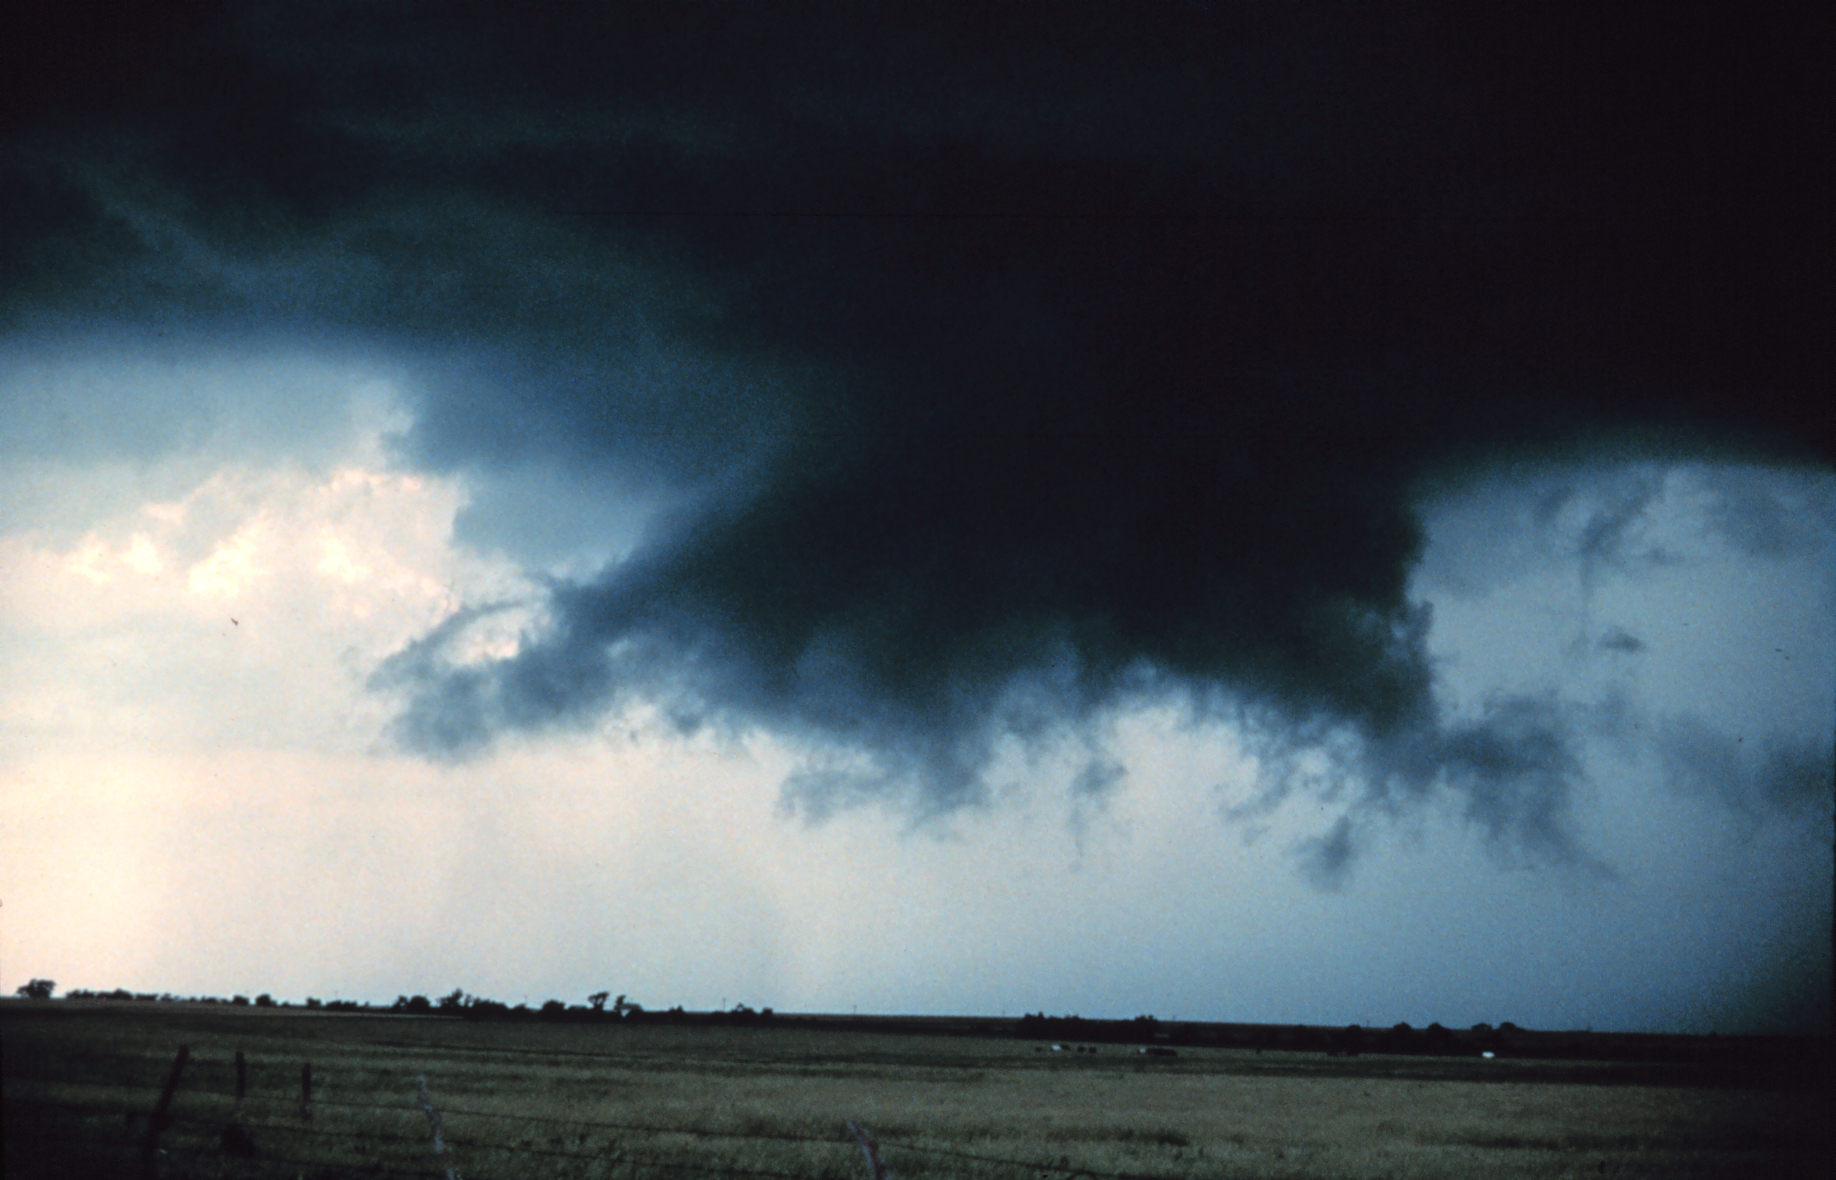
Storm spotters are trained to discern whether a storm seen from a distance is a supercell.[7] They typically look to its rear, the main region of updraft and inflow.[7] Under the updraft is a rain-free base, and the next step of tornadogenesis is the formation of a rotating wall cloud. The vast majority of intense tornadoes occur with a wall cloud on the backside of a supercell.[8]
Evidence of a supercell comes from the storm's shape and structure, and cloud tower features such as a hard and vigorous updraft tower, a persistent and/or large overshooting top, a hard anvil (especially when backsheared against strong upper level winds), and a corkscrew look or striations.[7] Under the storm and closer to where most tornadoes are found, evidence of a supercell and likelihood of a tornado includes inflow bands (particularly when curved) such as a "beaver tail", and other clues such as strength of inflow, warmth and moistness of inflow air, how outflow- or inflow-dominant a storm appears, and how far is the front flank precipitation core from the wall cloud. Tornadogenesis is most likely at the interface of the updraft and front flank downdraft, and requires a balance between the outflow and inflow.[9]
Only wall clouds that rotate spawn tornadoes, and usually precede the tornado by five to thirty minutes. Rotating wall clouds are the visual manifestation of a mesocyclone. Barring a low-level boundary, tornadogenesis is highly unlikely unless a rear flank downdraft occurs, which is usually visibly evidenced by evaporation of cloud adjacent to a corner of a wall cloud. A tornado often occurs as this happens or shortly after; first, a funnel cloud dips and in nearly all cases by the time it reaches halfway down, a surface swirl has already developed, signifying a tornado is on the ground before condensation connects the surface circulation to the storm. Tornadoes may also occur without wall clouds, under flanking lines, and on the leading edge. Spotters monitor all areas of a storm and their surroundings.[10]
Radar
Main articles: Weather radar and Lemon techniqueToday, most developed countries have a network of weather radars, which remains the main method of detecting signatures likely associated with tornadoes and other severe phenomenons as hail and downbursts. Radar is always available, in places and times where spotters are not, and can also see features that spotters cannot, in the darkness of night and processes hidden within the cloud as well as invisible processes outside the cloud.
Tornadoes
 Doppler NEXRAD radar image of two mesocyclones with one supercell passing over Northern Michigan on July 3rd, 1999 at 23:41 UTC. Rotations is seen as small couplets of red (away) and green (toward) radial velocities. The thick circles represents 3D vortices which have been classified as mesocyclones near the ground by a detection algorithm. The left mesocyclone is associated with a tornado while to the right a larger area of rotation has developed.
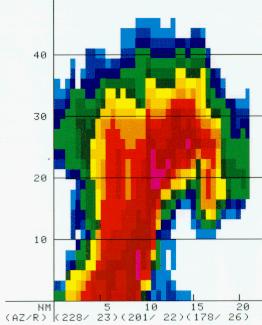
 A classic hook echo. The tornado associated with this echo was part of the 1999 Oklahoma tornado outbreak. It reached F5 strength on the Fujita scale.
 Vertical cross-section through a supercell exhibiting a BWER.
In short-term prediction and detection of tornadoes, meteorologists integrate radar data with reports from the field and knowledge of the meteorological environment. Radar analysis is augmented by automated detection systems called algorithms. Meteorologists first look at the atmospheric environment as well as changes thereof, and once storms develop, storm motion and interaction with the environment.
An early step in a storm organizing into a tornado producer is the formation of a weak echo region (WER) with a tilted updraft. This is an area within the thunderstorm where precipitation should be occurring but is "pulled" aloft by a very strong updraft. The weak echo region is characterized by weak reflectivity with a sharp gradient to strong reflectivity above it and partially surrounding the sides. The region of the precipitation lofted above the WER is the echo overhang consisting of precipitation particles diverging from the storm's summit that descend as they are carried downwind. Within this area, a bounded weak echo region (BWER) may then form above and enclosing the WER. A BWER is found near the top of the updraft and nearly or completely surrounded by strong reflectivity, and is indicative of a supercell capable of cyclic tornadogenesis. A mesocyclone may descend or a tornado may form in the lower level of the storm simultaneously as the mesocyclone forms.
In reflectivity (precipitation intensity) data, a tight echo gradient (particularly on the inflow area) and a fan shape generally indicate a supercell. A V-notch or "flying eagle echo" tend to be most pronounced with intense classic supercells, the type of supercell that produces most of the strongest, largest, and longest lived tornadoes. This is not to be confused with an inflow notch; which is a lower level indentation in the precipitation where there is little to no reflectivity, indicative of strong, organized inflow and a severe storm that is most likely a supercell. The rear inflow notch (or weak echo channel) occurs to the east or north of a mesocyclone and hook echo. Forward inflow notches also occur, particularly on high-precipitation supercells (HP) and quasi-linear convective systems (QLCS).
In the United States and a few other countries, Doppler capable weather radar stations are used. These devices are capable of measuring the radial velocity, including radial direction (towards or away from the radar) of the winds in a storm, and so can spot evidence of rotation in storms from more than a hundred miles (160 km) away. A supercell is characterized by a mesocyclone, which is usually first observed in velocity data as a tight, cyclonic structure in the middle levels of the thunderstorm. If it meets certain requirements of strength, duration, and vorticity, it may trip the mesocyclone detection algorithm (MDA). Tornadic signatures are indicated by a cyclonic inbound-outbound velocity couplet, where strong winds flowing in one direction and strong winds flowing in the opposite direction are occurring in very close proximity. The algorithm for this is the tornadic vortex signature (TVS). TVS often also forms first in the middle levels of the thunderstorm and may descend and tighten into a tornado. The TVS is smaller and found at lower level than the MDA, and usually is the tornado cyclone not the actual tornadic circulation. The TVS is, however, indicative of a likely tornado or an incipient tornado. The couplet and TVS typically precede tornado formation by 10–30 minutes but may occur at nearly the same time or precede the tornado by 45 minutes or more. The hook echo feature is formed as the RFD occludes precipitation around the mesocyclone and is also indicative of a probable tornado (tornadogenesis usually ensues shortly after the RFD reaches the surface).
After the implementation of the WSR-88D network in the U.S., the probability of detection of tornadoes increased substantially, the average lead time rose from four minutes to thirteen minutes, and a 2005 NOAA report estimates that as a result of improved warnings that there are 45 percent fewer fatalities and 40 percent fewer injuries annually. Dual-polarization radar, being implemented to the US NEXRAD network[11], may provide enhanced warning of tornadoes and severe winds and hail associated with the hook echo due to distinct precipitation drop characteristics.[12] Polarimetric radar boosts precipitation observation and prediction, especially rainfall rates, hail detection, and distinguishing precipitation types.[13] Proposed radar technologies, such as phased array and CASA, would further improve observations and forecasts by increasing the temporal and spatial resolution of scans in the former[14] as well as providing low-level radar data over a wide area in the latter[15].
Hail, downburst and downpour
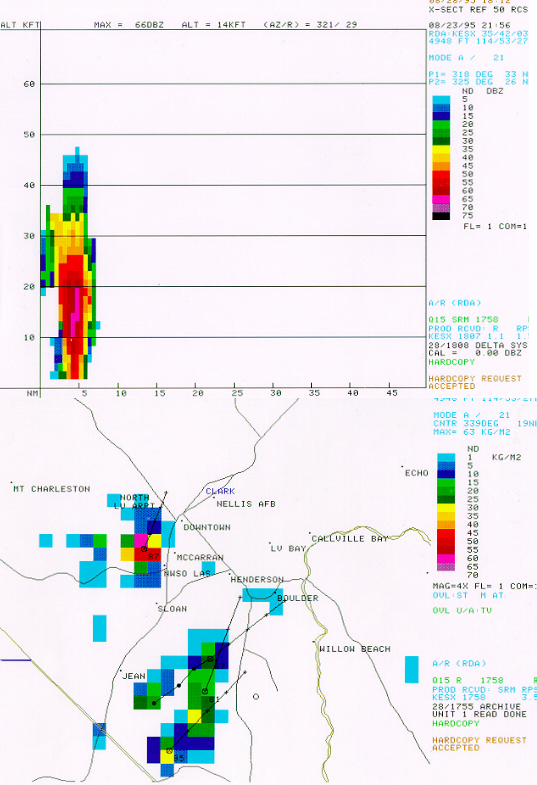
 Vertical cross-section of a thunderstorm at the top and VIL value of 63 kg/m² with that cell at the bottom (red one), giving potential for hail, downpour, and/or downdraft
Hail forms in a very intense updraft in a supercell or a multicellular thunderstorm. As for tornadoes, BWER detection and a tilted updraft are indicative of that updraft but does not lead to predict hail. The presence of a hail spike in the reflectivity pattern is an important clue. It is an area of weak reflectivity extending away from the radar immediately behind a thunderstorm with hail. It is caused by radiation from the radar bouncing from hailstone to hailstone or the ground before being reflected back to the radar. The time delay between the backscattered radiation from the storm and the one with multiple paths causes the reflectivity from the hail to appear to come from a farther range than the actual storm.[16] However, this artefact is visible mostly for extremely large hail.
What is needed is a knowledge of the water content in the thunderstorm, the freezing level and the height of the summit of the precipitation. One way of calculating the water content is to transform the reflectivities in rain rate at all levels in the clouds and to sum it up. This is done by an algorithm called Vertically integrated liquid, or VIL. This value represent the total amount of liquid water in the cloud that is available. If the cloud would rain out completely, it would be the amount of rain falling on the ground and one can estimate with VIL the potential for flash flood.[17]
However, the reflectivities are greatly enhanced by hail and VIL is greatly overestimating the rain potential in presence of hail. On the other hand, National Weather Service meteorologists have found that the VIL density, that is to say VIL divided by the maximum height of the 18 dBZ in the cloud, is a good indicator of the presence of hail when it reach 3.5.[17] This is a crude yes/no index and other algorithms have been developed involving VIL and the freezing level height.[17] More recently, dual polarization of weather radar have shown promising direct detection of hail.
VIL can be used to estimate the potential for downburst, too. A convective downdraft is linked to three forces in the vertical, namely perturbation pressure gradient force, buoyancy force and precipitation loading. The pressure gradient force was neglected as it has significant effect only on the updraft in supercells. With this assumption and other simplifications (e.g. requiring the environment of the air parcel to be static on the time scale of the downdraft). The resulting momentum equation is integrated over height to yield the kinetic energy of the parcel on descending to the surface and is found to be the negative CAPE of a dry air parcel injected into the storm, plus de motion of the convective cell. S. R. Stewart, from NWS, has published in 1991 an equation relating VIL and the echo tops that give the potential for surface gust using this concept.[18] This is a predictive result that gives a certain lead time. With the Doppler velocity data, the meteorologist can see the downdraft and gust fronts happening, but since this a small scale feature, detection algorithms have been developed to point convergence and divergence areas under a thunderstorm on the radar display.
Satellite imagery
 Infrared weather satellite image at 23Z 7 April 2006 associated with a significant tornado outbreak in the eastern United States with arrows pointing to the enhanced-v signatures.
Most populated areas of the earth are now well covered by weather satellites, which aid in the nowcasting of severe convective and tornadic storms.[5] These images are available in the visible and infrared domains. The infrared (IR: 10-13 µm) images permit estimation of the top height of the clouds, according to the air mass soundings of the day, and the visible (VIS: 0.5-1.1 µm) ones will show the shape of the storms by its brightness and shadow produced. Meteorologists can extract information about the development stage and subsequent traits of thunderstorms by recognizing specific signatures in both domains. Visible imagery permits the most detailed imagery whereas infrared imagery has the advantage of availability at night. Sensors on satellites can also detect emissions from water vapor (WV: 6-7 µm), but mostly in the middle to upper levels of the troposphere, so thunderstorms are only seen after being well developed. It is, however, useful in convective storm prediction, as it illustrates the placement and movement of air masses and of moisture, as well as shortwaves and areas of vorticity and lift.
Severe storms have a very strong updraft. The rising air parcels in that column accelerate and will overshoot the equilibrium level before being pulled back by negative buoyancy. This mean the cloud tops will reach higher levels than the surrounding cloud in the updraft region. This overshooting top will be noticeable by a colder temperature region in the thunderstorm on infrared images. Another signature associated with this situation is the Enhanced-V feature where the cold cloud tops forming at the overshooting top fan out in a V shape as cloud matter is blown downwind at that level.[19] Both features can be seen on visible satellite imagery, during daytime, by the shadows they cast on surrounding clouds.
In multicellular storms and squall lines, the mid-level jet stream is often intersecting the line and its dry air introduced into the cloud is negatively unstable. This results in a drying of the cloudy air in the region where the jet plunge groundward. On the back edge of the line, this shows as clear notches where one can find stronger downdrafts at the surface. These kind of lines will have a very characteristic undulating pattern caused by the interference of the gusts fronts coming from different parts of the line.
Finally, in any type of thunderstorms, the surface cold pool of air associated the downdraft will stabilize the air and form a cloud free area which will end along the gust front. This mesoscale front, when moving into a warm and unstable air mass, will lift it and cumulus clouds appear on satellite pictures. This line is likely the point of further convection and storms. One can notice it at the leading edge of a squall line, in the southeastern quadrant of a typical supercell (in the northern hemisphere), or different regions around other thunderstorms. They may also be visible as an outflow boundary hours or days after convection and can pinpoint areas of favored thunderstorm development, possible direction of movement, and even likelihood for tornadoes. The speed of forward movement of the outflow boundary or gust front to some degree modulates the likelihood of tornadoes and helps determine whether a storm will be enhanced by its presence or the inflow be choked off thus weakening and possibly killing the storm. Thunderstorms may move along slow moving or stationary outflow boundaries and tornadoes are more likely; whereas fast moving gust fronts in many cases weaken thunderstorms after impact and are less likely to produce tornadoes --although brief tornadoes may occur at the time of impact. Fast moving gust fronts may eventually decelerate and become slow moving or stationary outflow boundaries with the characteristic "agitated area" of cumulus fields previously mentioned.
Lightning detection
Main article: Lightning detectorUsually in conjunction with data sources such as weather radar and satellites, lightning detection systems are sometimes utilized to pinpoint where thunderstorms are occurring (and to identify lightning hazard). Currently, most lightning data provided in real-time is from terrestrial sources, specifically, networks of ground-based sensors, although airborne sensors are also in operation. Most of these only provide latitude & longitude, time, and polarity of cloud-to-ground strikes within a limited range. Increasing in sophistication and availability, and affording data for a very wide area, are satellite-based lightning detectors which initially included optical sensors indicating flash rates and horizontal location but now radio frequency receivers that can identify intra-cloud flashes with the addition of altitude, as well.
Lightning data is useful in suggesting intensity and organization of convective cells as well trends in thunderstorm activity (particularly growth, and to a lesser degree, decay). It is also useful in the early stages of thunderstorm development. This was especially true when visible and infrared satellite data was delayed, but continues to be useful in detecting thunderstorms in stages of development before there is a substantial radar signature or for areas where radar data is lacking. Coming advances in research and observations should improve forecasts of severe weather and increase warning time.[20]
Personal lightning detection systems are also available, which may provide strike time, azimuth, and distance. In addition, lightning prediction systems are available and used mostly by parks and other outdoor recreational facilities, or meteorologists contracted to provide weather information for them.
See also
- National Severe Storms Laboratory
- Storm Prediction Center
- Warning Decision Training Branch
- Robert C. Miller, a pioneer in the field of forecasting tornadoes
References
- ^ a b Doswell, Charles A. III; A.R. Moller and H.E. Brooks (August 1999). "Storm Spotting and Public Awareness since the First Tornado Forecasts of 1948". Weather and Forecasting 14 (4): 544–57. Bibcode 1999WtFor..14..544D. doi:10.1175/1520-0434(1999)014<0544:SSAPAS>2.0.CO;2. http://ams.allenpress.com/perlserv/?request=get-abstract&doi=10.1175%2F1520-0434%281999%29014%3C0544%3ASSAPAS%3E2.0.CO%3B2.
- ^ Galway, Joseph G. (December 1992). "Early Severe Thunderstorm Forecasting and Research by the United States Weather Bureau". Weather and Forecasting (American Meteorological Society) 7 (4): 564–87. Bibcode 1992WtFor...7..564G. doi:10.1175/1520-0434(1992)007<0564:ESTFAR>2.0.CO;2. http://ams.allenpress.com/perlserv/?request=get-abstract&doi=10.1175%2F1520-0434(1992)007%3C0564%3AESTFAR%3E2.0.CO%3B2.
- ^ Markowski, Paul M. (April 2002). "Hook Echoes and Rear-Flank Downdrafts: A Review". Monthly Weather Review 130 (4): 852–76. Bibcode 2002MWRv..130..852M. doi:10.1175/1520-0493(2002)130<0852:HEARFD>2.0.CO;2. http://ams.allenpress.com/perlserv/?request=get-abstract&doi=10.1175%2F1520-0493(2002)130%3C0852:HEARFD%3E2.0.CO%3B2.
- ^ "What is SKYWARN?". National Weather Service. http://www.weather.gov/skywarn/. Retrieved 2007-02-27.
- ^ a b "Tornado Detection at Environment Canada". Environment Canada. 2004-06-02. http://www.mb.ec.gc.ca/air/summersevere/ae00s10.en.html. Retrieved 2007-03-16.
- ^ Skywarn Europe Retrieved on 2007-05-18
- ^ a b c d e Chance Hayes, National Weather Service Wichita, Kansas. "Storm Fury on the Plains." Storm Spotter Training. 4H Building, Salina, Kansas. 22 Feb. 2010. Lecture.
- ^ Edwards, Moller, Purpura, et al (2005). "Basic Spotters’ Field Guide" (PDF). National Oceanic and Atmospheric Administration. http://www.nws.noaa.gov/om/brochures/basicspot.pdf. Retrieved 2006-11-01.
- ^ Doswell, Moller, Anderson, et al (2005). "Advanced Spotters' Field Guide" (PDF). National Oceanic and Atmospheric Administration. http://www.weather.gov/os/brochures/adv_spotters.pdf. Retrieved 2006-09-20.
- ^ "Questions and Answers about Tornadoes". A Severe Weather Primer. National Severe Storms Laboratory. 2006-11-15. http://www.nssl.noaa.gov/primer/tornado/tor_basics.html. Retrieved 2007-07-05.
- ^ Dual Polarization (ROC)
- ^ Kumjian, Matthew R. (2011-10-05). "Precipitation properties of supercell hook echoes". Electronic J. Severe Storms Meteor 6 (5): 1–21. http://www.ejssm.org/ojs/index.php/ejssm/article/view/93/65.
- ^ Polarimetric Doppler Radar (NSSL)
- ^ Phased Array Radar (NSSL)
- ^ UMass CASA
- ^ "Hail spike". Glossary. National Weather Service Forecast Office Albany, New York. June 2009. http://nws.noaa.gov/glossary/index.php?letter=h. Retrieved 2009-01-10.
- ^ a b c Carl S. Cerniglia and Warren R. Snyder (June 2002). "Development of Warning Criteria for Severe Pulse Thunderstorms ine the Northeastern United States using the WSR-88D" (pdf). National Weather Service Forecast Office Albany, New York. http://www.erh.noaa.gov/er/hq/ssd/erps/ta/ta2002-03.pdf. Retrieved 2008-10-03.
- ^ Stewart, S.R. (1991). The prediction of pulse-type thunderstorm gusts using vertically integrated liquid water content (VIL) and the cloud top penetrative downdraft mechanism. Technical Memorandum, NWS SR-136. NOAA.
- ^ Brunner, Jason C.; S.A. Ackerman, A.S. Bachmeier, and R.M. Rabin (August 2007). "A Quantitative Analysis of the Enhanced-V Feature in Relation to Severe Weather". Weather and Forecasting 22 (4): 853–72. Bibcode 2007WtFor..22..853B. doi:10.1175/WAF1022.1. http://ams.allenpress.com/perlserv/?request=get-abstract&doi=10.1175%2FWAF1022.1.
- ^ Schultz, Christopher J.; W.A. Peterson, L.D. Carey (Oct 2011). "Lightning and Severe Weather: A Comparison between Total and Cloud-to-Ground Lightning Trends". Weather and Forecasting (Boston: American Meteorological Society) 26 (5): 744–55. doi:10.1175/WAF-D-10-05026.1. http://journals.ametsoc.org/doi/abs/10.1175/WAF-D-10-05026.1.
Further reading
- Church, C.; D. Burgess (Author), C. Doswell (Author), R. Davies-Jones (Editor) (December 1993). The Tornado: Its Structure, Dynamics, Prediction, and Hazards (Geophysical Monograph #79). Washington, DC: American Geophysical Union. ISBN 0875900380.
- Doswell, Charles A. III (Editor) (November 2001). Severe Convective Storms (Meteorological Monographs, Vol. 28, No. 50). Boston, MA: American Meteorological Society. ISBN 1878220411.
- Grazulis, Thomas P. (July 1993). Significant Tornadoes 1680-1991: A Chronology and Analysis of Events. St. Johnsbury, VT: The Tornado Project of Environmental Films. ISBN 1-879362-03-1.
- Kessler, Edwin (September 1988). Instruments and Techniques for Thunderstorm Observation and Analysis (Thunderstorms: a Social, Scientific, and Technological Documentary, Vol 3). Norman, OK: University of Oklahoma Press. ISBN 0806121173.
External links
- NSSL Severe Weather Primer
- NSSL Warning Research and Development
- NOAA Hazardous Weather Testbed
- Tornado Warning Guidance (NWS Warning Decision Training Branch)
- Supercell Structure and Dynamics (NWS)
- Tornadogenesis cascade paradigm and schematic (San Francisco State University)
- An Introduction to Storm Observation and Reporting (NWS)
- An Online Meteorology Guide: Severe Storms (University of Illinois)
- Weather Glossary for Storm Spotters (NOAA Technical Memorandum NWS SR-145)
- Thunderstorms (NWS JetStream Online Weather School)


Wikimedia Foundation. 2010.