- Manitoba general election, 2007
-
Manitoba general election, 2007 
2003 ← May 22, 2007 → 2011 57 seats of the Legislative Assembly of Manitoba
29 seats were needed for a majorityFirst party Second party Third party 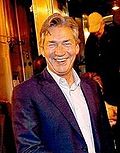
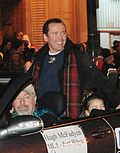
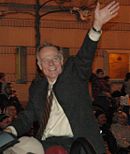
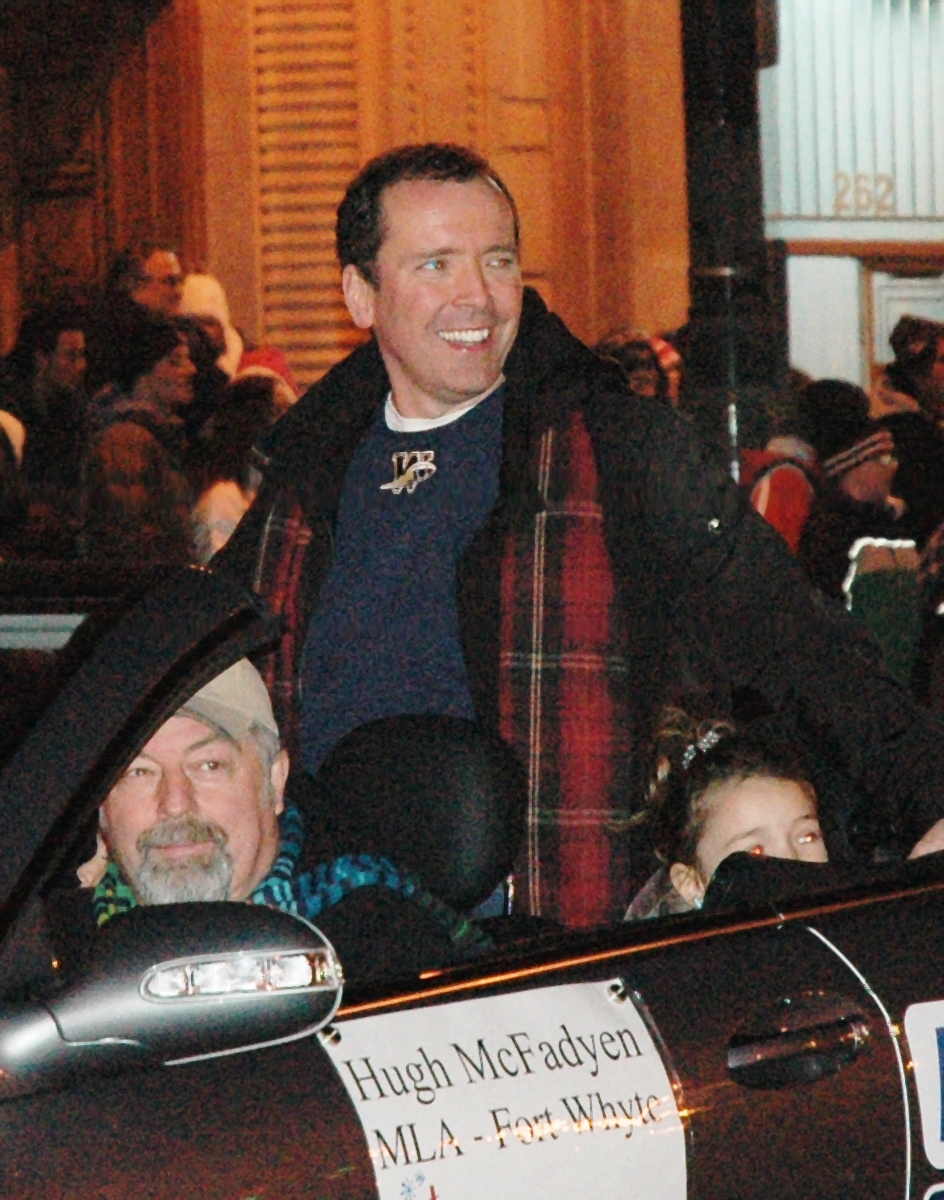
Leader Gary Doer Hugh McFadyen Jon Gerrard Party New Democrat Progressive Conservative Liberal Leader since 1988[1] 2006 1998 Leader's seat Concordia Fort Whyte River Heights Last election 35 20 2 Seats won 36 19 2 Seat change +1 -1 0 Popular vote 200,834 158,511 51,857 Percentage 48.00% 37.89% 12.39% Swing –1.47% +1.70% –0.80%

Map of Manitoba with the ridings coloured to indicate the winning parties and their popular vote
Premier before election
Elected Premier
 Riding-by-riding results
The Manitoba general election held on May 22, 2007 was held to elect Members of the Legislative Assembly of the Province of Manitoba, Canada. It was won by the New Democratic Party, which won 36 seats out of 57. The Progressive Conservative Party finished second with nineteen seats. The Liberal Party won two seats. As a result, Premier of Manitoba Gary Doer received a mandate to form a third consecutive majority government, becoming the first Premier of Manitoba to achieve this since Duff Roblin in 1966.
The election resulted in very few changes from the party standings at the dissolution of the previous legislature. One New Democrat incumbent was defeated by a Progressive Conservative challenger, and one Progressive Conservative incumbent was defeated by a New Democrat. The PCs picked up one seat that was previously held by an independent, and the NDP picked up one seat that was vacant at dissolution. The other 53 seats in the legislature were all retained by their incumbent parties.
Contents
Results
Summary of the May 22, 2007 Manitoba Legislature election results[2] Party Party leader Candidates Seats Popular vote 2003 Dissol. 2007 +/— # % Change New Democratic Gary Doer 57 35 35 36 +1 200,834 48.00% –1.47% Progressive Conservative Hugh McFadyen 56 20 18 19 –1 158,511 37.89% +1.70% Liberal Jon Gerrard 57 2 2 2 0 51,857 12.39% –0.80% Green Andrew Basham 15 0 0 0 — 5,586 1.34% +0.38% Communist Darrell Rankin 6 0 0 0 — 367 0.09% +0.01% Independents and no affiliation 5 0 1 0 — 1,235 0.30% +0.26% Vacant 1 Total 196 57 57 57 — 420,540 56.75% Registered Voters 740,991 Results by region
Party Name Northern Parkland Westman Eastman Winnipeg Central Plains Pembina Valley Interlake Total NDP Seats: 4 2 1 1 25 0 0 3 36 Popular Vote: 69.33% 55.92% 41.34% 29.46% 52.86% 28.11% 27.66% 52.03% 48.00% PC Seats: 0 0 4 4 4 4 2 1 19 Popular Vote: 17.84% 39.65% 51.99% 59.61% 29.25% 62.67% 57.66% 40.04% 37.89% Liberal Seats: 0 0 0 0 2 0 0 0 2 Popular Vote: 12.83% 4.43% 5.63% 9.26% 15.46% 9.22% 14.68% 6.88% 12.39% Green Seats: 0 0 0 0 0 0 0 0 0 Popular Vote: xx xx 0.74% 0.70% 1.96% xx xx 1.05% 1.34% Communist Seats: 0 0 0 0 0 0 0 0 0 Popular Vote: xx xx 0.11% xx 0.14% xx xx xx 0.09% Independent Seats: 0 0 0 0 0 0 0 0 0 Popular Vote: xx xx 0.19% 0.98% 0.33% xx xx xx 0.30% Total seats: 4 2 5 5 31 4 2 4 57 Results by place
Party Seats Second Third Fourth New Democratic Party 36 20 1 0 Progressive Conservative 19 28 9 0 Liberal Party 2 8 45 2 Green 0 1 1 13 Communist 0 0 0 2 Independent 0 0 0 2 Candidates by riding
Northern Manitoba/Parkland
Electoral District Candidates Incumbent NDP PC Liberal Green Other Dauphin-Roblin Stan Struthers
4,214 (53.50%)Lloyd McKinney
3,257 (41.35%)Yarko Petryshyn
385 (4.89%)Stan Struthers Flin Flon Gerard Jennissen
2,255 (76.73%)Gary Zamzow
651 (22.08%)Gerrard Jennissen Rupertsland Eric Robinson
2,092 (58.21%)David Harper
1,285 (35.75%)Earl Fontaine
202 (5.62%)Eric Robinson Swan River Rosann Wowchuk
4,522 (58.18%)Maxine Plesiuk
2,915 (37.51%)Niomi Spence-Pranteau
306 (3.93%)Rosann Wowchuk The Pas Oscar Lathlin
3,262 (68.30%)George Muswaggon
1,016 (21.27%)James Houston
459 (9.61%)Oscar Lathlin Thompson Steve Ashton
3,036 (73.44%)Cory Phillips
416 (10.06%)Kenny Braun
651 (15.89%)Steve Ashton Totals NDP
19,381 (62.67%)PC
8,889 (28.74%)Liberal
2,654 (8.58%)Westman
Electoral District Candidates Incumbent NDP PC Liberal Green Other Arthur-Virden Bob Senff
2,141 (30.81%)Larry Maguire
4,451 (64.05%)Fred Curry
357 (5.14%)Larry Maguire Brandon East Drew Caldwell
3,760 (53.95%)Mike Waddell
2,655 (38.10%)Cheryl Burke
554 (7.95%)Drew Caldwell Brandon West Scott Smith
4,674 (47.48%)Rick Borotsik
4,730 (48.04%)M.J. Willard
398 (4.04%)Lisa Gallagher (Communist)
43 (0.44%)Scott Smith Minnedosa Harvey Paterson
2,769 (38.44%)Leanne Rowat
3,790 (52.62%)Christopher Baker
268 (3.72%)James Beddome
281 (3.90%)Colin Atkins (Ind)
72 (1.00%)Leanne Rowat Russell Teri Nicholson
2,375 (33.45%)Len Derkach
4,141 (58.32%)Clarice Wilson
564 (7.94%)Len Derkach Totals NDP
15,719 (41.34%)PC
19,767 (51.99%)Liberal
2,141 (5.60%)Green
281 (0.74%)Other
115 (0.30%)Central Manitoba
Electoral District Candidates Incumbent NDP PC Liberal Green Other Carman Sharon Sadowy
1,440 (21.71%)Blaine Pedersen
3,845 (57.96%)Don Oldcorn
1,293 (19.49%)Denis Rocan† Gimli Peter Bjornson
5,946 (58.43%)Chris Bourgeois
3,450 (33.90%)Lynn Greenberg
727 (7.14%)Peter Bjornson Interlake Tom Nevakshonoff
4,047 (59.30%)Garry Wasylowski
2,445 (35.82%)Franklin Swark
309 (4.53%)Tom Nevakshonoff Lakeside Mitch Obach
2,631 (33.08%)Ralph Eichler
4,448 (55.93%)Ian Band
488 (6.14%)David Michael Carey
349 (4.39%)Ralph Eichler Morris Kevin Stevenson
2,517 (32.31%)Mavis Taillieu
4,404 (56.53%)Michael Sherby
808 (10.37%)Mavis Taillieu Pembina Lisa Moore
960 (14.25%)Peter Dyck
5,192 (77.06%)Ralph Gowan
570 (8.46%)Peter Dyck Portage La Prairie James Kostuchuk
2,935 (42.23%)David Faurschou
3,344 (48.16%)Marvin Krawec
643 (9.25%)David Faurschou Selkirk Greg Dewar
4,584 (55.26%)Gordie Dehn
2,951 (35.57%)Karen Keppler
704 (8.49%)Greg Dewar Ste. Rose Denise Harder
2,022 (33.08%)Stu Briese
3,599 (58.89%)Janelle Mailhot
465 (7.61%)Glen Cummings† Turtle Mountain Faron Douglas
1,476 (22.45%)Cliff Cullen
4,318 (65.67%)Allen Hunter
739 (11.24%)Cliff Cullen Totals NDP
28,558 (38.64%)PC
37,996 (51.40%)Liberal
6,746 (9.12%)Green
617 (0.83%)Eastman
Electoral District Candidates Incumbent NDP PC Liberal Green Other Emerson Chris Murash
1,296 (21.23%)Cliff Graydon
3,636 (59.56%)Monica Guetre
1,117 (18.30%)Jack Penner† Lac du Bonnet Patrick O'Connor
2,773 (33.51%)Gerald Hawranik
4,855 (58.81%)Christopher Gmiterek
607 (7.33%)Gerald Hawranik La Verendrye Ron Lemieux
4,018 (51.12%)Bob Stefaniuk
2,973 (37.82%)Roland Chaput
490 (6.23%)Jay Murray (Ind)
379 (4.82%)Ron Lemieux Springfield Ernest Muswagon
2,656 (29.91%)Ron Schuler
5,165 (58.16%)James Johnston
1,014 (11.42%)Ron Schuler Steinbach Rawle Squires
641 (8.66%)Kelvin Goertzen
6,143 (82.98%)John Thiessen
350 (4.74%)Janine Gibson
268 (3.62%)Kelvin Goertzen Totals NDP
11,384 (30.05%)PC
22,272 (58.79%)Liberal
3,578 (9.46%)Green
268 (0.70%)Other
379 (1.00%)Northwest Winnipeg
Electoral District Candidates Incumbent NDP PC Liberal Green Other Burrows Doug Martindale
3,790 (70.75%)Rick Negrych
1,005 (18.76%)Bernd Hohne
562 (11.09%)Doug Martindale Inkster Romulo Magsino
2,358 (34.13%)Roger Bennett
543 (7.89%)Kevin Lamoureux
3,962 (57.49%)Kevin Lamoureux Kildonan Dave Chomiak
5,012 (61.35%)Brent Olynyk
2,360 (28.89%)Wade Parke
554 (6.78%)Nathan Zahn
203 (2.49%)Dave Chomiak Point Douglas George Hickes
2,665 (66.36%)Alexa Rosentreter
481 (11.98%)Mary Lou Bourgeois
591 (14.72%)Kristen Andrews
213 (5.30%)Darrell Rankin (Communist)
66 (1.64%)George Hickes St. Johns Gord Mackintosh
4,223 (68.59%)Tim Hooper
1,018 (16.53%)Selina Sapong-Bieber
604 (9.81%)Dawn Carey
291 (4.72%)Gord Mackintosh The Maples Mohinder Saran
3,617 (55.64%)Lou Fernandez
1,895 (29.15%)Pritam Brar
928 (14.27%)Cris Aglugub† Wellington Flor Marcelino
2,332 (53.35%)José Tomas
570 (12.97%)Rhonda Gordon Powers
718 (16.72%)Joe Chan (Ind)
501 (11.53%)
Conrad Santos (Ind)
183 (4.19%)Conrad Santos Totals NDP
23,997 (56.75%)PC
7,872 (18.62%)Liberal
7,912 (18.71%)Green
707 (1.67%)Other
794 (1.88%)Northeast Winnipeg
Electoral District Candidates Incumbent NDP PC Liberal Green Other Concordia Gary Doer
3,862 (69.05%)Ken Waddell
1,209 (21.62%)Leslie Worthington
336 (6.01%)Andrew Basham
186 (3.33%)Gary Doer Elmwood Jim Maloway
3,873 (61.51%)Allister Carrington
1,323 (21.01%)Dave Love
1,101 (17.48%)Jim Maloway Radisson Bidhu Jha
4,804 (56.72%)Linda West
2,988 (35.28%)Murray Cliff
677 (7.99%)Bidhu Jha River East Kurt Penner
4,299 (46.07%Bonnie Mitchelson
4,348 (46.63%)Margaret von Lau
635 (6.80%)Bonnie Mitchelson Rossmere Erna Braun
4,824 (60.38%)Cathy Cox
2,602 (32.56%)Isaiah Oyeleru
521 (6.52%)Harry Schellenberg† St. Boniface Greg Selinger
5,068 (66.04%)Jennifer Tarrant
999 (12.88%)Gilbert Laberge
1,044 (13.61%)Alain Landry
528 (6.88%)Thane-Dominic Carr (Communist)
44 (0.58%)Greg Selinger Transcona Daryl Reid
4,560 (68.74%)Bryan McLeod
1,470 (22.16%)Gerald Basarab
604 (9.10%)Daryl Reid Totals NDP
31,290 (60.28%)PC
14,939 (28.78%)Liberal
4,918 (9.48%)Green
714 (1.38%)Other
44 (0.08%)West Winnipeg
Electoral District Candidates Incumbent NDP PC Liberal Green Other Assiniboia Jim Rondeau
5,177 (62.21%)Kelly de Groot
2,686 (32.38%)Bernie Bellan
459 (5.52%)Jim Rondeau Charleswood Mel Willis
2,598 (31.66%)Myrna Driedger
4,460 (54.36%)Michael Rosenberg
1,106 (13.51%)Myrna Driedger Kirkfield Park Sharon Blady
4,985 (49.32%)Chris Kozier
3,852 (38.12%)Doug Kayler
1,261 (12.56%)Vacant St. James Bonnie Korzeniowski
4,231 (55.65%)Kristine McGhee
2,344 (30.83%)Fred Morris
656 (8.63%)Mike Johannson
339 (4.47%)Bonnie Korzeniowski Tuxedo Matt Schaubroeck
2,590 (30.62%)Heather Stefanson
3,982 (47.07%)Audra Bayer
1,865 (21.92%)Heather Stefanson Totals NDP
19,581 (45.32%)PC
17,324 (40.10%)Liberal
5,347 (12.38%)Green
954 (2.21%)Central Winnipeg
Electoral District Candidates Incumbent NDP PC Liberal Green Other Fort Rouge Jennifer Howard
3,828 (46.97%)Christine Waddell
1,202 (14.75%)Paul Hesse
2,488 (30.53%)Gerald Enns
511 (6.27%)Frank Komarniski (Communist)
29 (0.36%)
Ron Nash (Ind)
92 (1.13%)Tim Sale† Lord Roberts Diane McGifford
4,499 (57.86%)Wilf Makus
1,367 (17.58%)Larry Schenkeveld
1,219 (15.68%)Vere Scott
655 (8.42%)Diane McGifford Minto Andrew Swan
3,355 (62.82%)Kenny Daodu
658 (12.32%)Wayne Helgason
1,158 (21.68%)Cheryl-Anne Carr (Communist)
102 (1.91%)Andrew Swan River Heights Fiona Shiells
1,843 (19.77%)Ashley Burner
2,341 (25.11%)Jon Gerrard
4,760 (51.06%)Christine Bennet-Clark
378 (4.05%)Jon Gerrard Wolseley Rob Altemeyer
4,005 (63.88%)Gustav Nelson
712 (11.44%)Raven Thundersky
700 (11.31%)Ardythe Basham
761 (12.07%)David Tymoshchuk (Communist)
82 (1.30%)Rob Altemeyer Totals NDP
17,530 (47.71%)PC
6,279 (17.09%)Liberal
10,325 (28.10%)Green
2305 (6.27%)Others
305 (0.83%)South Winnipeg
Electoral District Candidates Incumbent NDP PC Liberal Green Other Fort Garry Kerri Irvin-Ross
4,291 (52.60%)Shaun McCaffrey
2,101 (25.75%)Craig Hildahl
1,500 (18.39%)Alon Weinberg
264 (3.26%)Kerri Irvin-Ross Fort Whyte Sunny Dhaliwal
3,895 (33.83%)Hugh McFadyen
5,981 (51.95%)Angelina Olivier-Job
1,637 (14.22%)Hugh McFadyen Riel Christine Melnick
4,894 (57.19%)Trudy Turner
2,620 (30.69%)Grant Woods
1,024 (11.99%)Christine Melnick Seine River Theresa Oswald
5,786 (56.89%)Steven Andjelic
3,275 (32.20%)Jennifer Lukovich
1,111 (14.68%)Theresa Oswald Southdale Erin Selby
5,772 (51.04%)Jack Reimer
4,493 (39.74%)Don Woodstock
1,042 (9.22%)Jack Reimer St. Norbert Marilyn Brick
4,044 (53.74%)Tara Brousseau
2,404 (31.94%)Wendy Bloomfield
1,077 (14.31%)Marilyn Brick St. Vital Nancy Allan
4,611 (61.74%)Grant Cooper
1,754 (23.41%)Harry Wolbert
776 (10.36%)Kristine Koster
351 (4.68%)Nancy Allan Totals NDP
33,293 (53.63%)PC
20,008 (32.23%)Liberal
8,167 (13.15%)Green
615 (0.99%)External links
- CBC: Manitoba votes 2007
- Election Almanac - Manitoba Provincial Election
- Elections Manitoba
- Manitoba legislature
- Manitoba Government
References
- ^ Geoffrey York, "Doer captures NDP helm in tight Manitoba race", Globe and Mail, 31 March 1988, A1.
- ^ "Official Results - 39th General Election". Elections Manitoba. http://www.electionsmanitoba.ca/en/Results/general_election_39_static.html. Retrieved November 30, 2010.
 Elections in Manitoba
General elections Politics of Manitoba Lieutenant Governor Philip S. Lee • Former Lieutenant-Governors
Premier Opposition Leader Speaker of the Assembly Legislature Current assembly • Former legislatures • CabinetPolitical parties Elections 2007 election • Past elections • Manitoba electoral districtsCurrent issues noneOther Canadian politics  Elections in Canada
Most recent Future elections Lists Electoral districts - Federal
- BC
- AB
- SK
- MB
- ON
- QC
- NB
- NS
- PE
- NL
- YU
- NT
- NU
 The Politics of Canada portalCategories:
- 2007 elections in Canada
- Elections in Manitoba


Wikimedia Foundation. 2010.