- Buddhabrot
-
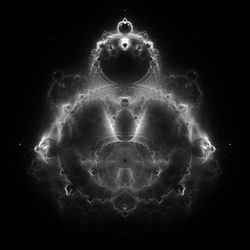
 A Buddhabrot iterated to 20,000 times.
The Buddhabrot is a map related to the Mandelbrot set. Its name reflects its similarity to classical depictions of Gautama Buddha, seated in a meditation pose with a forehead mark (tikka) and traditional topknot (ushnisha).
Contents
Discovery
The Buddhabrot rendering technique was discovered and later described in a 1993 Usenet post to sci.fractals[1] by Melinda Green.[2]
Previous researchers had come very close to finding the precise Buddhabrot technique. In 1988 Linas Vepstas relayed similar images to Cliff Pickover for inclusion in Pickover's forthcoming book Computers, Pattern, Chaos, and Beauty. This led directly to the discovery of pickover stalks. These researchers did not filter out non-escaping trajectories required to produce the ghostly forms typically reminiscent of Hindu art. Green first named it Ganesh, since an Indian co-worker "instantly recognized it as the god 'Ganesha' which is the one with the head of an elephant."[1] The name Buddhabrot was coined later by Lori Gardi.[3]
Rendering method
Mathematically, the Mandelbrot set consists of the set of points c in the complex plane for which the iteratively defined sequence
where z0 = 0 does not tend to infinity.
The Buddhabrot is rendered by first creating a 2-dimensional array of counters, each counter corresponding to a final pixel of the image and initialized to zero. Then, a random sampling of c points are iterated through the Mandelbrot function. For points which do escape within a chosen maximum number of iterations, and therefore are not in the Mandelbrot set, their values are sent through the Mandelbrot function again and this time its path is plotted into the array. After a large number of c values have been iterated, grayscale shades are then chosen based on the values recorded in the array. The result is a density plot highlighting regions where z values spend the most time on their way to infinity. This could also be thought of as a probability distribution where the bright regions correspond to regions of high probability (of trajectories passing through the region) and the dark regions correspond to regions of low probability.
 Nebulabrot
 Anti-Buddhabrot
Nuances
Rendering Buddhabrot images is typically more computationally intensive than standard Mandelbrot rendering techniques. This is partly due to requiring more random points to be iterated than pixels in the image in order to build up a sharp image. Rendering highly zoomed areas requires even more computation than for standard Mandlebrot images in which a given pixel can be computed directly regardless of zoom level. Conversely, a pixel in a zoomed region of a Buddhabrot image can be affected by initial points from regions far outside the one being rendered. Without resorting to more complex probabilistic techniques, rendering zoomed portions of Buddhabrot consists of merely cropping a large full sized rendering.
The number of iterations chosen has a large effect on the image — higher values give sparser more detailed appearance, as a few of the points pass through a large number of pixels before they escape, resulting in their paths being more prominent. If a lower number of iterations was used, these points would not escape in time and would be regarded as not escaping at all.
Green later realized that this provided a natural way to create color Buddhabrot images by taking three such grayscale images, differing only by the maximum number of iterations used, and combining them into a single color image using the same method used by astronomers to create false color images of nebula and other celestial objects. For example one could assign a 2,000 max iteration image to the red channel, a 200 max iteration image to the green channel, and a 20 max iteration image to the blue channel of an image in an RGB color space. Some have labelled Buddhabrot images using this technique Nebulabrots.
It has also been discovered that plotting only the paths for points which do not escape until some minimum number of iterations (for example 1,000 or 1,000,000) will lead to interesting images containing only the more detailed parts of the Buddhabrot.[4]
Another technique which it is natural to consider is to plot the paths for points c which are in the Mandelbrot set; a sort of Anti-Buddhabrot.

Maximum iterations: 20

Maximum iterations: 100
Maximum iterations: 1,000
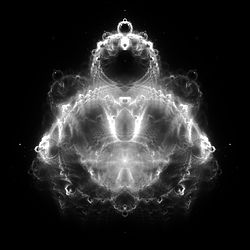
Maximum iterations: 20,000

Maximum iterations: 1,000,000 Relation to the Logistic Map
 The Buddhabrot and its logistic map.
 Animation depicting the Buddhabrot and its logistic map.
The relationship between the Mandelbrot set as defined by the iteration z2 + c, and the logistic map λx(1 − x) is well known. The two are related by the quadratic transformation:

The traditional way of illustrating this relationship is aligning the logistic map and the Mandelbrot set through the relation between cr and λ, using a common x-axis and a different y-axis, showing a one dimensional relationship.
Melinda Green discovered 'by accident' that the Anti-Buddhabrot paradigm fully integrates the logistic map. Both are based on tracing paths from non-escaping points, iterated from a (random) starting point, and the iteration functions are related by the transformation given above. It is then easy to see that the Anti-Buddhabrot for z2 + c, plotting paths with c = (random,0) and z0 = (0,0), simply generates the logistic map in the plane {cr,zr}, when using the given transformation. For rendering purposes we use z0 = (random,0). Remember that in the logistic map all zr0 ultimately generate the same path.
Because both the Mandelbrot set and the logistic map are an integral part of the Anti-Buddhabrot we can now show a 3D relationship between both, using the 3D axes {cr,ci,zr}. The animation shows the classic Anti-Buddhabrot with c = (random,random) and z0 = (0,0), this is the 2D Mandelbrot set in the plane {cr,ci}, and also the Anti-Buddhabrot with c = (random,0) and z0 = (0,0), this is the 2D logistic map in the plane {cr,zr}. We rotate the plane {ci,zr} around the cr-axis, first showing {cr,ci}, then rotating 90° to show {cr,zr}, then rotating an extra 90° to show {cr, − ci}. We could rotate an extra 180° but this gives the same images, mirrored around the cr-axis.
The logistic map Anti-Buddhabrot is in fact a subset of the classic Anti-Buddhabrot, situated in the plane {cr,zr} (or ci = 0) of 3D {cr,ci,zr}, perpendicular to the plane {cr,ci}. We emphasize this by showing briefly, at 90° rotation, only the projected plane ci = 0, not 'disturbed' by the projections of the planes with non-zero ci.
References
- ^ a b Daniel Green The deity hiding in the m-set
- ^ Melinda Green The Buddhabrot Technique
- ^ The University of Western Ontario’s newspaper Chaos (theory) rules for software developer(PDF12MB), p. 10
- ^ "Rendering a ridiculously large Buddhabrot". July 2, 2010. http://erleuchtet.org/2010/07/ridiculously-large-buddhabrot.html. Retrieved 1 June 2011.
External links
Categories:- Fractals


Wikimedia Foundation. 2010.