- Demand curve
-
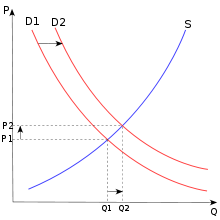 An example of a demand curve shifting
In economics, the demand curve is the graph depicting the relationship between the price of a certain commodity, and the amount of it that consumers are willing and able to purchase at that given price. It is a graphic representation of a demand schedule.[1] The demand curve for all consumers together follows from the demand curve of every individual consumer: the individual demands at each price are added together.
Demand curves are used to estimate behaviors in competitive markets, and are often combined with supply curves to estimate the equilibrium price (the price at which sellers together are willing to sell the same amount as buyers together are willing to buy, also known as market clearing price) and the equilibrium quantity (the amount of that good or service that will be produced and bought without surplus/excess supply or shortage/excess demand) of that market.[2] In a monopolistic market, the demand curve facing the monopolist is simply the market demand curve.
Contents
Characteristics
According to convention, the demand curve is drawn with price on the vertical axis and quantity on the horizontal axis. The function actually plotted is the inverse demand function.
The demand curve usually slopes downwards from left to right; that is, it has a negative association (for two theoretical exceptions, see Veblen good and Giffen good). The negative slope is often referred to as the "law of demand", which means people will buy more of a service, product, or resource as its price falls. The demand curve is related to the marginal utility curve, since the price one is willing to pay depends on the utility. However, the demand directly depends on the income of an individual while the utility does not. Thus it may change indirectly due to change in demand for other commodities.
Demand schedule
See also: Market demand scheduleA demand schedule is a table that lists the quantity of a good a person will buy at each different price[1] The demand curve is a graphical depiction of the relationship between the price of a good and the quantity of the good that a consumer would demand under certain time, place and circumstances. The demand relationship can also be expressed mathematically: Q = f(P; Y, Prg, Pop, X) where Q is quantity demanded, P is the price of the good, Prg is the price of a related good, Y is income, Pop is population and X is the expectation of some relevant future variable such as the future price of the product. The semi-colon means that the arguments to its right are held constant when the relationship is plotted two-dimensionally in (price, quantity) space. If one of these other variables changes the demand curve will shift. For example, if the population increased then there would be an outward (rightward) shift of the demand curve, since more consumers would mean higher demand. This shift is referred to as a change in demand and results from a change in the constant term. Movements along the demand curve occur only when quantity demanded changes in response to a change in price.
Linear demand curve
The demand curve is often graphed as a straight line of the form Q = a - bP where a and b are parameters. The constant “a” “embodies” the effects of all factors other than price that affect demand. If for example income were to change the effect of the change would be represented by a change in the value of a and be reflected graphically as a shift of the demand curve. The constant “b” is the slope of the demand curve and shows how the price of the good affects the quantity demanded.[3]
The graph of the demand curve uses the inverse demand function in which price is expressed as a function of quantity. The standard form of the demand equation can be converted to the inverse equation by solving for P or P = a/b - Q/b.[3]
More plainly, in the equation P = a - bQ, "a" is the intercept where quantity demanded is zero (where the demand curve intercepts the Y axis), "b" is the slope of the demand curve, "Q" is quantity and "P" is price.
Shift of a demand curve
The shift of a demand curve takes place when there is a change in any non-price determinant of demand, resulting in a new demand curve.[4] Non-price determinants of demand are those things that will cause demand to change even if prices remain the same—in other words, the things whose changes might cause a consumer to buy more or less of a good even if the good's own price remained unchanged.[5] Some of the more important factors are the prices of related goods (both substitutes and complements), income, population, and expectations. However, demand is the willingness and ability of a consumer to purchase a good under the prevailing circumstances; so, any circumstance that affects the consumer's willingness or ability to buy the good or service in question can be a non-price determinant of demand. As an example, weather could be a factor in the demand for beer at a baseball game.
When income rises, the demand curve for normal goods shifts outward as more will be demanded at all prices, while the demand curve for inferior goods shifts inward due to the increased attainability of superior substitutes. With respect to related goods, when the price of a good (e.g. a hamburger) rises, the demand curve for substitute goods (e.g. chicken) shifts out, while the demand curve for complementary goods (e.g. tomato sauce) shifts in (i.e. there is more demand for substitute goods as they become more attractive in terms of value for money, while demand for complementary goods contracts in response to the contraction of quantity demanded of the underlying good).[4]
Demand shifters
- Changes in disposable income
- Changes in tastes and preferences - tastes and preferences are assumed to be fixed in the short-run. This assumption of fixed preferences is a necessary condition for aggregation of individual demand curves to derive market demand.
- Changes in expectations.
- Changes in the prices of related goods (substitutes and complements)
- Population size and composition
Changes that increase demand
Some circumstances which can cause the demand curve to shift out include:
- increase in price of a substitute
- decrease in price of complement
- increase in income if good is a normal good
- decrease in income if good is an inferior good
Changes that decrease demand
Some circumstances which can cause the demand curve to shift in include:
- decrease in price of a substitute
- increase in price of a complement
- decrease in income if good is normal good
- increase in income if good is inferior good
Factors affecting market demand
Market or aggregate demand is the summation of individual demand curves. In addition to the factors which can affect individual demand there are three factors that can affect market demand (cause the market demand curve to shift):
- a change in the number of consumers,
- a change in the distribution of tastes among consumers,
- a change in the distribution of income among consumers with different tastes.[6]
Movement along a demand curve
There is movement along a demand curve when a change in price causes the quantity demanded to change.[4] It is important to distinguish between movement along a demand curve, and a shift in a demand curve. Movements along a demand curve happen only when the price of the good changes.[7] When a non-price determinant of demand changes the curve shifts. These "other variables" are part of the demand function. They are "merely lumped into intercept term of a simple linear demand function." [7] Thus a change in a non-price determinant of demand is reflected in a change in the x-intercept causing the curve to shift along the x axis.[8]
Discreteness of amounts
If a commodity is sold in whole units, and these are substantial for a consumer, then the individual demand curve can hardly be approximated by a continuous curve. It is a set function of the price, defined by a price above which no unit is bought, a price range for which one is bought, etc.
Units of measurement
If the local currency is dollars, for example, then the units of measurement of the variable "price" are "dollars per unit of the good" and the units of measurement of "quantity" are "units of the good per time (e.g., per week or per year). Thus quantity demanded is a flow variable.
Price elasticity of demand (PED)
Main article: Price elasticity of demandPED is a measure of the sensitivity of the quantity variable, Q, to changes in the price variable, P. Elasticity answers the question of how much the quantity will change in percentage terms for a 1% change in the price, and is thus important in determining how revenue will change.
The elasticity of demand indicates how sensitive the demand for a good is to a price change. If the PED is between zero and 1 demand is said to be inelastic, if PED equals 1, the demand is unitary elastic and if the PED is greater than 1 demand is elastic. A low coefficient implies that changes in price have little influence on demand. A high elasticity indicates that consumers will respond to a price rise by buying a lot less of the good and that consumers will respond to a price cut by buying a lot more.
Taxes and subsidies
A sales tax on the commodity does not directly change the demand curve, if the price axis in the graph represents the price including tax. Similarly, a subsidy on the commodity does not directly change the demand curve, if the price axis in the graph represents the price after deduction of the subsidy.
If the price axis in the graph represents the price before addition of tax and/or subtraction of subsidy then the demand curve moves inward when a tax is introduced, and outward when a subsidy is introduced.
See also
- Demand (economics)
- Feasibility condition
- Supply and demand
- Effect of taxes and subsidies on price
- Price point
- Wikiversity:Building the demand curve
- Inverse demand function
References
- ^ a b O'Sullivan, Arthur; Steven M. Sheffrin (2003). Economics: Principles in action. Upper Saddle River, New Jersey 07458: Pearson Prentice Hall. pp. 81–82. ISBN 0-13-063085-3. http://www.pearsonschool.com/index.cfm?locator=PSZ3R9&PMDbSiteId=2781&PMDbSolutionId=6724&PMDbCategoryId=&PMDbProgramId=12881&level=4.
- ^ Krugman, Paul, and Wells, Robin. Microeconomics. Worth Publishers, New York. 2005.
- ^ a b Besanko and Braeutigam (2005) p/ 91.
- ^ a b c Case, K.E., Fair, R.C. (1994). 'Demand, Supply, and Market Equilibrium', Chapter 4 in Principles of Economics, 3rd ed., Prentice Hall Englewood Cliffs, New Jersey
- ^ http://www.harpercollege.edu/mhealy/eco212i/lectures/s&d/s&d.htm
- ^ Binger, B & Hoffman, E.: Microeconomics with Calculus, 2nd ed. Addison-Wesley 1998. A change in relative price changes the distribution of income which in turn changes the demand curve.
- ^ a b Underwood, Instructor’s Manual, Microeconomics 5th ed. (Prentice-Hall 2001) at 5.
- ^ The x intercept is affected because the standard diagram uses the inverse demand function
Microeconomics Major topics Aggregation · Budget · Consumer · Convexity and non-convexity · Cost · Cost-benefit analysis · Distribution · Deadweight loss · Income–consumption curve · Duopoly · Equilibria · Economies of scale · Economies of scope · Elasticity · Exchange · Expected utility · Externality · Firms · General equilibria · Household · Information · Indifference curve · Intertemporal choice · Marginal cost · Market failure · Market structure · Monopoly · Monopsony · Oligopoly · Opportunity cost · Preferences · Prices · Production · Profit · Public goods · Returns to scale · Risk · Scarcity · Shortage · Social choice · Sunk costs · Supply & demand · Surplus · Uncertainty · Utility · WelfareRelated Behavioral · Business · Computational · Decision theory · Econometrics · Experimental · Game theory · Industrial organization · Mathematical economics · Microfoundations of Macroeconomics · Managerial · Operations research · OptimizationCategories:- Economics curves
- Demand

Wikimedia Foundation. 2010.