- Demographics of South Africa
-
Demographics of South Africa 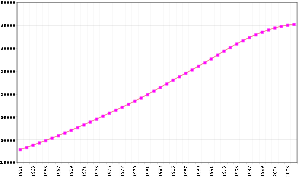
Population of South Africa, 1961–2008Population: 49,991,300 (July 2010 est.)[1] Growth rate: -0.051%[2] Birth rate: 19.61 births/1,000 population (2010 est.) Death rate: 16.99 deaths/1,000 population (2010 est.) Life expectancy: 49.2 years (2010 est.) –male: 50.08 years (2010 est.) –female: 48.29 years (2010 est.) Fertility rate: 2.33 children born/woman (2010 est.) Infant mortality rate: 43.78 deaths/1,000 Age structure: 0-14 years: 28.9% (male 7,093,328/female 7,061,579) 15-64 years: 65.8% (male 16,275,424/female 15,984,181) 65-over: 5.4% (male 1,075,117/female 1,562,860) (2010 est.) Sex ratio: Total: 0.99 male(s)/female (2010 est.) At birth: 1.02 male(s)/female Under 15: 1 male(s)/female 15-64 years: 1.02 male(s)/female 65-over: 0.68 male(s)/female Nationality: Nationality: South African Language: Official: See Languages of South Africa The demographics of South Africa encompasses about 50 million people of diverse origins, cultures, languages, and religions. The last census was held in 2001 and the next will be in 2011.
Even though the population of South Africa has increased in the past decade[3][4] (primarily due to immigration), the country had an annual population growth rate of −0.051% in 2010 (CIA est.), where the birth rate is higher than the death rate but there is a net emigration rate.[5][6] South Africa is home to an estimated 5 million illegal immigrants, including some 3 million Zimbabweans.[7][8][9] A series of anti-immigrant riots occurred in South Africa beginning on 11 May 2008.[10][11]
Contents
Ethnic groups
 Population density in South Africa
 Dominant population groups in South Africa.Black AfricanColouredIndian or AsianWhiteNone dominant
Statistics South Africa provided five racial categories by which people could classify themselves, the last of which, "unspecified/other" drew negligible responses, and these results were omitted.[3] The 2010 midyear estimated figures for the other categories were Black African at 79.4%, White at 9.2%, Coloured at 8.8%, and Indian or Asian at 2.6%.[12] The first census in South Africa in 1911 showed that whites made up 22% of the population; it declined to 16% in 1980.[13]
Blacks
See also: Bantu peoplesBy far the major part of the population classified itself as African or black, but it is not culturally or linguistically homogeneous. Major ethnic groups include the Zulu, Xhosa, Basotho (South Sotho), Bapedi (North Sotho), Venda, Tswana, Tsonga, Swazi and Ndebele, all of which speak Bantu languages.
Some, such as the Zulu, Xhosa, Bapedi and Venda groups, are unique to South Africa. Other groups are distributed across the borders with neighbours of South Africa: The Basotho group is also the major ethnic group in Lesotho. The Tswana ethnic group constitute the majority of the population of Botswana. The Swazi ethnic group is the major ethnic group in Swaziland. The Ndebele ethnic group is also found in Matabeleland in Zimbabwe, where they are known as the Matabele. These Ndebele people are the descendants of a Zulu faction under the warrior Mzilikazi that escaped persecution from Shaka by migrating to their current territory. The Tsonga ethnic group is also found in southern Mozambique, where they are known as the Shangaan.
Demographics
As of the calculations of 2004, there are 35,416,164 Black Africans and 8,625,050 Black African households residing in South Africa. The Black South African population density is 29/km². The density of Black households is 7/km². Black South Africans make up 79.0% of the total population. The percentage of all Black South African households that are made up of individuals is 19.9%. The average Black household size is 4.11 members.
In South Africa, the Black population is spread out with 34.0% under the age of 15, 21.6% from 15 to 24, 28.3% from 25 to 44, 11.8% from 45 to 64, and 4.3% who are 65 years of age or older. The median age of a Black African is 21 years. For every 100 Black females there are 91.1 Black males. For every 100 Black females age 18 and over, there are 86.2 Black males.
With regard to education, 22.3% of Black aged 20 and over have received no schooling, 18.5% have had some primary, 6.9% have completed only primary school, 30.4% have had some high education, 16.8% have finished only high school, and 5.2% have an education higher than the high school level. Overall, 22.0% of Black Africans have completed high school.
The percentage of Black South African housing units having a telephone and/or mobile phone in the dwelling is 31.1%. The percentage having access to a nearby phone is 57.2%, and 11.7% do not have nearby access or any access. The percentage of Black African households that have a flush or chemical toilet is 41.9%. Refuse is removed from 45.3% of Black African households by the municipality at least once a week, and 11.0% have no rubbish disposal. Some 17.9% of Black Africans have running water inside their dwelling, 51.7% have running water on their property, and 80.2% have access to running water. The percentage of Black African households using electricity for cooking is 39.3%, for heating, 37.2%, and for lighting, 62.0%. Radios are owned by 68.7% of Black African households while 44.2% have a television, 1.8% own a computer, 40.0% have a refrigerator, and 24.6% have a mobile phone.
The unemployment rate of the Black population aged 15–65 is 28.1%. The median annual income of Black working adults aged 15–65 is ZAR 12,073. Black African males have a median annual income of ZAR 14,162 versus ZAR 8,903 for Black African females.
Whites
Main article: White South AfricanThe white population is not ethnically homogeneous and descends from many ethnic groups: Dutch, Flemish, British, French Huguenot, Portuguese, German, Irish, Greek, Polish, and Italian. Culturally and linguistically, they are divided into the Afrikaners, who speak Afrikaans, and English-speaking groups, many of whom are descended from British and Irish immigrants (see Anglo-African). Many small communities that have immigrated over the last century retain the use of other languages. There is also a substantial (though decreased) Jewish population, the majority of whom came from Lithuania at the turn of the 20th century; though others came then and later from Great Britain, the former Soviet Union and Israel[citation needed]. The white population has until recently been on the decrease due to a low birth rate and emigration; as a factor in their decision to emigrate, many cite the high crime rate and the affirmative action policies of the government.[14][15] Since 1994, approximately 440,000 white South Africans have permanently emigrated.[12]
Despite high emigration levels, a high level of non-South African white immigrants have settled in the country, in particular from countries such as Britain and Zimbabwe. For example, by 2005, an estimated 212,000 British citizens were residing in South Africa. Since 2003, the numbers of British migrants coming to South Africa has risen by 50%. An estimated 20,000 British migrants moved to South Africa in 2007. There have also been a significant number of white Zimbabwean arrivals, fleeing their home country in light of the economic and political problems currently facing the country. As well as recent arrivals, a significant number of white Zimbabweans emigrated to South Africa in the wake of independence in Zimbabwe in 1980. Some of the more nostalgic members of the community are known in popular culture as "Whenwes", because of their nostalgia for their lives in Rhodesia "when we were in Rhodesia".[16]
There have been other white immigration waves to South Africa in recent decades. In the 1970s, many Portuguese residents of African colonies such as Angola and Mozambique, came to live in South Africa after the independence of those nations. In addition, the apartheid government encouraged Central European immigration in the 1980s and early 1990s, particularly from Poland and Hungary.
Demographics
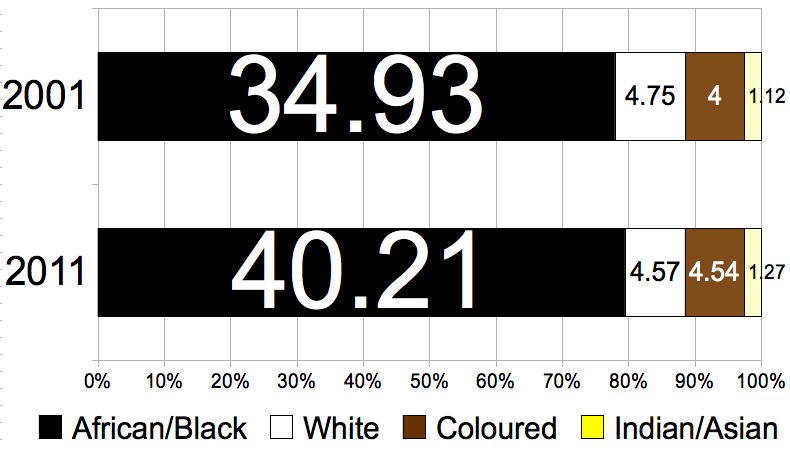
 Ethnic groups, 2001–2011
As of the census of 2001, there are 4,293,638 Whites and 1,409,690 White households residing in South Africa. The White population density is 4/km². The density of White households is 1.16/km². Whites make up 9.6% of the total population.
The percentage of all White households that are made up of individuals is 19.1%. The average White household size is 3.05 members. In South Africa, the White population is spread out with 19.0% under the age of 15, 15.1% from 15 to 24, 31.0% from 25 to 44, 23.8% from 45 to 64, and 11.1% who are 65 years of age or older. The median age of a White is 35 years. For every 100 White females there are 94.0 White males. For every 100 White females age 18 and over, there are 91.1 White males.
With regard to education, 1.4% of Whites aged 20 and over have received no schooling, 1.2% have had no more than some primarying, 0.8% have completed only primary school, 25.9% have had no more than some high education, 40.9% have finished only high school, and 29.8% have an education higher than the high-school level. Overall, 70.7% of Whites have completed high school.
The percentage of White housing units having a telephone and/or mobile phone in the dwelling is 95.4%. The percentage having access to a nearby phone is 4.4%, and 0.2% do not have nearby access or any access. The percentage of White households that have a flush or chemical toilet is 98.7%. Refuse is removed from 90.8% of White households by the municipality at least once a week, and 0.5% have no rubbish disposal. Some 87.2% of White have running water inside their dwelling, 95.6% have running water on their property, and 99.4% have access to running water. The percentage of White households using electricity for cooking is 96.6%, for heating, 93.2%, and for lighting, 99.2%. Radios are owned by 94.7% of White households while 92.6% have a television, 46.0% own a computer, 97.6% have a refrigerator, and 74.6% have a mobile phone.
The unemployment rate of the White population aged 15–65 is 4.1%. The median annual income of White working adults aged 15–65 is ZAR 65,000 White males have a median annual income of ZAR 81,701 versus ZAR 52,392 for White females.
Coloureds
Main article: ColouredThe term "coloured" is still used for the people of mixed race descended from slaves brought in from East and Central Africa, the indigenous Khoisan who lived in the Cape at the time, Bantus, Whites (mostly the Dutch/Afrikaner and British settlers) as well as an admixture of Javanese, Malay, Indian, Malagasy and Asian blood. The majority speak Afrikaans. Khoisan is a term used to describe two separate groups, physically similar: light-skinned and small in stature. The Khoikhoi, who were called Hottentots by the Europeans, were pastoralists and extensively integrated into the colonial economy, many converting early to Christianity; the San, called Bushmen by the Europeans, were hunter-gatherers. Within the Coloured community, more recent immigrants will also be found: Coloureds from the former Rhodesia (now Zimbabwe); Namibia and immigrants of mixed descent from India(Anglo-Indians) who were welcomed to the Cape when India and Burma received their Independence.
Asians/Indians
Main articles: Asian South African and Indian South AfricanThe major part of the South African Asian population is Indian in origin (see Indian South Africans); many of them descended from indentured workers brought in the nineteenth century to work on the sugar plantations of the eastern coastal area then known as Natal. Serious riots in Durban between Indians and Zulus erupted in 1949.[17] There is also a significant group of Chinese South Africans (approximately 100,000 individuals) and Vietnamese South Africans (approximately 50,000 individuals). In 2008, the Pretoria High Court has ruled that Chinese South Africans who arrived before 1994 are to be reclassified as Coloureds. As a result of this ruling, about 12,000–15,000[18] ethnically Chinese citizens who arrived before 1994, numbering 3%–5% of the total Chinese population in the country, will be able to benefit from government BEE policies.[19]
Religion
Main article: Religion in South AfricaAccording to the 2001 national census, Christians accounted for 79.7% of the population. This includes Zion Christian (11.1%), Pentecostal (Charismatic) (8.2%), Roman Catholic (7.1%), Methodist (6.8%), Dutch Reformed (6.7%), Anglican (3.8%); members of other Christian churches accounted for another 36% of the population. Muslims accounted for 1.5% of the population, Hindus about 1.3%, and Jews 0.2%. 15.1% had no religious affiliation, 2.3% were classified as other and 1.4% were unspecified.[2][20][21]
African Indigenous Churches made up the largest of the Christian groups. Some believe that many people claiming no affiliation with any organised religion adhered to traditional indigenous religions. Many people have syncretic religious practices combining Christian and indigenous influences.[22]
Muslims are largely found among the Coloured and Indian ethnic groups. They have been joined by black or white South African converts as well as immigrants from other parts of Africa.[23] South African Muslims claim that their faith is the fastest-growing religion of conversion in the country, with the number of black Muslims growing sixfold, from 12 000 in 1991 to 74 700 in 2004[23][24]
The Hindu population has its roots in the British colonial period, but later waves of immigration from India have also contributed to it. Most Hindus are ethnically South Asian but there are many who come from mixed racial stock. Some are converts due to the efforts of Hindu missionaries such as ISKCON.
Other minority religions in South Africa are Sikhism, Jainism and Bahá'í Faith.[20]
By ethnicity
79.9% of Black residents are Christian, 17.5% have no religion, 0.2% are Muslim, 0.0% are Jewish, 0.0% are Hindu and 2.3% have other or undetermined beliefs.
86.8% of White residents are Christian, 8.8% have no religion, 0.2% are Muslim, 1.4% are Jewish, and 0.0% are Hindu. 2.7% have other or undetermined beliefs.
Languages
Main article: Languages of South AfricaSouth Africa has eleven official languages:[25] Afrikaans, English, Ndebele, Northern Sotho, Sotho, Swazi, Tswana, Tsonga, Venda, Xhosa and Zulu. In this regard it is third only to Bolivia and India in number. While all the languages are formally equal, some languages are spoken more than others. According to the 2001 National Census, the three most spoken first home languages are Zulu (23.8%), Xhosa (17.6%) and Afrikaans (13.3%).[3] Despite the fact that English is recognised as the language of commerce and science, it was spoken by only 8.2% of South Africans at home in 2001, an even lower percentage than in 1996 (8.6%).[3]
The country also recognises several unofficial languages, including Fanagalo, Khoe, Lobedu, Nama, Northern Ndebele, Phuthi, San and South African Sign Language.[26] These unofficial languages may be used in certain official uses in limited areas where it has been determined that these languages are prevalent. Nevertheless, their populations are not such that they require nationwide recognition.
Many of the "unofficial languages" of the San and Khoikhoi people contain regional dialects stretching northwards into Namibia and Botswana, and elsewhere. These people, who are a physically distinct population from other Africans, have their own cultural identity based on their hunter-gatherer societies. They have been marginalised to a great extent, and many of their languages are in danger of becoming extinct.
Many white South Africans also speak other European languages, such as Portuguese (also spoken by black Angolans and Mozambicans), German, and Greek, while some Asians and Indians in South Africa speak South Asian languages, such as Tamil, Hindi, Gujarati, Urdu and Telugu. French is still widely spoken by French South Africans[citation needed] especially in places like Franschhoek, where many South Africans are of French origin. South African French is spoken by fewer than 10,000 individuals. Congolese French is also spoken in South Africa by migrants.
By ethnicity
0.7% of Black residents speak Afrikaans at home, 0.5% speak English, 2.0% speak Southern Ndebele, 22.3% speak Xhosa, 30.1% speak Zulu, 11.9% speak Northern Sotho, 10.0% speak Sesotho, 10.3% speak Tswana, 3.4% speak Swati, 2.9% speak Venda, and 5.6% speak Tsonga. 0.3% of the Black African population speaks a non-official language at home.
59.1% of White residents speak Afrikaans at home, 39.3% speak English, 0.5% speak another official language, and 1.1% speak a non-official language at home.
Immigration
 Main article: Immigration to South Africa
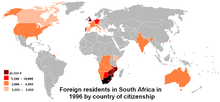
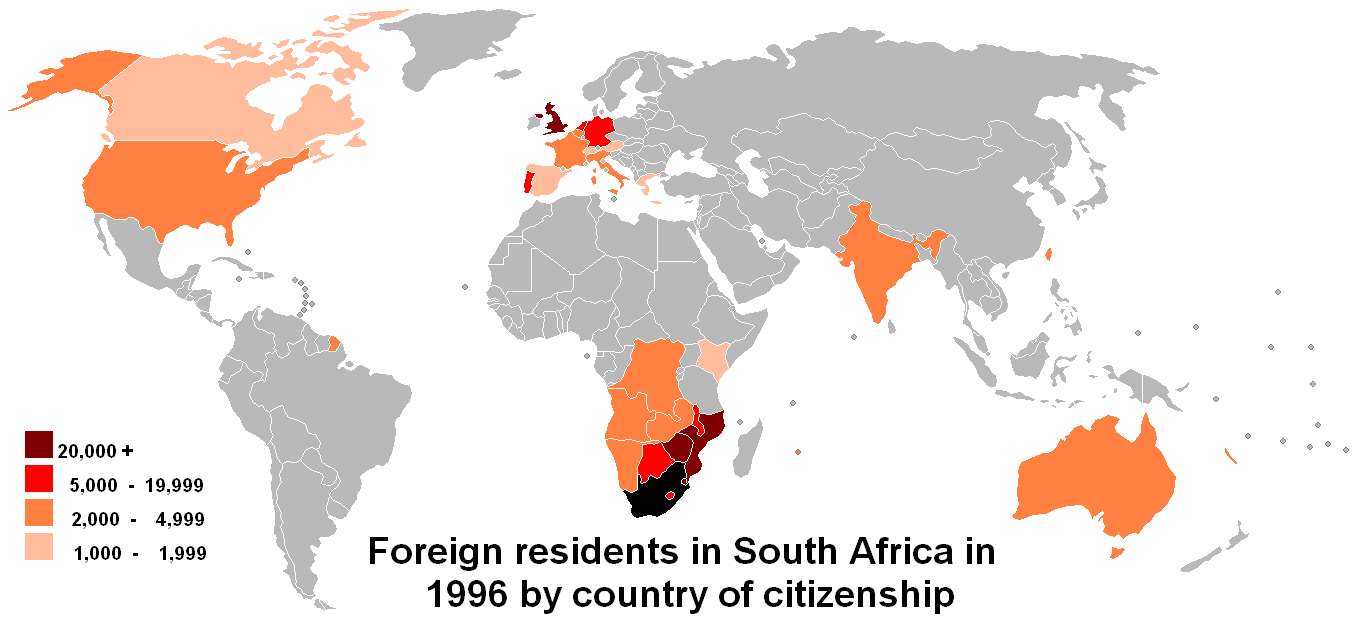
South Africa hosts a sizeable refugee and asylum seeker population. According to the World Refugee Survey 2008, published by the U.S. Committee for Refugees and Immigrants, this population numbered approximately 144,700 in 2007.[27] Groups of refugees and asylum seekers numbering over 10,000 included people from Zimbabwe (48,400), The Democratic Republic of the Congo (24,800), and Somalia (12,900).[27] These populations mainly lived in Johannesburg, Pretoria, Durban, Cape Town, and Port Elizabeth.[27] Many refugees have now also started to work and live in rural areas in provinces such as Mpumalanga and KwaZulu-Natal.
Statistics SA assumes in some of their calculations that there are less than 2 million immigrants in South Africa.[28] Other institutions, like the police and Médecins Sans Frontières place estimate the figure at 4 million.[29][30][31][32][33]
Largest municipalities
See also: Metropolitan municipality (South Africa)Graphs and maps
-

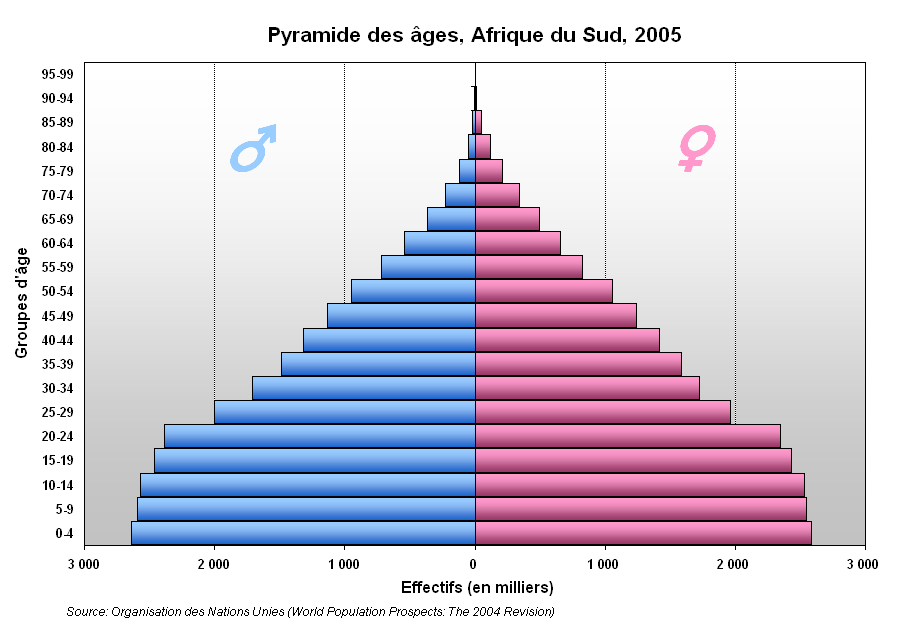
Population pyramid, 2005
-

Population pyramid by population group, 2011
-

Black population
-

White population
-

Coloured population
1904 Census
South African Population Figures for the 1904 Census. Source:[35]
Cape Colony Natal Transvaal Orange River Colony Total Percent Black 1,424,787 904,041 937,127 225,101 3,491,056 67.45% White 579,741 97,109 297,277 142,679 1,116,805 21.58% Coloured 395,034 6,686 24,226 19,282 445,228 8.6% Asiatic 10,242 100,918 11,321 253 122,734 2.37% Total 2,409,804 1,108,754 1,269,951 387,315 5,175,463 100% See also
- Statistics South Africa
- South African National Census of 2001
- South African National Census of 2011
- Afrikaans speaking population in South Africa
- Jewish population of South Africa
- Ethnic groups in South Africa by municipality
References
- ^ "Mid-year population estimates, 2010". Statistics South Africa. 20 July 2010. http://www.statssa.gov.za/PublicationsHTML/P03022010/html/P03022010.html. Retrieved July 23, 2011.
- ^ a b South Africa entry at The World Factbook
- ^ a b c d Census 2001, Statistics South Africa.
- ^ "Community Survey 2007" (PDF). http://www.statssa.gov.za/Publications/CS2007Basic/CS2007Basic.pdf.
- ^ CIA – The World Factbook – South Africa
- ^ "The demographic status of the world's population". Global Statistics. GeoHive. http://www.xist.org/earth/pop_growth.aspx.
- ^ "Anti-immigrant violence spreads in South Africa, with attacks reported in Cape Town". http://www.iht.com/articles/2008/05/23/africa/23saf.php.
- ^ "Escape From Mugabe: Zimbabwe's Exodus". http://news.sky.com/skynews/article/0,,30200-1277808,00.html.
- ^ "More illegals set to flood SA". http://www.fin24.com/articles/default/display_article.aspx?ArticleId=1518-25_2035097.
- ^ "South African mob kills migrants". BBC. 12 May 2008. http://news.bbc.co.uk/1/hi/world/africa/7396868.stm. Retrieved 19 May 2008.
- ^ Barry Bearak (23 May 2008). "Immigrants Fleeing Fury of South African Mobs". New York Times. http://www.nytimes.com/2008/05/23/world/africa/23safrica.html?_r=1&ref=africa&oref=slogin. Retrieved 5 August 2008.
- ^ a b "Midyear population estimates: 2010". Statistics South Africa. http://www.statssa.gov.za/publications/P0302/P03022010.pdf. Retrieved 23 July 2010.
- ^ Study Commission on U.S. Policy toward Southern Africa (U.S.) (1981). South Africa: time running out : the report of the Study Commission on U.S. Policy Toward Southern Africa. University of California Press. p. 42. ISBN 0520045475. http://books.google.com/books?id=sq43lnbklEUC&pg=PA42&dq#v=onepage&q=&f=false.
- ^ Unisa.
- ^ Policy Series, Queen’s University.
- ^ "Rhodie oldies". New Internationalist. 1985. http://www.newint.org/issue155/briefly.htm. Retrieved 29 October 2007.
- ^ Current Africa race riots like 1949 anti-Indian riots: minister. TheIndianStar.com. 26 May 2008.
- ^ Conason, Joe (19 June 2008). "Chinese declared black". Salon.com. http://www.salon.com/tech/htww/2008/06/19/chinese_declared_black/. Retrieved 30 May 2010.
- ^ We agree that you are black, South African court tells Chinese, The Times
- ^ a b "South Africa – Section I. Religious Demography". U.S. Department of State. http://www.state.gov/g/drl/rls/irf/2005/51496.htm. Retrieved 15 July 2006.
- ^ For a discussion of church membership statistics in South Africa please refer to Forster, D. "God's mission in our context, healing and transforming responses" in Forster, D and Bentley, W. Methodism in Southern Africa: A celebration of Wesleyan Mission. Kempton Park. AcadSA publishers (2008:97–98)
- ^ Department of State, USA.
- ^ a b "In South Africa, many blacks convert to Islam". http://www.csmonitor.com/2002/0110/p13s1-woaf.html.
- ^ "Muslims say their faith growing fast in Africa". Religionnewsblog.com. http://www.religionnewsblog.com/9398/muslims-say-their-faith-growing-fast-in-africa. Retrieved 7 November 2010.
- ^ "Constitution of South Africa, Chapter 1, Section 6". Fs.gov.za. http://www.fs.gov.za/Departments/SAC/Library/DEPART/lang_legislation1.htm. Retrieved 30 May 2010.[dead link]
- ^ "The languages of South Africa". SouthAfrica.info. 4 February 1997. http://www.southafrica.info/about/people/language.htm. Retrieved 7 November 2010.
- ^ a b c "World Refugee Survey 2008". U.S. Committee for Refugees and Immigrants. 19 June 2008. http://www.refugees.org/survey.
- ^ http://www.statssa.gov.za/PublicationsHTML/P03022009/html/P03022009_6.html
- ^ So where are Zimbabweans going?, BBC News. 8 November 2005.
- ^ SA population may be much larger than previously thought Beeld 1 June 2009.
- ^ Reference to 1996 HSRC study
- ^ South African Police Service 2009 Annual Report page 9 indicating the number exceeds 3 million
- ^ http://www.msf.org.za/viewnews.php?n=308
- ^ Statistics South Africa, Community Survey, 2007, Basic Results Municipalities (pdf-file) Retrieved on 2008-03-23.
- ^ Smuts I: The Sanguine Years 1870–1919, W.K. Hancock, Cambridge University Press, 1962, pg 219
External links
Ethnic groups in South Africa Bold denotes major ethnic groups.Blacks
(all Bantu)Sotho-TswanaOtherWhites Asians Coloureds Capoid  South Africa (Outline)
History TopicsGovernment Politics Constitution · President · Political parties · Social movements · Diplomatic missions · Elections · Military · Police · Foreign relationsGeography Provinces · Districts · Municipalities · Populated places · National parks · Wildlife · Islands · Rivers · Estuaries · Lakes · Forests · Mountain rangesEconomy History · Trade · Rand · Mining industry · Agriculture · Taxation · Tourism · Transportation · Stock exchange · CompaniesSociety TopicsCrime · Demographics · Education · Health care · Languages · South African English · Media · Public holidays · Religion · SportsDemographicsIssuesCrime · Gun politics · HIV/AIDS in South Africa · Human rights · Immigration · LGBT rights (Same-sex marriage) · Racism · Sexual violence · XenophobiaOther topics Demographics of Africa Sovereign
states- Algeria
- Angola
- Benin
- Botswana
- Burkina Faso
- Burundi
- Cameroon
- Cape Verde
- Central African Republic
- Chad
- Comoros
- Democratic Republic of the Congo
- Republic of the Congo
- Côte d'Ivoire (Ivory Coast)
- Djibouti
- Egypt
- Equatorial Guinea
- Eritrea
- Ethiopia
- Gabon
- The Gambia
- Ghana
- Guinea
- Guinea-Bissau
- Kenya
- Lesotho
- Liberia
- Libya
- Madagascar
- Malawi
- Mali
- Mauritania
- Mauritius
- Morocco
- Mozambique
- Namibia
- Niger
- Nigeria
- Rwanda
- São Tomé and Príncipe
- Senegal
- Seychelles
- Sierra Leone
- Somalia
- South Africa
- South Sudan
- Sudan
- Swaziland
- Tanzania
- Togo
- Tunisia
- Uganda
- Zambia
- Zimbabwe
States with limited
recognition- Sahrawi Arab Democratic Republic
- Somaliland
Dependencies and
other territories- Canary Islands / Ceuta / Melilla / Plazas de soberanía (Spain)
- Madeira (Portugal)
- Mayotte / Réunion (France)
- Saint Helena / Ascension Island / Tristan da Cunha (United Kingdom)
- Western Sahara
Categories:- Government departments of South Africa
- Demographics of South Africa
-


Wikimedia Foundation. 2010.