- Demographics of the Netherlands
-
Demographics of the Netherlands 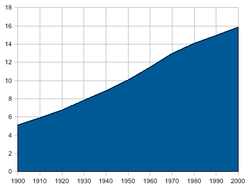
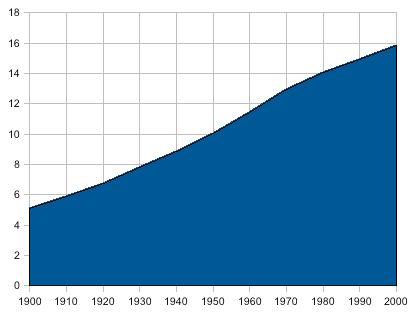
Population of Netherlands (1900-2000)Population: 16,783,092 (59th) Density: 397 per km² (27th) Growth rate: 0.39% (189th) Birth rate: 10.3 births/1,000 (161st) Death rate: 8.78 deaths/1,000 (77th) Life expectancy: 79.55 years (34th) –male: 76.94 years –female: 82.30 years Fertility rate: 1.80 (2010) children/woman Infant mortality rate: {{{infant_mortality}}} Age structure: 0-14 years: 17.4% 15-64 years: 67.7% 65-over: 14.9% Sex ratio: Total: 0.98 male/female At birth: 1.05 male/female Under 15: 1.05 male/female 15-64 years: 1.02 male/female 65-over: 0.75 male/female Nationality: Nationality: Dutch Major ethnic: Dutch 80.07% Minor ethnic: EU 5%
Indonesian 2.4%
Turkish 2.2%
Moroccan 2%
Surinamese 2.%
Netherlands Antilles/Aruba 0.83%
Other 8.36%Language: Official: Dutch, Frisian This article is about the demographic of the Netherlands, including population density, ethnicity, education level, health of the populace, economic status, religious affiliations and other aspects of the population.
Contents
Population size
The Netherlands is the 61st most populated country in the world and as of March 9, 2011 it has a population of 16,663,831.[1]
Between 1900 and 1950 the population had doubled from 5.1 to 10.0 million people. From 1951 to 2000 the population increased from 10.0 to 15.9 million people, making the relative increase smaller.[2]
Population density

The Netherlands is the twenty-seventh most densely populated country in the world. The 16,499,084[1] Dutch men and women are concentrated on an area of 41,526 km²;[3] this means that the country has a population density of 397 per km², or 487 per km² if only the land area, 33,883 km²,[3] is counted.
Bangladesh and South Korea are larger and more densely populated (hence have a larger population), and only Taiwan is smaller and has a larger population (hence a larger population density). There are 21 more countries (12 independent ones and 9 dependent territories) with a larger population density, but they all have a smaller population (hence a smaller area). If the water area is not counted then Taiwan is larger, and there are 16 more countries (9 independent ones and 7 dependent territories) with a larger population density.
As a result of these demographic characteristics the Netherlands has had to plan its land use strictly. Since 1946 the Ministry of Housing, Spatial Planning and the Environment has been occupied with the national coordination of land use. Because of its high population density the Netherlands has also reclaimed land from the sea by poldering. Between 1927 and 1968 an entire province, Flevoland was created. It currently houses 365,301 people. Because of these policies, the Dutch have been able to combine high levels of population density with extremely high levels of agricultural production.
Even though the Netherlands is so densely populated; there are no cities with a population over 1 million in the Netherlands. Instead 'four big cities' as they are called (Amsterdam, Rotterdam, The Hague and Utrecht) can in many ways be regarded as a single metropolitan area, the Randstad ('rim or edge city') with about 7 million inhabitants around an agricultural 'green heart' (het Groene Hart). The unity of this conurbation can be illustrated by the current idea effort to create a circular train system connecting the four cities.
Cities by population 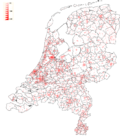
Population density in the Netherlands by neighbourhood as of 2007[4]Rank City Province Population (Urban Area) 1 Amsterdam North Holland 2,788,276 (2,871,870) 2 Rotterdam South Holland 1,854,645 (1,904,051) 3 Den Haag South Holland 850,373 (940,631) 4 Utrecht Utrecht 622,684 (670,484) 5 Eindhoven North Brabant 612,265 (730,480) 6 Tilburg North Brabant 278,065 (229,019) 7 Almere Flevoland 199,709 (-) 8 Groningen Groningen 197,338 (208,847) 9 Breda North Brabant 192,219 (194,708) 10 Nijmegen Gelderland 174,634 (-) 11 Enschede Overijssel 156,109 (-) 12 Apeldoorn Gelderland 156,415 (-) 2008 estimate[5][6] Births and deaths
Dutch population pyramid
(in % of total population)% Male Age Female % 0.36 85+ 1.05 0.60 80-84 1.18 1.14 75-79 1.74 1.55 70-74 1.95 1.93 65-69 2.13 2.30 60-64 2.33 2.77 55-59 2.69 3.73 50-54 3.60 3.65 45-49 3.54 3.93 40-44 3.81 4.27 35-39 4.08 4.25 30-34 4.05 3.63 25-29 3.54 3.04 20-24 2.93 2.96 15-19 2.83 3.11 10-14 2.97 3.20 05-09 3.06 3.11 00-04 2.98 Data: International Data Base (2000) The Dutch population is ageing. Furthermore, the life expectancy has increased because of developments in medicine, and in addition to this, the Netherlands has seen increasing immigration. These developments combined with the population boom after the Second World War has created extremely low population growth: in 2005 saw the lowest absolute population growth since 1900.
This has created a demographic problem with consequences for health care and social security policy. As the Dutch population ages, the number of people able to work, as a percentage of the entire population, decreases. Important policy advisors like the CBS and the CPB have predicted that this makes the current system of old age pensions problematic: fewer people will work to pay for old age pensions, while there will be more people receiving those pensions. Furthermore the costs of health care are also projected to increase. These developments have caused several cabinets, most notably the recent Second cabinet Balkenende to reform the system of health care and social security: increasing participation in the labour market and making people more conscious of the money they spend on health care.
In 2003, the birth rate was highest in the province of Flevoland (15.9). Total fertility rate (TFR) was highest in the province of Flevoland (2.0) and lowest in the province of Limburg (1.6). The municipality with the highest TFR was Urk (3.23) followed by Valkenburg (2.83), Graafstroom (2.79) and Staphorst (2.76). The lowest TFR were recorded in Vaals (1.11)and Thorn (1.21).[4]
The total population at December 31, 2006 was 16,356,914. The population loss due to net emigration was 35,502 (an estimated 40-50% of emigrants were ethnic non-Dutch).
In 2007, there were 117,000 immigrants(Including 7,000 Germans, 6,000 Poles, 5,000 Bulgarians, 3,000 Turks and 2,000 Moroccans) and 123,000 emigrants(Nearly half of emigrants were native Dutch, followed at a distance by nearly 5000 Poles and more than 3000 Germans). There was an observable increase in net-immigration from the former USSR, Bulgaria and Romania. [5]
The death rate were lowest in the municipalities of Valkenburg (2.9 per 1000), Zeewolde (3.2), Renswoude (3.4), Westervoort and Zeevang (both 3.9). The highest death rates were recorded in Warmond (22.3), Laren (19.9) and Doorn (18.8). [6]
16.4% of the total births in 2003 were to parents of non-European origin, although they account for only 12.4% of the population in the 25-34 age group. For example, 3.8% of the births were ethnic Moroccan, although they were only 2.26% of the 25-34 age group. Respective figures were 3.27% and 3.0% for Turks. The TFR for Moroccans in 2003 was 3.3 while the general TFR was 1.73. TFR was 2.3 for Turks, 1.7 for Surinamese, 1.8 for Arubans, 3.0 for Africans and 1.8 for Latin Americans. [7]
According to Statistics Netherlands, for the year 2007, TFR for those who were born in Netherlands was 1.72[7] (1.65 in 2000). TFR of Moroccan immigrants was 2.87 (3.22 in 2000) and that of Turkish immigrants was 1.88 (2.18 in 2000). [8]
Vital statistics since 1900 [8]
Average population (x 1000) Live births Deaths Natural change Crude birth rate (per 1000) Crude death rate (per 1000) Natural change (per 1000) 1900 5 142 162 611 92 043 70 568 31.6 17.9 13.7 1901 5 221 168 380 89 967 78 413 32.3 17.2 15.0 1902 5 305 168 728 86 248 82 480 31.8 16.3 15.5 1903 5 389 170 108 83 933 86 175 31.6 15.6 16.0 1904 5 470 171 495 87 091 84 404 31.4 15.9 15.4 1905 5 551 170 767 85 016 85 751 30.8 15.3 15.4 1906 5 632 170 952 83 259 87 693 30.4 14.8 15.6 1907 5 710 171 506 82 250 89 256 30.0 14.4 15.6 1908 5 786 171 861 86 936 84 925 29.7 15.0 14.7 1909 5 862 170 766 80 283 90 483 29.1 13.7 15.4 1910 5 899 168 894 79 984 88 910 28.6 13.6 15.1 1911 5 976 166 527 86 786 79 741 27.9 14.5 13.3 1912 6 054 170 269 74 647 95 622 28.1 12.3 15.8 1913 6 145 173 541 75 867 97 674 28.2 12.3 15.9 1914 6 251 176 831 77 739 99 092 28.3 12.4 15.9 1915 6 364 167 426 79 613 87 813 26.3 12.5 13.8 1916 6 480 172 572 84 024 88 548 26.6 13.0 13.7 1917 6 612 173 112 87 273 85 839 26.2 13.2 13.0 1918 6 705 167 636 115 440 52 196 25.0 17.2 7.8 1919 6 752 164 447 89 646 74 801 24.4 13.3 11.1 1920 6 820 192 987 81 525 111 462 28.3 12.0 16.3 1921 6 921 189 546 77 002 112 544 27.4 11.1 16.3 1922 7 032 181 886 80 381 101 505 25.9 11.4 14.4 1923 7 150 187 512 72 809 114 703 26.2 10.2 16.0 1924 7 264 182 430 71 167 111 263 25.1 9.8 15.3 1925 7 366 178 545 72 121 106 424 24.2 9.8 14.4 1926 7 472 177 498 73 357 104 141 23.8 9.8 13.9 1927 7 576 175 098 77 614 97 484 23.1 10.2 12.9 1928 7 678 179 028 73 816 105 212 23.3 9.6 13.7 1929 7 781 177 216 83 224 93 992 22.8 10.7 12.1 1930 7 884 182 310 71 682 110 628 23.1 9.1 14.0 1931 7 999 177 387 77 048 100 339 22.2 9.6 12.5 1932 8 122 178 525 73 059 105 466 22.0 9.0 13.0 1933 8 237 171 289 72 096 99 193 20.8 8.8 12.0 1934 8 341 172 214 70 164 102 050 20.6 8.4 12.2 1935 8 433 170 425 73 660 96 765 20.2 8.7 11.5 1936 8 516 171 675 73 923 97 752 20.2 8.7 11.5 1937 8 598 170 220 75 516 94 704 19.8 8.8 11.0 1938 8 684 178 422 77 043 101 379 20.5 8.9 11.7 1939 8 781 180 917 75 841 105 076 20.6 8.6 12.0 1940 8 879 184 846 87 722 97 124 20.8 9.9 10.9 1941 8 965 181 959 89 716 92 243 20.3 10.0 10.3 1942 9 042 189 975 76 040 113 935 21.0 8.4 12.6 1943 9 102 209 379 91 438 117 941 23.0 10.0 13.0 1944 9 174 219 946 108 087 111 859 24.0 11.8 12.2 1945 9 262 209 607 141 398 68 209 22.6 15.3 7.4 1946 9 423 284 456 80 151 204 305 30.2 8.5 21.7 1947 9 629 267 348 77 646 189 702 27.8 8.1 19.7 1948 9 800 247 923 72 459 175 464 25.3 7.4 17.9 1949 9 956 236 177 81 077 155 100 23.7 8.1 15.6 1950 10 114 229 718 75 929 153 789 22.7 7.5 15.2 1951 10 264 228 405 77 560 150 845 22.3 7.6 14.7 1952 10 382 231 888 76 346 155 542 22.3 7.4 15.0 1953 10 493 227 964 80 901 147 063 21.7 7.7 14.0 1954 10 615 228 173 79 623 148 550 21.5 7.5 14.0 1955 10 751 229 222 81 708 147 514 21.3 7.6 13.7 1956 10 889 231 492 84 809 146 683 21.3 7.8 13.5 1957 11 021 233 892 82 961 150 931 21.2 7.5 13.7 1958 11 186 236 859 84 491 152 368 21.2 7.6 13.6 1959 11 346 242 518 86 072 156 446 21.4 7.6 13.8 1960 11 480 239 128 87 825 151 303 20.8 7.7 13.2 1961 11 637 247 407 88 321 159 086 21.3 7.6 13.7 1962 11 890 246 150 93 969 152 181 20.7 7.9 12.8 1963 12 042 249 879 95 734 154 145 20.8 8.0 12.8 1964 12 212 250 914 93 437 157 477 20.5 7.7 12.9 1965 12 377 245 216 98 026 147 190 19.8 7.9 11.9 1966 12 535 239 611 100 516 139 095 19.1 8.0 11.1 1967 12 597 238 678 99 792 138 886 18.9 7.9 11.0 1968 12 725 237 112 104 989 132 123 18.6 8.3 10.4 1969 12 958 247 588 107 615 139 973 19.1 8.3 10.8 1970 13 032 238 912 109 619 129 293 18.3 8.4 9.9 1971 13 266 227 180 110 243 116 937 17.1 8.3 8.8 1972 13 330 214 133 113 576 100 557 16.1 8.5 7.5 1973 13 438 194 993 110 682 84 311 14.5 8.2 6.3 1974 13 541 185 982 109 250 76 732 13.7 8.1 5.7 1975 13 653 177 876 113 737 64 139 13.0 8.3 4.7 1976 13 770 177 090 114 454 62 636 12.9 8.3 4.5 1977 13 853 173 296 110 093 63 203 12.5 7.9 4.6 1978 13 937 175 550 114 415 61 135 12.6 8.2 4.4 1979 14 030 174 979 112 565 62 414 12.5 8.0 4.4 1980 14 144 181 294 114 279 67 015 12.8 8.1 4.7 1981 14 246 178 569 115 515 63 054 12.5 8.1 4.4 1982 14 310 172 071 117 264 54 807 12.0 8.2 3.8 1983 14 362 170 246 117 761 52 485 11.9 8.2 3.7 1984 14 420 174 436 119 812 54 624 12.1 8.3 3.8 1985 14 484 178 136 122 704 55 432 12.3 8.5 3.8 1986 14 564 184 513 125 307 59 206 12.7 8.6 4.1 1987 14 665 186 667 122 199 64 468 12.7 8.3 4.4 1988 14 758 186 647 124 163 62 484 12.6 8.4 4.2 1989 14 849 188 979 128 905 60 086 12.7 8.7 4.0 1990 14 951 197 965 128 824 69 115 13.2 8.6 4.6 1991 15 070 198 665 129 958 68 707 13.2 8.6 4.6 1992 15 184 196 734 129 887 66 847 13.0 8.6 4.4 1993 15 290 195 748 137 795 57 953 12.8 9.0 3.8 1994 15 383 195 611 133 471 62 140 12.7 8.7 4.0 1995 15 459 190 513 135 675 54 838 12.3 8.8 3.5 1996 15 528 189 521 137 561 51 960 12.2 8.9 3.3 1997 15 611 192 443 135 783 56 660 12.3 8.7 3.6 1998 15 706 199 412 137 968 61 444 12.7 8.8 3.9 1999 15 812 200 445 140 487 59 958 12.7 8.9 3.8 2000 15 924 206 619 140 527 66 092 13.0 8.8 4.2 2001 16 044 202 603 140 377 62 226 12.6 8.7 3.9 2002 16 149 202 083 142 355 59 728 12.5 8.8 3.7 2003 16 225 200 297 141 936 58 361 12.3 8.7 3.6 2004 16 282 194 007 136 553 57 454 11.9 8.4 3.5 2005 16 320 187 910 136 402 51 508 11.5 8.4 3.2 2006 16 346 185 057 135 372 49 685 11.3 8.3 3.0 2007 16 382 181 336 133 022 48 314 11.1 8.1 2.9 2008 16 446 184 634 135 136 49 498 11.2 8.2 3.0 2009 16 530 184 915 134 235 50 680 11.2 8.1 3.1 2010 (p) 16 615 183 866 135 895 47 971 11.1 8.2 2.9 p=preliminary
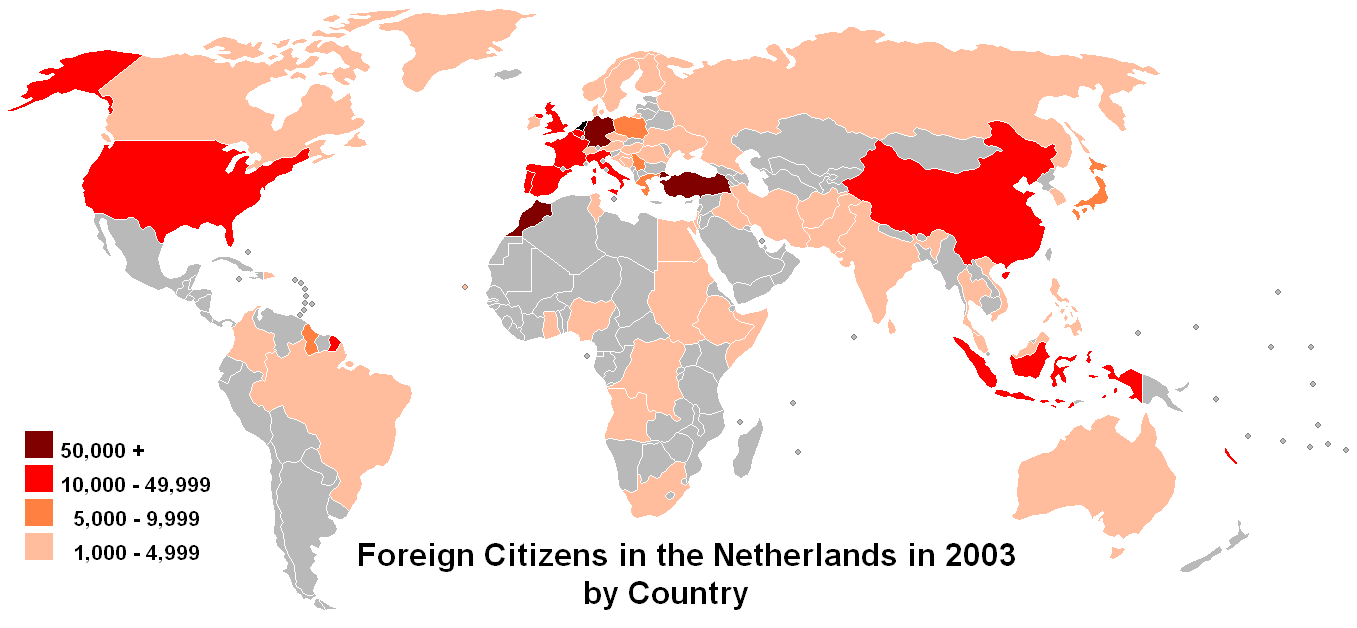
Migration and ethnicity
According to Eurostat, in 2010 there were 1.8 million foreign-born residents in the Netherlands, corresponding to 11.1% of the total population. Of these, 1.4 million (8.5%) were born outside the EU and 0.428 million (2.6%) were born in another EU Member State.[9]
As the result of immigration, the Netherlands has a sizeable minority of non-indigenous peoples. There is also considerable emigration. In 2005 some 121,000 people left the country, while 94,000 entered it. Out of a total of 101,150 people immigrating to Netherlands in 2006, 66,658 were from Europe, Oceania, Americas or Japan, and 34,492 were from other (mostly developing) countries. Out of a total of 132,470 emigrants, 94,834 were going to Europe, Oceania, Americas or Japan and 37,636 to other countries. [9]
A large number[citation needed] of immigrants come from countries in Western Europe, mostly from the bordering countries of Germany and Belgium. There were five subsequent waves of immigration from other countries in recent history.
- After World War II in the 1940s and the 1950s people from the newly independent Indonesian republic repatriated or migrated to the Netherlands - mainly Indo-European (people of mixed European and Indonesian ancestry with Dutch passports) and supporters of the Republic of South Maluku.
- In the 1960s and 1970s migrants from Southern Europe, West Asia, and northern Africa (i.e. Italy, Portugal and Spain), Turkey and Morocco came to work in the Netherlands as guest workers. They were expected to return to their own country and many did, but others remained and in the 1980s and 1990s were joined by their families. In the 2000s their children usually marry people from their home country.[citation needed]
- In the 1970s and 1980s people migrated from the newly independent Surinam and from the Netherlands Antilles, which remained part of the Kingdom of the Netherlands. These people migrated because these people still held a Dutch passport and saw a better future in the Netherlands.
- In the 1990s the Netherlands saw increasing migration of asylum seekers.[citation needed] Most notably are Iraqis, Iranians, Thais, Burmese, Chileans and Argentines fleeing from political oppression and/or persecution.
- And in the 2000s, migrant workers from new EU member states in Eastern Europe like Poland, Romania and Bulgaria, and non-EU states Moldova, Ukraine and former Yugoslavia in Southern Europe.[citation needed]
- The remigration or return migration from the Netherlands. See article in Turkish Review: Turkey Pulls, The Netherlands Pushes? An increasing number of Turks, the Netherlands’ largest ethnic minority, are beginning to return to Turkey, taking with them the education and skills they have acquired abroad, as the Netherlands faces challenges from economic difficulties, social tension and increasingly powerful far-right parties. At the same time Turkey’s political, social and economic conditions have been improving, making returning home all the more appealing for Turks at large. (pp.94-96).
Recent developments
Further information: Integration law for new immigrants to the NetherlandsWith the enlargement of the European Union during the 2000s, the Netherlands has seen a rise of migrants coming from new member countries.[citation needed] Migrant workers from these countries total about 100,000 as of 2007.[10] In the first nine months of 2007, about 13,000 immigrants from Bulgaria, Romania and Poland moved to the Netherlands, almost twice as much as in the same period a year earlier.[citation needed] Of the Poles who initially moved in 2004, about a quarter had returned by 2006.[11]


As of 2011:[12]
Ethnic Group Number Percentage Ethnic Dutch 13,228,780 79.42% Turkish 388,967 2.33% Indonesian 380,047 2.28% Moroccans 355,883 2.13% Surinamese 344,734 2.06% Netherlands Antilles and Aruba 141,345 0.84% Others 1,437,462 8.63% Total 16,655,799 100% Emigration
The Netherlands has seen considerable emigration. In the 1950s 560,000 people migrated to the United States, South Africa, Australia, Canada and New Zealand, leaving their war-torn and overpopulated home country behind. At least 60,000 of these migrants were Indo-European (Eurasian) repatriants that moved on, mostly to the US, after being repatriated to the Netherlands from the former Dutch East Indies during and after the Indonesian revolution.
In 2005 some 121,000 people migrated from the Netherlands. There is considerable migration towards neighbouring states, Belgium, Germany and the United Kingdom and to the Netherlands Antilles. Furthermore almost half of the current emigration consists of people returning to their country of birth, including rejected asylum seekers, after the more stringent migration laws were implemented.
Religion
Main article: Religion in the NetherlandsAccording to the CIA World Factbook,[3] as of 2002[update] the religious makeup of the Netherlands was 24% Roman Catholic (as of 2011), 13% Dutch Reformed, 7% Calvinist, 5.5% Muslim, 2.5% other and 41% none. However, according to a survey[13] done in 2006, 25% of the Dutch people are Christian, 3% adhere to another organised religion (Judaism, Islam, Hinduism etc.) , 26% are 'unbounded spiritual' (individual spiritual beliefs, agnostics, etc.), 26% are non-religious (moderate) humanist and the remaining 18% are non-religious non-humanist.
Language
Main article: Languages of the NetherlandsThe main language is Dutch, while West Frisian is also a recognized language and it is used by the government in the province of Fryslan. Several dialects of Low Saxon (Nedersaksisch in Dutch) are spoken in much of the north and east and are recognized by the Netherlands as regional languages according to the European Charter for Regional or Minority Languages. Another Dutch dialect granted the status of regional language is Limburgish, which is spoken in the south-eastern province of Limburg. Major immigrant languages are Turkish, Arabic and Berber.
Genetics
The genetic makeup of the Dutch is typified by a high occurrence of the Y-chromosome markers: haplogroup R1b (averaging 70%) and haplogroup I (averaging 25%). These chromosomes are associated with Eurasiatic Cro Magnoid homo sapiens of the Aurignacian culture, the first modern humans in Europe, and the people of the Gravettian culture that entered Europe from the Middle East 20,000 to 25,000 years ago.[14]
With 70.4%, the Dutch have one of the highest percentages of haplogroup R1b occurrences in Northwestern Europe, comparable to that of the (combined) British population; 72%. Neighbouring populations have lower occurrence of this chromosome (French: 52.2% and Germans: 50.0%); with again a percentage similar to that of the Dutch among the inhabitants of the Iberian peninsula (Spain and Portugal) and French Atlantic coast.[15] The Dutch hence fit the Atlantic Haplotype Modal, which is the primary model of peoples living along or in the vicinity of the Atlantic Ocean and the North Sea.[16]
Within the R1b haplogroup its R1b1b2a1 subclade is most dominant, and in fact peaks in occurrence among the Dutch and Frisians at 37.2%. The Dutch share this high rate with the people in Southwest England (21.4%) and Denmark (17.7%).[17] Other haplogroups are less frequent in the Dutch population: Haplogroup E1b1b (8%) and haplogroup R1a1 (3.7%). The latter is found more frequently in East of the Netherlands.[18]
See also
- Dutch people
- Islam in the Netherlands
- Immigration to Europe
- List of countries by immigrant population
Notes and references
- ^ a b CBS - Population counter - Extra
- ^ CBS Statline - Population; history. Statistics Netherlands. Retrieved on 2009-03-08.
- ^ a b c CIA - The World Factbook - Netherlands
- ^ Population density in the Netherlands by neighbourhood as of 2007.
- ^ Population data for whole municipalities as of 2011.
- ^ Statline. Statistics Netherlands. Retrieved on 2009-02-23.
- ^ http://www.cbs.nl/NR/rdonlyres/A157E464-812A-40CC-8A71-E85FDF3A16B0/0/2008k1b15p55art.pdf
- ^ CBS Statistics Netherlands
- ^ 6.5% of the EU population are foreigners and 9.4% are born abroad, Eurostat, Katya VASILEVA, 34/2011.
- ^ "Donner: 100.000 Oost-Europeanen werken in Nederland". 2007-11-25. http://www.volkskrant.nl/economie/article481415.ece/Donner_100_duizend_Oost-Europeanen_werken_in_Nederland. Retrieved 2007-11-25.
- ^ "Immigratie Oost-Europeanen blijft hoog". CBS. 2007-11-28. http://www.cbs.nl/nl-NL/menu/themas/bevolking/publicaties/artikelen/archief/2007/2007-2334-wm.htm. Retrieved 2007-11-28.
- ^ CBS StatLine. "Population; sex, age, marital status, origin and generation, 1 January". http://statline.cbs.nl/StatWeb/publication/?DM=SLEN&PA=37325eng&D1=0&D2=0&D3=0&D4=0&D5=0-1,84,102,139,145,210,225&D6=a&LA=EN&HDR=G2,G3,G4,T&STB=G1,G5&VW=T. Retrieved 2011-04-14.
- ^ Motivaction - Religie is niet weg, maar anders
- ^ The Genetic Legacy of Paleolithic Homo sapiens sapiens in Extant Europeans: A Y Chromosome Perspective - Ornella Semino et al.[1]
- ^ http://www.healthanddna.com/Ysample.PDF
- ^ Haplogroup R1b (Atlantic Modal Haplotype)
- ^ [2] Y-chromosome Short Tandem Repeat DYS458.2 Non-consensus Alleles Occur Independently in Both Binary Haplogroups J1-M267 and R1b3-M405, The Croatian Medical Journal, Vol. 48, No. 4. (August 2007), pp. 450-459
- ^ European R1a1 measurements(referred to as M17 or Eu19) in Science vol 290, 10 November 2000 [3]
External links
- CIA World Factbook data
- CBS Dutch Bureau of Statistics
Ethnic and national groups in the Netherlands Africans Americans Antilleans · SurinameseAsians Arab Dutch · Armenians · Afghans · Assyrians/Chaldeans/Syriacs · Chinese · Filipinos · Hindoestanen · Indonesians (Indo Eurasians) · Iraqis · Iranians · Japanese · Koreans · Pakistanis · Turkish · VietnameseEuropeans Bold denotes ethnic groups that (partly) originate from within contemporary and historic parts of the Netherlands Demographics of Europe Sovereign
states- Albania
- Andorra
- Armenia
- Austria
- Azerbaijan
- Belarus
- Belgium
- Bosnia and Herzegovina
- Bulgaria
- Croatia
- Cyprus
- Czech Republic
- Denmark
- Estonia
- Finland
- France
- Georgia
- Germany
- Greece
- Hungary
- Iceland
- Ireland
- Italy
- Kazakhstan
- Latvia
- Liechtenstein
- Lithuania
- Luxembourg
- Macedonia
- Malta
- Moldova
- Monaco
- Montenegro
- Netherlands
- Norway
- Poland
- Portugal
- Romania
- Russia
- San Marino
- Serbia
- Slovakia
- Slovenia
- Spain
- Sweden
- Switzerland
- Turkey
- Ukraine
- United Kingdom
- (England
- Northern Ireland
- Scotland
- Wales)
- Vatican City
States with limited
recognition- Abkhazia
- Kosovo
- Nagorno-Karabakh
- Northern Cyprus
- South Ossetia
- Transnistria
Dependencies
and other territories- Åland
- Faroe Islands
- Gibraltar
- Guernsey
- Jan Mayen
- Jersey
- Isle of Man
- Svalbard
Other entities - European Union
Categories:- Dutch society
- Demographics of the Netherlands


Wikimedia Foundation. 2010.