- Human Development Index
-
 World map by quartiles of Human Development Index in 2011.
 Very HighLowHighData unavailableMedium
The Human Development Index (HDI) is a composite statistic used to rank countries by level of "human development" and separate "very high human development", "high human development", "medium human development", and "low human development" countries. The Human Development Index (HDI) is a comparative measure of life expectancy, literacy, education and standards of living for countries worldwide. It is a standard means of measuring well-being, especially child welfare. It is used to distinguish whether the country is a developed, a developing or an under-developed country, and also to measure the impact of economic policies on quality of life. There are also HDI for states, cities, villages, etc. by local organizations or companies.
Contents
Origins
The origins of the HDI are found in the annual Human Development Reports of the United Nations Development Programme (UNDP). These were devised and launched by Pakistani economist Mahbub ul Haq in 1990 and had the explicit purpose "to shift the focus of development economics from national income accounting to people centered policies". To produce the Human Development Reports, Mahbub ul Haq brought together a group of well-known development economists including: Paul Streeten, Frances Stewart, Gustav Ranis, Keith Griffin, Sudhir Anand and Meghnad Desai. But it was Nobel laureate Amartya Sen’s work on capabilities and functionings that provided the underlying conceptual framework. Haq was sure that a simple composite measure of human development was needed in order to convince the public, academics, and policy-makers that they can and should evaluate development not only by economic advances but also improvements in human well-being. Sen initially opposed this idea, but he went on to help Haq develop the Human Development Index (HDI). Sen was worried that it was difficult to capture the full complexity of human capabilities in a single index but Haq persuaded him that only a single number would shift the attention of policy-makers from concentration on economic to human well-being.[1][2]
Other organizations and companies also make HD Indices with differing formulae and results (see below).
Dimensions and calculation
Published on 4 November 2010 (and updated on 10 June 2011), starting with the 2010 Human Development Report the HDI combines three dimensions:
- A long and healthy life: Life expectancy at birth
- Education index: Mean years of schooling and Expected years of schooling
- A decent standard of living: GNI per capita (PPP US$)
The HDI combined three dimensions up until its 2010 report:
- Life expectancy at birth, as an index of population health and longevity
- Knowledge and education, as measured by the adult literacy rate (with two-thirds weighting) and the combined primary, secondary, and tertiary gross enrollment ratio (with one-third weighting).
- Standard of living, as indicated by the natural logarithm of gross domestic product per capita at purchasing power parity.
New methodology for 2010 data onwards
In its 2010 Human Development Report the UNDP began using a new method of calculating the HDI. The following three indices are used:
1. Life Expectancy Index (LEI)

2. Education Index (EI)

2.1 Mean Years of Schooling Index (MYSI)
 [3]
[3]2.2 Expected Years of Schooling Index (EYSI)
 [4]
[4]3. Income Index (II)

Finally, the HDI is the geometric mean of the previous three normalized indices:
![\textrm{HDI} = \sqrt[3]{\textrm{LEI}\cdot \textrm{EI} \cdot \textrm{II}}.](b/3cb520e370fb8d0c25edd0e5a1731218.png)
LE: Life expectancy at birth
MYS: Mean years of schooling (Years that a 25-year-old person or older has spent in schools)
EYS: Expected years of schooling (Years that a 5-year-old child will spend with his education in his whole life)
GNIpc: Gross national income at purchasing power parity per capitaMethodology used until 2010
 HDI trends between 1975 and 2004OECDArab States
This is the methodology used by the UNDP up until its 2010 report.
The formula defining the HDI is promulgated by the United Nations Development Programme (UNDP)[5] In general, to transform a raw variable, say x, into a unit-free index between 0 and 1 (which allows different indices to be added together), the following formula is used:
where
 and
and  are the lowest and highest values the variable x can attain, respectively.
The Human Development Index (HDI) then represents the uniformly weighted sum with ⅓ contributed by each of the following factor indices:
- Life Expectancy Index =

- Education Index =

- Adult Literacy Index (ALI) =

- Gross Enrollment Index (GEI) =

- Adult Literacy Index (ALI) =
- GDP =

Other organizations/companies may include Democracy Index, Population, etc. which produces different number of HDI.
2011 report
Main article: List of countries by Human Development IndexThe 2011 Human Development Report was released on 2 November 2011, and calculated HDI values based on estimates for 2011. Below is the list of the "Very High Human Development" countries (equal to the top quartile):[6]
Note: The green arrows (
 ), red arrows (
 ), and blue dashes (
 ) represent changes in rank when compared to the new 2011 data HDI for 2010 - published in the 2011 report (p. 131).
 Norway 0.943 ()
 Australia 0.929 ()
 Netherlands 0.910 ()
 United States 0.910 ()
 New Zealand 0.908 ()
 Canada 0.908 ()
 Ireland 0.908 ()
 Liechtenstein 0.905 ()
 Germany 0.905 ()
 Sweden 0.904 ()
 Switzerland 0.903 ()
 Japan 0.901 ()
 Hong Kong 0.898 ( 1)
 Iceland 0.898 ( -1)
 South Korea 0.897 ()
 Denmark 0.895 ()
 Israel 0.888 ()
 Belgium 0.886 ()
 Austria 0.885 ()
 France 0.884 ()
 Slovenia 0.884 ()
 Finland 0.882 ()
 Spain 0.878 ()
 Italy 0.874 ()
 Luxembourg 0.867 ()
 Singapore 0.866 ()
 Czech Republic 0.865 ()
 United Kingdom 0.863 ()
 Greece 0.861 ()
 United Arab Emirates 0.846 ()
 Cyprus 0.840 ()
 Andorra 0.838 ()
Inequality-adjusted HDI
Main article: List of countries by inequality-adjusted HDIBelow is a list of countries in the top quartile by Inequality-adjusted Human Development Index (IHDI).[7]
Note: The green arrows (
), red arrows (), and blue dashes () represent changes in rank when compared to the 2011 HDI list, for countries listed in both rankings.- Czech Republic 0.821 ( 9)
- Austria 0.820 ( 1)
- Belgium 0.819 ( 1)
- France 0.804 ()
- Spain 0.799 ( 2)
- Luxembourg 0.799 ( 3)
- United Kingdom 0.791 ( 4)
 Slovakia 0.787 ( 7)
- Israel 0.779 ( 8)
- Italy 0.779 ( 2)
- United States 0.771 ( 19)
 Estonia 0.769 ( 2)
Countries in the top quartile of HDI ("Very high human development" group) with a missing IHDI include: New Zealand, Liechtenstein, Japan, Hong Kong, Singapore, United Arab Emirates, Andorra, Brunei, Malta, Qatar, Bahrain, Chile, Argentina and Barbados.
Countries not included
Some countries were not included for various reasons, mainly the unavailability of certain crucial data. The following United Nations Member States were not included in the 2011 report:[8] North Korea, Marshall Islands, Monaco, Nauru, San Marino, Somalia and Tuvalu.
2010 report
The 2010 Human Development Report by the United Nations Development Program was released on November 4, 2010, and calculates HDI values based on estimates for 2010. Below is the list of the "Very High Human Development" countries:[9]
Note: The green arrows (
), red arrows (), and blue dashes () represent changes in rank when compared to the 2009 HDI published in the 2010 report.- Norway 0.938 ()
- Australia 0.937 ()
- New Zealand 0.907 ()
- United States 0.902 ()
- Ireland 0.895 ()
- Liechtenstein 0.891 ()
- Netherlands 0.890 ()
- Canada 0.888 ()
- Sweden 0.885 ()
- Germany 0.885 ()
- Japan 0.884 ()
- South Korea 0.877 ()
- Switzerland 0.874 ()
- France 0.872 ( 2)
- Israel 0.872 ( 1)
- Finland 0.871 ( 1)
- Iceland 0.869 ()
- Belgium 0.867 ()
- Denmark 0.866 ()
- Spain 0.863 ()
- Hong Kong 0.862 ()
- Greece 0.855 ()
- Italy 0.854 ()
- Luxembourg 0.852 ()
- Austria 0.851 ()
- United Kingdom 0.849 ()
- Singapore 0.846 ()
- Czech Republic 0.841 ()
Inequality-adjusted HDI
The 2010 Human Development Report was the first to calculate an Inequality-adjusted Human Development Index (IHDI), which factors in inequalities in the three basic dimensions of human development (income, life expectancy, and education). Below is a list of countries in the top quartile by IHDI:[10]
Note: The green arrows (
), red arrows (), and blue dashes () represent changes in rank when compared to the 2010 HDI list, for countries listed in both rankings.- Norway 0.876 ()
- Australia 0.864 ()
- Sweden 0.824 ( 4)
- Netherlands 0.818 ( 1)
- Germany 0.814 ( 3)
- Switzerland 0.813 ( 4)
- Ireland 0.813 ( 3)
- Canada 0.812 ( 2)
- Iceland 0.811 ( 5)
- Denmark 0.810 ( 6)
- Finland 0.806 ( 2)
- United States 0.799 ( 9)
- Belgium 0.794 ( 2)
- France 0.792 ( 3)
- Czech Republic 0.790 ( 8)
- Austria 0.787 ( 5)
- Spain 0.779 ()
- Luxembourg 0.775 ( 2)
- Slovenia 0.771 ( 5)
- Greece 0.768 ( 2)
- United Kingdom 0.766 ( 1)
- Slovakia 0.764 ( 3)
- Israel 0.763 ( 11)
- Italy 0.752 ( 5)
 Hungary 0.736 ( 3)
- Estonia 0.733 ()
- South Korea 0.731 ( 18)
- Cyprus 0.716 ( 1)
 Poland 0.709 ( 1)
 Portugal 0.700 ( 1)
 Lithuania 0.693 ( 1)
 Montenegro 0.693 ( 4)
 Latvia 0.684 ( 2)
 Romania 0.675 ( 3)
 The Bahamas 0.671 ( 4)
Countries in the top quartile of HDI ("Very high human development" group) with a missing IHDI include: New Zealand, Liechtenstein, Japan, Hong Kong, Singapore, Andorra, United Arab Emirates, Malta, Brunei, Qatar, Bahrain and Barbados.
Countries not included
Some countries were not included for various reasons, mainly the unavailability of certain crucial data. The following United Nations Member States were not included in the 2010 report.[11] Cuba lodged a formal protest at its lack of inclusion. The UNDP explained that Cuba had been excluded due to the lack of an "internationally reported figure for Cuba’s Gross National Income adjusted for Purchasing Power Parity". All other indicators for Cuba were available, and reported by the UNDP, but the lack of one indicator meant that no ranking could be attributed to the country.[12][13]
Non-UN members (not calculated by UNDP)
2009 report
The 2009 Human Development Report by UNDP was released on October 5, 2009, and covers the period up to 2007. It was titled "Overcoming barriers: Human mobility and development". The top countries by HDI were grouped in a new category called "Very High Human Development". The report refers to these countries as developed countries.[15] They are:
- Norway 0.971 ( 1)
- Australia 0.970 ( 2)
- Iceland 0.969 ( 2)
- Canada 0.966 ( 1)
- Ireland 0.965 ()
- Netherlands 0.964 ()
- Sweden 0.963 ()
- France 0.961 ( 3)
- Switzerland 0.960 ( 1)
- Japan 0.960 ( 2)
- Luxembourg 0.960 ( 2)
- Finland 0.959 ()
- United States 0.956 ( 2)
- Austria 0.955 ()
- Spain 0.955 ( 1)
- Denmark 0.955 ( 2)
- Belgium 0.953 ()
- Italy 0.951 ( 1)
- Liechtenstein 0.951 ( 1)
- New Zealand 0.950 ()
- United Kingdom 0.947 ()
- Germany 0.947 ()
- Singapore 0.944 ( 1)
- Hong Kong 0.944 ( 1)
- Greece 0.942 ()
- South Korea 0.937 ()
Countries not included
Some countries were not included for various reasons, such as being a non-UN member or unable or unwilling to provide the necessary data at the time of publication. Besides the states with limited recognition, the following states were also not included.
2008 statistical update
Main article: List of countries by Human Development IndexA new index was released on December 18, 2008. This so-called "statistical update" covered the period up to 2006 and was published without an accompanying Human Development Report. The update is relevant due to newly released estimates of purchasing power parities (PPP), implying substantial adjustments for many countries, resulting in changes in HDI values and, in many cases, HDI ranks.[16]
- Iceland 0.968 ()
- Norway 0.968 ()
- Canada 0.967 ( 1)
- Australia 0.965 ( 1)
- Ireland 0.960 ()
- Netherlands 0.958 ( 3)
- Sweden 0.958 ( 1)
- Japan 0.956 ()
- Luxembourg 0.956 ( 9)
 Switzerland 0.955 ( 3)
- France 0.954 ( 1)
- Finland 0.954 ( 1)
- Denmark 0.952 ( 1)
- Austria 0.951 ( 1)
- United States 0.950 ( 3)
- Spain 0.949 ( 3)
- Belgium 0.948 ( 1)
- Greece 0.947 ( 6)
- Italy 0.945 ( 1)
- New Zealand 0.944 ( 1)
- United Kingdom 0.942 ( 4)
- Hong Kong 0.942 ( 1)
Countries not included
Some countries were not included for various reasons, such as being a non-UN member, unable, or unwilling to provide the necessary data at the time of publication. Besides the states with limited recognition, the following states were also not included.
2007/2008 report
The Human Development Report for 2007/2008 was launched in Brasilia, Brazil, on November 27, 2007. Its focus was on "Fighting climate change: Human solidarity in a divided world."[17] Most of the data used for the report are derived largely from 2005 or earlier, thus indicating an HDI for 2005. Not all UN member states choose to or are able to provide the necessary statistics.
The report showed a small increase in world HDI in comparison with last year's report. This rise was fueled by a general improvement in the developing world, especially of the least developed countries group. This marked improvement at the bottom was offset with a decrease in HDI of high income countries.
A HDI below 0.5 is considered to represent "low development". All 22 countries in that category are located in Africa. The highest-scoring Sub-Saharan countries, Gabon and South Africa, are ranked 119th and 121st, respectively. Nine countries departed from this category this year and joined the "medium development" group.
A HDI of 0.8 or more is considered to represent "high development". This includes all developed countries, such as those in North America, Western Europe, Oceania, and Eastern Asia, as well as some developing countries in Eastern Europe, Central and South America, Southeast Asia, the Caribbean, and the oil-rich Arabian Peninsula. Seven countries were promoted to this category this year, leaving the "medium development" group: Albania, Belarus, Brazil, Libya, Macedonia, Russia and Saudi Arabia.
On the following table, green arrows (
) represent an increase in ranking over the previous study, while red arrows () represent a decrease in ranking. They are followed by the number of spaces they moved. Blue dashes () represent a nation that did not move in the rankings since the previous study.- Iceland 0.968 ( 1)
- Norway 0.968 ( 1)
- Australia 0.962 ()
- Canada 0.961 ( 2)
- Ireland 0.959 ( 1)
- Sweden 0.956 ( 1)
- Switzerland 0.955 ( 2)
- Japan 0.953 ( 1)
- Netherlands 0.953 ( 1)
- France 0.952 ( 6)
- Finland 0.952 ()
- United States 0.951 ( 4)
- Spain 0.949 ( 6)
- Denmark 0.949 ( 1)
- Austria 0.948 ( 1)
- Belgium 0.946 ( 4)
- United Kingdom 0.946 ( 1)
- Luxembourg 0.944 ( 6)
- New Zealand 0.943 ( 1)
- Italy 0.941 ( 3)
Past top countries
The list below displays the top-ranked country from each year of the Human Development Index. Norway have been ranked the highest nine times, Canada eight times, followed by Japan which has been ranked highest three times. Iceland has been ranked highest twice.
In each original report
The year represents when the report was published. In parentheses is the year for which the index was calculated.
- 2011 (2011)– Norway
- 2010 (2010)– Norway
- 2009 (2007)– Norway
- 2008 (2006)– Iceland
- 2007 (2005)– Iceland
- 2006 (2004)– Norway
- 2005 (2003)– Norway
- 2004 (2002)– Norway
- 2003 (2001)– Norway
- 2002 (2000)– Norway
- 2001 (1999)– Norway
- 2000 (1998)– Canada
- 1999 (1997)– Canada
- 1998 (1995)– Canada
- 1997 (1994)– Canada
- 1996 (1993)– Canada
- 1995 (1992)– Canada
- 1994 (????)– Canada
- 1993 (????)– Japan
- 1992 (1990)– Canada
- 1991 (1990)– Japan
- 1990 (????)– Japan
Future HDI projections
Further information: List of countries by future Human Development Index projections of the United NationsIn April 2010, the Human Development Report Office provided[18] the 2010-2030 HDI projections (quoted in September 2010, by the United Nations Development Programme, in the Human Development Research paper 2010/40, pp. 40–42). These projections were reached by re-calculating the HDI, using (for components of the HDI) projections of the components conducted by agencies that provide the UNDP with data for the HDI.
Criticisms
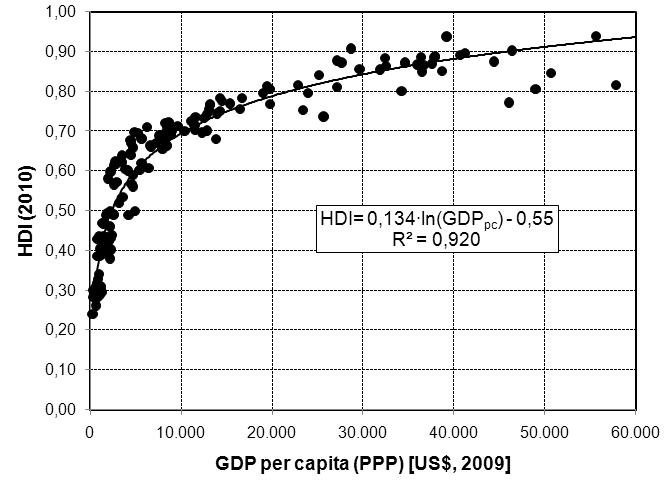
 HDI for a sample of 150 countries shows a very high correlation with logarithm of GDP per capita.
The Human Development Index has been criticised on a number of grounds, including failure to include any ecological considerations, focusing exclusively on national performance and ranking (although many national Human Development Reports, looking at subnational performance, have been published by UNDP and others—so this last claim is untrue), not paying much attention to development from a global perspective and based on grounds of measurement error of the underlying statistics and formula changes by the UNDP which can lead to severe misclassifications of countries in the categories of being a 'low', 'medium', 'high' or 'very high' human development country.[19] Other authors claimed that the Human Development Reports "have lost touch with their original vision and the index fails to capture the essence of the world it seeks to portray".[20] The index has also been criticized as "redundant" and a "reinvention of the wheel", measuring aspects of development that have already been exhaustively studied.[21][22] The index has further been criticised for having an inappropriate treatment of income, lacking year-to-year comparability, and assessing development differently in different groups of countries.[23]
Economist Bryan Caplan has criticised the way HDI scores are produced; each of the three components are bounded between zero and one. As a result of that, rich countries effectively cannot improve their rating (and thus their ranking relative to other countries) in certain categories, even though there is a lot of scope for economic growth and longevity left. "This effectively means that a country of immortals with infinite per-capita GDP would get a score of .666 (lower than South Africa and Tajikistan) if its population were illiterate and never went to school."[24] He argues, "Scandinavia comes out on top according to the HDI because the HDI is basically a measure of how Scandinavian your country is."[24]
Economists Hendrik Wolff, Howard Chong and Maximilian Auffhammer discuss the HDI from the perspective of data error in the underlying health, education and income statistics used to construct the HDI.[19] They identify three sources of data error which are due to (i) data updating, (ii) formula revisions and (iii) thresholds to classify a country’s development status and find that 11%, 21% and 34% of all countries can be interpreted as currently misclassified in the development bins due to the three sources of data error, respectively. The authors suggest that the United Nations should discontinue the practice of classifying countries into development bins because the cut-off values seem arbitrary, can provide incentives for strategic behavior in reporting official statistics, and have the potential to misguide politicians, investors, charity donators and the public at large which use the HDI. In 2010 the UNDP reacted to the criticism and updated the thresholds to classify nations as low, medium and high human development countries. In a comment to The Economist in early January 2011, the Human Development Report Office responded[25] to a January 6, 2011 article in The Economist[26] which discusses the Wolff et al. paper. The Human Development Report Office states that they undertook a systematic revision of the methods used for the calculation of the HDI and that the new methodology directly addresses the critique by Wolff et al. in that it generates a system for continuous updating of the human development categories whenever formula or data revisions take place.
The following are common criticisms directed at the HDI: that it is a redundant measure that adds little to the value of the individual measures composing it; that it is a means to provide legitimacy to arbitrary weightings of a few aspects of social development; that it is a number producing a relative ranking which is useless for inter-temporal comparisons, and difficult to compare a country's progress or regression since the HDI for a country in a given year depends on the levels of, say, life expectancy or GDP per capita of other countries in that year.[27][28][29][30] However, each year, UN member states are listed and ranked according to the computed HDI. If high, the rank in the list can be easily used as a means of national aggrandizement; alternatively, if low, it can be used to highlight national insufficiencies. Using the HDI as an absolute index of social welfare, some authors have used panel HDI data to measure the impact of economic policies on quality of life.[31]
Ratan Lal Basu criticises the HDI concept from a completely different angle. According to him the Amartya Sen-Mahbub ul Haq concept of HDI considers that provision of material amenities alone would bring about Human Development, but Basu opines that Human Development in the true sense should embrace both material and moral development. According to him human development based on HDI alone, is similar to dairy farm economics to improve dairy farm output. To quote: ‘So human development effort should not end up in amelioration of material deprivations alone: it must undertake to bring about spiritual and moral development to assist the biped to become truly human.’[32] For example, a high suicide rate would bring the index down.
A few authors have proposed alternative indices to address some of the index's shortcomings.[33] However, of those proposed alternatives to the HDI, few have produced alternatives covering so many countries, and that no development index (other than, perhaps, Gross Domestic Product per capita) has been used so extensively—or effectively, in discussions and developmental planning as the HDI.
However, there has been one lament about the HDI that has resulted in an alternative index: David Hastings, of the United Nations Economic and Social Commission for Asia and the Pacific published a report geographically extending the HDI to 230+ economies, whereas the UNDP HDI for 2009 enumerates 182 economies and coverage for the 2010 HDI dropped to 169 countries.[34][35]
See also
- Education Index
- Democracy Index
- Freedom House
- Gini coefficient
- Gender Parity Index
- Gender-related Development Index
- Gender Empowerment Measure
- Genuine Progress Indicator
- Global Peace Index
- Legatum Prosperity Index
- Living Planet Index
- Gross national happiness
- Happy Planet Index
- Physical quality-of-life index
- Human development (humanity)
- American Human Development Report
- Child Development Index
- Satisfaction with Life Index
- Genuine progress indicator
- Multidimensional Poverty Index
Lists:
- List of countries by Human Development Index
- List of countries by inequality-adjusted HDI
- List of African countries by Human Development Index
- List of Australian states and territories by HDI
- List of Argentine provinces by Human Development Index
- List of Brazilian states by Human Development Index
- List of Chilean regions by Human Development Index
- List of Chinese administrative divisions by Human Development Index
- List of European countries by Human Development Index
- List of Indian states by Human Development Index
- List of Latin American countries by Human Development Index
- List of Mexican states by Human Development Index
- List of Pakistani Districts by Human Development Index
- List of Philippine provinces by Human Development Index
- List of Russian federal subjects by HDI
- List of South African provinces by HDI
- List of US states by HDI
- List of Venezuelan states by Human Development Index
References
- ^ Fukuda-Parr, Sakiko (2003). "The Human Development Paradigm: operationalizing Sen’s ideas on capabilities". Feminist Economics 9 (2–3): 301–317. doi:10.1080/1354570022000077980.
- ^ United Nations Development Programme (1999). Human Development Report 1999. New York: Oxford University Press.
- ^ Mean years of schooling (of adults) (years) is a calculation of the average number of years of education received by people ages 25 and older in their lifetime based on education attainment levels of the population converted into years of schooling based on theoretical durations of each level of education attended. Source: Barro, R. J.; Lee, J.-W. (2010). "A New Data Set of Educational Attainment in the World, 1950-2010". NBER Working Paper No. 15902. http://www.nber.org/papers/w15902.
- ^ (Expected years of schooling is a calculation of the number of years a child of school entrance age is expected to spend at school, or university, including years spent on repetition. It is the sum of the age-specific enrolment ratios for primary, secondary, post-secondary non-tertiary and tertiary education and is calculated assuming the prevailing patterns of age-specific enrolment rates were to stay the same throughout the child’s life. (Source: UNESCO Institute for Statistics (2010). Correspondence on education indicators. March. Montreal.)
- ^ Definition, Calculator, etc. at UNDP site
- ^ 2011 Human Development Index
- ^ 2011 Human Development Complete Report
- ^ International Human Rights Development Indicators, UNDP
- ^ 2010 Human Development Index trends, 1980-2010
- ^ 2010 Human Development Complete Report
- ^ International Human Rights Development Indicators, UNDP
- ^ "Samoa left out of UNDP index", Samoa Observer, January 22, 2010
- ^ Cuba country profile, UNDP
- ^ Report of Directorate General of Budget, Accounting and Statistics, Executive Yuan, R.O.C.(Taiwan)
- ^ http://hdr.undp.org/en/media/HDR_2009_EN_Complete.pdf Human Development Report 2009[ (p. 171, 204)
- ^ News – Human Development Reports (UNDP)
- ^ HDR 2007/2008 – Human Development Reports (UNDP)
- ^ In: Daponte Beth Osborne, and Hu difei: "Technical Note on Re-Calculating the HDI, Using Projections of Components of the HDI", April 2010, United Nations Development Programme, Human Development Report Office.
- ^ a b Wolff, Hendrik; Chong, Howard; Auffhammer, Maximilian (2011). "Classification, Detection and Consequences of Data Error: Evidence from the Human Development Index". Economic Journal 121 (553): 843–870. doi:10.1111/j.1468-0297.2010.02408.x.
- ^ Sagara, Ambuj D.; Najam, Adil (1998). "The human development index: a critical review". Ecological Economics 25 (3): 249–264. doi:10.1016/S0921-8009(97)00168-7.
- ^ McGillivray, Mark (1991). "The human development index: yet another redundant composite development indicator?". World Development 19 (10): 1461–1468. doi:10.1016/0305-750X(91)90088-Y.
- ^ Srinivasan, T. N. (1994). "Human Development: A New Paradigm or Reinvention of the Wheel?". American Economic Review 84 (2): 238–243. JSTOR 2117836.
- ^ McGillivray, Mark; White, Howard (2006). "Measuring development? The UNDP's human development index". Journal of International Development 5 (2): 183–192. doi:10.1002/jid.3380050210.
- ^ a b Caplan, Bryan (May 22, 2009). "Against the Human Development Index". Library of Economics and Liberty. http://econlog.econlib.org/archives/2009/05/against_the_hum.html.
- ^ "UNDP Human Development Report Office's comments". The Economist. January 2011. http://www.economist.com/user/UNDP%2BHuman%2BDevelopment%2BReport%2BOffice/comments.[dead link]
- ^ "The Economist (pages 60-61 in the issue of Jan 8, 2011)". January 6, 2011. http://www.economist.com/node/17849159?story_id=17849159&fsrc=rss.
- ^ Rao, V. V. B. (1991). "Human development report 1990: review and assessment". World Development 19 (10): 1451–1460. doi:10.1016/0305-750X(91)90087-X.
- ^ McGillivray, M. (1991). "The Human Development Index: Yet Another Redundant Composite Development Indicator?". World Development 18 (10): 1461–1468. doi:10.1016/0305-750X(91)90088-Y.
- ^ Hopkins, M. (1991). "Human development revisited: A new UNDP report". World Development 19 (10): 1461–1468. doi:10.1016/0305-750X(91)90089-Z.
- ^ Tapia Granados, J. A. (1995). "Algunas ideas críticas sobre el índice de desarrollo humano". Boletín de la Oficina Sanitaria Panamericana 119 (1): 74–87.
- ^ Davies, A.; Quinlivan, G. (2006). "A Panel Data Analysis of the Impact of Trade on Human Development". Journal of Socio-Economics 35 (5): 868–876. doi:10.1016/j.socec.2005.11.048.
- ^ HDI-2
- ^ Noorbakhsh, Farhad (1998). "The human development index: some technical issues and alternative indices". Journal of International Development 10 (5): 589–605. doi:10.1002/(SICI)1099-1328(199807/08)10:5<589::AID-JID484>3.0.CO;2-S.
- ^ Hastings, David A. (2009). "Filling Gaps in the Human Development Index". United Nations Economic and Social Commission for Asia and the Pacific, Working Paper WP/09/02. http://www.unescap.org/publications/detail.asp?id=1308.
- ^ Hastings, David A. (2011). "A "Classic" Human Development Index with 232 Countries". HumanSecurityIndex.org. http://www.humansecurityindex.org/?page_id=204. Information Note linked to data
External links
- Human Development Report
- 2011 Human Development Index Update
- Human Development Interactive Map
- Human Development Tools and Rankings
- Technical note explaining the definition of the HDIPDF (5.54 MB)
- An independent HDI covering 232 countries, formulated along lines of the traditional (pre-2010) approach.
- List of countries by HDI at NationMaster.com
- America Is # ... 15? by Dalton Conley, The Nation, March 4, 2009
Economic classification of countries Developed country · Developing country · Least developed country · High income economy · Newly industrialized country · Heavily Indebted Poor CountriesWorlds Theory GDP Purchasing power parity (PPP)By country (future estimates · per capita [future estimates] · per hour worked, per person employed)GNI per capita List of countries by GNI (nominal) per capita · List of countries by GNI (PPP) per capitaWages Other national accounts Human development Digital divide Categories:- Human Development Index
- International rankings


Wikimedia Foundation. 2010.