- Traffic congestion
-
"Traffic jam" redirects here. For other uses, see Traffic jam (disambiguation).
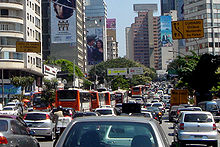
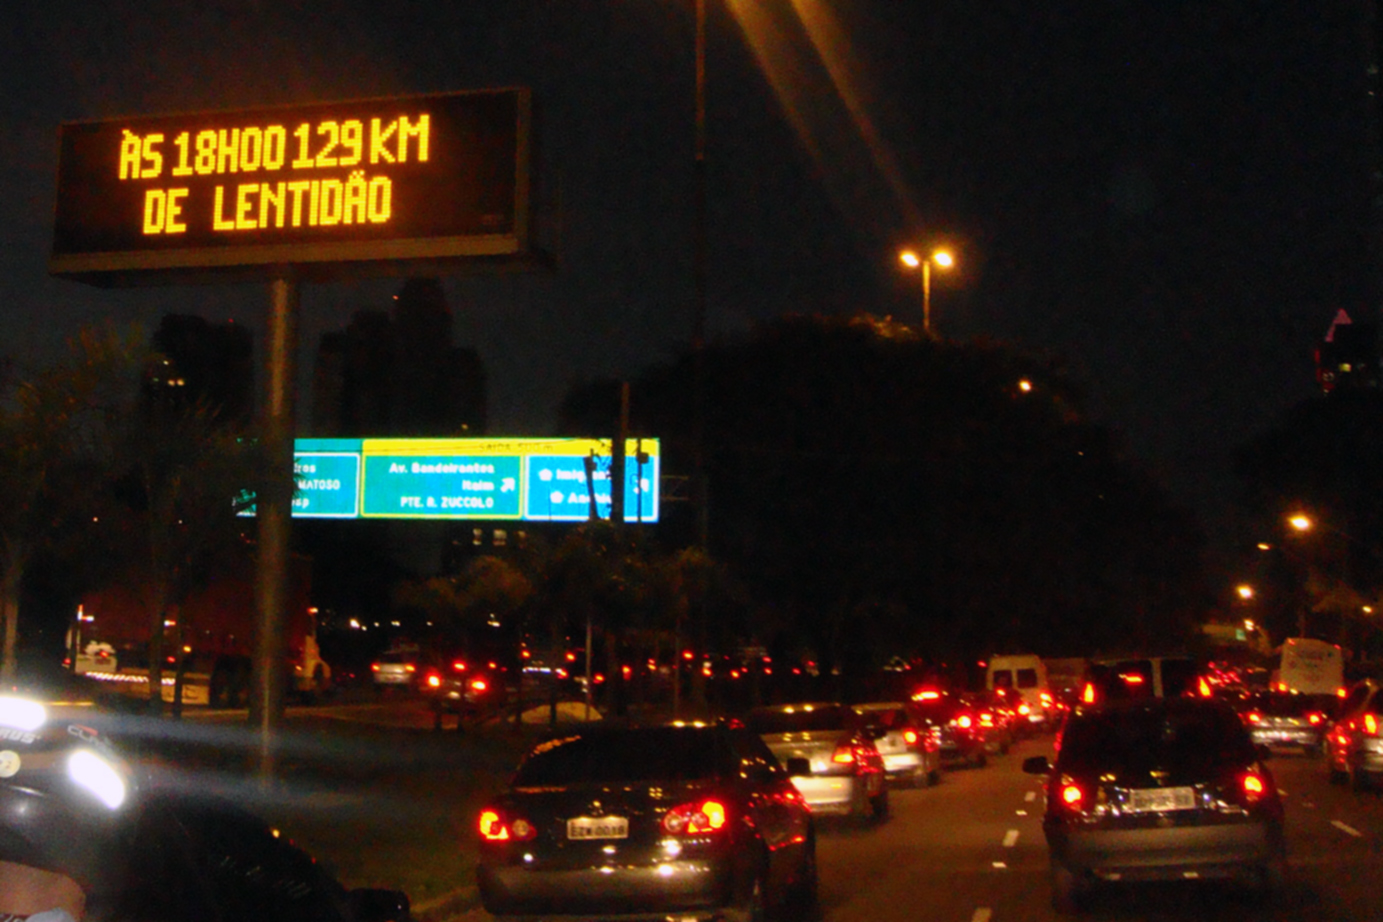
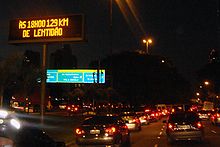 Traffic congestion on Marginal Pinheiros, near downtown São Paulo. According to Time magazine, São Paulo has the world's worst traffic jams.[1] Drivers are informed through variable message signs the prevailing queue length.
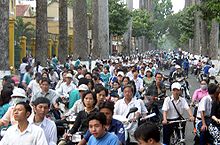 Common traffic in Ho Chi Minh City, Vietnam.
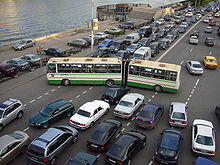 Congestion on a city road in Moscow.
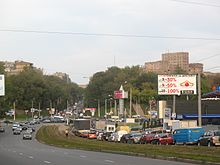 Congestion in Kharkov.
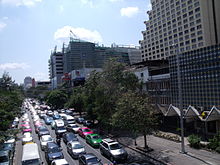 Bangkok is notorious for its traffic congestion.
Traffic congestion is a condition on road networks that occurs as use increases, and is characterized by slower speeds, longer trip times, and increased vehicular queueing. The most common example is the physical use of roads by vehicles. When traffic demand is great enough that the interaction between vehicles slows the speed of the traffic stream, this results in some congestion. As demand approaches the capacity of a road (or of the intersections along the road), extreme traffic congestion sets in. When vehicles are fully stopped for periods of time, this is colloquially known as a traffic jam or traffic snarl-up.
Contents
Causes
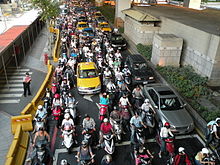 Congestion on a street in Taipei consisting primarily of motorcycles.
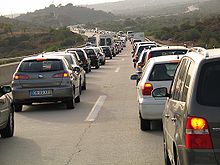 Congestion caused by a road accident, Algarve, Portugal.
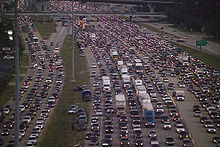 Congestion caused by evacuees fleeing Hurricane Rita. Traffic in all lanes of the highway is traveling in the same direction.
Traffic congestion occurs when a volume of traffic or modal split generates demand for space greater than the available road capacity; this point is commonly termed saturation. There are a number of specific circumstances which cause or aggravate congestion; most of them reduce the capacity of a road at a given point or over a certain length, or increase the number of vehicles required for a given volume of people or goods. About half of U.S. traffic congestion is recurring, and is attributed to sheer weight of traffic; most of the rest is attributed to traffic incidents, road work and weather events.[2]
Traffic research still cannot fully predict under which conditions a "traffic jam" (as opposed to heavy, but smoothly flowing traffic) may suddenly occur. It has been found that individual incidents (such as accidents or even a single car braking heavily in a previously smooth flow) may cause ripple effects (a cascading failure) which then spread out and create a sustained traffic jam when, otherwise, normal flow might have continued for some time longer.[3]
Mathematical theories
Some traffic engineers have attempted to apply the rules of fluid dynamics to traffic flow, likening it to the flow of a fluid in a pipe. Congestion simulations and real-time observations have shown that in heavy but free flowing traffic, jams can arise spontaneously, triggered by minor events ("butterfly effects"), such as an abrupt steering maneuver by a single motorist. Traffic scientists liken such a situation to the sudden freezing of supercooled fluid.[4] However, unlike a fluid, traffic flow is often affected by signals or other events at junctions that periodically affect the smooth flow of traffic. Alternative mathematical theories exist, such as Boris Kerner's three-phase traffic theory (see also spatiotemporal reconstruction of traffic congestion).
Because of the poor correlation of theoretical models to actual observed traffic flows, transportation planners and highway engineers attempt to forecast traffic flow using empirical models. Their working traffic models typically use a combination of macro-, micro- and mesoscopic features, and may add matrix entropy effects, by "platooning" groups of vehicles and by randomising the flow patterns within individual segments of the network. These models are then typically calibrated by measuring actual traffic flows on the links in the network, and the baseline flows are adjusted accordingly.
It is now claimed that equations can predict these in detail:
- Phantom jams can form when there is a heavy volume of cars on the road. In that high density of traffic, small disturbances (a driver hitting the brake too hard, or getting too close to another car) can quickly become amplified into a full-blown, self-sustaining traffic jam...
- A team of MIT mathematicians has developed a model that describes how and under what conditions such jams form, which could help road designers minimize the odds of their formation. The researchers reported their findings May 26 in the online edition of Physical Review E.
- Key to the new study is the realization that the mathematics of such jams, which the researchers call 'jamitons,' are strikingly similar to the equations that describe detonation waves produced by explosions, says Aslan Kasimov, lecturer in MIT's Department of Mathematics. That discovery enabled the team to solve traffic jam equations that were first theorized in the 1950s.[5]
Economic theories
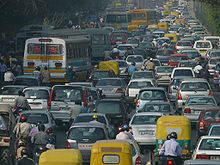 India's economic surge has resulted in a massive increase in the number of private vehicles on its roads, overwhelming the transport infrastructure. Shown here is a traffic jam in Delhi.
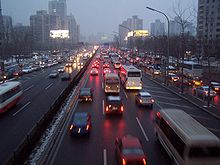 As in India, China's economic surge has resulted in a massive increase in the number of private vehicles on its roads overwhelming the transport infrastructure. Shown here is a traffic jam in Beijing.
Congested roads can be seen as an example of the tragedy of the commons. Because roads in most places are free at the point of usage, there is little financial incentive for drivers not to over-use them, up to the point where traffic collapses into a jam, when demand becomes limited by opportunity cost. Privatization of highways and road pricing have both been proposed as measures that may reduce congestion through economic incentives and disincentives. Congestion can also happen due to non-recurring highway incidents, such as a crash or roadworks, which may reduce the road's capacity below normal levels.
Economist Anthony Downs argues that rush hour traffic congestion is inevitable because of the benefits of having a relatively standard work day. In a capitalist economy, goods can be allocated either by pricing (ability to pay) or by queueing (first-come first-serve); congestion is an example of the latter. Instead of the traditional solution of making the "pipe" large enough to accommodate the total demand for peak-hour vehicle travel (a supply-side solution), either by widening roadways or increasing "flow pressure" via automated highway systems, Downs advocates greater use of road pricing to reduce congestion (a demand-side solution, effectively rationing demand), in turn plowing the revenues generated therefrom into public transportation projects.
Classification
Qualitative classification of traffic is often done in the form of a six letter A-F level of service (LOS) scale defined in the Highway Capacity Manual, a US document used (or used as a basis for national guidelines) worldwide. These levels are used by transportation engineers as a shorthand and to describe traffic levels to the lay public. While this system generally uses delay as the basis for its measurements, the particular measurements and statistical methods vary depending on the facility being described. For instance, while the percent time spent following a slower-moving vehicle figures into the LOS for a rural two-lane road, the LOS at an urban intersection incorporates such measurements as the number of drivers forced to wait through more than one signal cycle.[6]
Traffic congestion occurs in time and space, i.e., it is a spatiotemporal process. Therefore, another classification schema of traffic congestion is associated with some common spatiotemporal features of traffic congestion found in measured traffic data. Common spatiotemporal empirical features of traffic congestion are those features, which are qualitatively the same for different highways in different countries measured during years of traffic observations. Common features of traffic congestion are independent on weather, road conditions and road infrastructure, vehicular technology, driver characteristics, day time, etc. Examples of common features of traffic congestion are the features [J] and [S] for, respectively, the wide moving jam and synchronized flow traffic phases found in Kerner’ three-phase traffic theory. The common features of traffic congestion can be reconstructed in space and time with the use of the ASDA and FOTO models.
Negative impacts
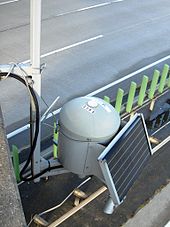 Traffic congestion detector in Germany.
Traffic congestion has a number of negative effects:
- Wasting time of motorists and passengers ("opportunity cost"). As a non-productive activity for most people, congestion reduces regional economic health.
- Delays, which may result in late arrival for employment, meetings, and education, resulting in lost business, disciplinary action or other personal losses.
- Inability to forecast travel time accurately, leading to drivers allocating more time to travel "just in case", and less time on productive activities.
- Wasted fuel increasing air pollution and carbon dioxide emissions owing to increased idling, acceleration and braking.
- Wear and tear on vehicles as a result of idling in traffic and frequent acceleration and braking, leading to more frequent repairs and replacements.
- Stressed and frustrated motorists, encouraging road rage and reduced health of motorists
- Emergencies: blocked traffic may interfere with the passage of emergency vehicles traveling to their destinations where they are urgently needed.
- Spillover effect from congested main arteries to secondary roads and side streets as alternative routes are attempted ('rat running'), which may affect neighborhood amenity and real estate prices.
Countermeasures
It has been suggested by some commentators[who?] that the level of congestion that society tolerates is a rational (though not necessarily conscious)[citation needed] choice between the costs of improving the transportation system (in infrastructure or management) and the benefits of quicker travel. Others[who?] link it largely to subjective lifestyle choices, differentiating between car-owning and car-free households.
Road infrastructure
- Junction improvements
- Grade separation, using bridges (or, less often, tunnels) freeing movements from having to stop for other crossing movements
- Ramp signalling, 'drip-feeding' merging traffic via traffic signals onto a congested motorway-type roadway
- Reducing junctions
- Local-express lanes, providing through lanes that bypass junction on-ramp and off-ramp zones
- Limited-access road, roads that limit the type and amounts of driveways along their lengths
- Reversible lanes, where certain sections of highway operate in the opposite direction on different times of the day/ days of the week, to match asymmetric demand. This may be controlled by Variable-message signs or by movable physical separation
- Separate lanes for specific user groups (usually with the goal of higher people throughput with fewer vehicles)
- Bus lanes as part of a busway system
- HOV lanes, for vehicles with at least three (sometimes at least two) riders, intended to encourage carpooling
- Slugging, impromptu carpooling at HOV access points, on a hitchhiking or payment basis
- Market-based carpooling with pre-negotiated financial incentives for the driver
Urban planning and design
City planning and urban design practices can have a huge impact on levels of future traffic congestion, though they are of limited relevance for short-term change.
- Grid plans including Fused Grid road network geometry, rather than tree-like network topology which branches into cul-de-sacs (which reduce local traffic, but increase total distances driven and discourage walking by reducing connectivity). This avoids concentration of traffic on a small number of arterial roads and allows more trips to be made without a car.
- Zoning laws that encourage mixed-use development, which reduces distances between residential, commercial, retail, and recreational destinations (and encourage cycling and walking)
- Carfree cities, car-light cities, and eco-cities designed to eliminate the need to travel by car for most inhabitants.[7][8]
- Transit-oriented development are residential and commercial areas designed to maximize access to public transport.
Supply and demand
See also: Transportation Demand Management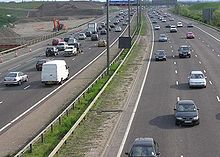 Widening works underway on the M25 motorway to increase the number of lanes.
Congestion can be reduced by either increasing road capacity (supply), or by reducing traffic (demand). Capacity can be increased in a number of ways, but needs to take account of latent demand otherwise it may be used more strongly than anticipated. Critics of the approach of adding capacity have compared it to "fighting obesity by letting out your belt" (inducing demand that did not exist before).[9][10] Reducing road capacity has in turn been attacked as removing free choice as well as increasing travel costs and times.
Increased supply can include:
- Adding more capacity at bottlenecks (such as by adding more lanes at the expense of hard shoulders or safety zones, or by removing local obstacles like bridge supports and widening tunnels)
- Adding more capacity over the whole of a route (generally by adding more lanes)
- Creating new routes
- Traffic management improvements (see separate section below)
Reduction of demand can include:
- Parking restrictions, making motor vehicle use less attractive by increasing the monetary and non-monetary costs of parking, introducing greater competition for limited city or road space.[11] Most transport planning experts agree that free parking distorts the market in favour of car travel, exacerbating congestion.[12][13]
- Park and ride facilities allowing parking at a distance and allowing continuation by public transport or ride sharing. Park-and-ride car parks are commonly found at metro stations, freeway entrances in suburban areas, and at the edge of smaller cities.
- Reduction of road capacity to force traffic onto other travel modes. Methods include traffic calming and the shared space concept.
- Road pricing, charging money for access onto a road/specific area at certain times, congestion levels or for certain road users
- "Cap and trade", in which only licensed cars are allowed on the roads.[14] A limited quota of car licences are issued each year and traded in a free market fashion. This guarantees that the number of cars does not exceed road capacity while avoiding the negative effects of shortages normally associated with quotas. However since demand for cars tends to be inelastic, the result are exorbitant purchase prices for the licenses, pricing out the lower levels of society, as seen Singapore's Certificate of Entitlement scheme.[15]
- Congestion pricing, where a certain area, such as the inner part of a congested city, is surrounded with a cordon into which entry with a car requires payment. The cordon may be a physical boundary (i.e., surrounded by toll stations) or it may be virtual, with enforcement being via spot checks or cameras on the entry routes. Major examples are Singapore's electronic road pricing, the London congestion charge system, Stockholm congestion tax and the use of HOT lanes predominately in North America.
- Road space rationing, where regulatory restrictions prevent certain types of vehicles from driving under certain circumstances or in certain areas.
- Number plate restrictions based on days of the week, as practiced in several large cities in the world, such as Athens,[16] Mexico City and São Paulo.[17] In effect, such cities are banning a different part of the automobile fleet from roads each day of the week. Mainly introduced to combat smog, these measures also reduce congestion. A weakness of this method is that richer drivers can purchase a second or third car to circumvent the ban.[citation needed]
- Permits, where only certain types of vehicles (such as residents) are permitted to enter a certain area, and other types (such as through-traffic) are banned.[17] For example, Bertrand Delanoë, the mayor of Paris, has proposed to impose a complete ban on motor vehicles in the city's inner districts, with exemptions only for residents, businesses, and the disabled.[18]
- Policy approaches, which usually attempt to provide either strategic alternatives or which encourage greater usage of existing alternatives through promotion, subsidies or restrictions.
- Incentives to use public transport, increasing modal shares. This can be achieved through infrastructure investment, subsidies, transport integration, pricing strategies that decrease the marginal cost/fixed cost ratios,[19][20] improved timetabling and greater priority for buses to reduce journey time e.g. [Bus Lanes], [BTR] .[21][22]
- Cycling promotion through legislation, cycle facilities, subsidies, and awareness campaigns.[23] The Netherlands has been pursuing cycle friendly policies for decades, and around a quarter of their commuting is done by bicycle.[24][25]
- Telecommuting encouraged through legislation and subsidies.[26]
- Online shopping promotion,[27][28] potentially with automated delivery booths helping to solve the last mile problem and reduce shopping trips made by car.[29]
Traffic management
Use of so-called Intelligent transportation system, which guide traffic:
- Traffic reporting, via radio, GPS or possibly mobile phones, to advise road users
- Variable message signs installed along the roadway, to advise road users
- Navigation systems, possibly linked up to automatic traffic reporting
- Traffic counters permanently installed, to provide real-time traffic counts
- Convergence indexing road traffic monitoring, to provide information on the use of highway on-ramps
- Automated highway systems, a future idea which could reduce the safe interval between cars (required for braking in emergencies) and increase highway capacity by as much as 100% while increasing travel speeds[citation needed]
- Parking guidance and information systems providing dynamic advice to motorists about free parking
- Active Traffic Management[30] system opens up UK motorway hard shoulder as an extra traffic lane, it uses CCTV and VMS to control and monitor the traffic's use of the extra lane
Other associated
- School opening times arranged to avoid rush hour traffic (in some countries, private car school pickup and drop-off traffic are substantial percentages of peak hour traffic).[citation needed]
- Considerate driving behaviour promotion and enforcement. Driving practices such as tailgating and frequent lane changes can reduce a road's capacity and exacerbate jams. In some countries signs are placed on highways to raise awareness, while others have introduced legislation against inconsiderate driving.
- Visual barriers to prevent drivers from slowing down out of curiosity (often called "rubbernecking" in the United States). This often includes accidents, with traffic slowing down even on roadsides physically separated from the crash location. This also tends to occur at construction sites, which is why some countries have introduced rules that motorway construction has to occur behind visual barrier
- Speed limit reductions, as practiced on the M25 motorway in London. With lower speeds allowing cars to drive closer together, this increases the capacity of a road. Note that this measure is only effective if the interval between cars is reduced, not the distance itself. Low intervals are generally only safe at low speeds.
- Lane splitting/filtering, where space-efficient vehicles, usually motorcycles, scooters, and ultra-narrow cars ride or drive in the space between cars, buses, and trucks. This is however illegal in many countries as it is perceived as a safety risk.[31]
By country
Australia
Traffic during peak hours in major Australian cities, such as Melbourne, Sydney, Brisbane and Perth, is usually very congested and can cause considerable delay for motorists. Australians rely mainly on radio and television to obtain current traffic information. GPS, webcams, and online resources are increasingly being used to monitor and relay traffic conditions to motorists.[32] Measures put in place by the federal and state government to combat traffic congestion include construction of new road infrastructure and increased investment in public transport. In Brisbane, ongoing road works projects on many major roads have caused ongoing congestion throughout the city and increased commutes considerably.[citation needed]
Brazil
 Typical traffic jam in São Paulo downtown, despite road space rationing by plate number. Rua da Consolação, São Paulo, Brazil.
In Brazil the recent records of traffic jams over the major big cities are recognized by public authorities as one of the main challenges for São Paulo, Rio de Janeiro, Belo Horizonte, Brasilia, Curitiba and Porto Alegre, where due to the country's economic bonanza, the automobile fleets have almost doubled in several of these cities from 2000 to 2008.
According to Time magazine, São Paulo has the world's worst daily traffic jams.[1] On June 10, 2009, the historical record was set with more than 293 kilometres (182 mi) of accumulated queues out of 835 km (522 mi) being monitored.[33] Despite implementation since 1997 of road space rationing by the last digit of the plate number during rush hours every weekday, traffic in this 20 million city still experiences severe congestion. According to experts, this is due to the accelerated rate of motorization occurring since 2003, in São Paulo the fleet is growing at a rate of 7.5% per year, with almost 1,000 new cars bought in the city every day, and the limited capacity of public transport. The subway has only 61 kilometres (38 mi) of lines, though 35 further kilometres are under construction or planned by 2010. Every day, many citizens spend between three up to four hours behind the wheel. In order to mitigate the aggravating congestion problem, since June 30, 2008 the road space rationing program was expanded to include and restrict trucks and light commercial vehicles.[34][35]
Canada
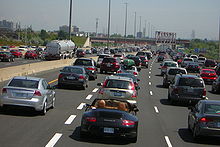 Highway 401 in Ontario, which passes through Toronto, suffers chronic traffic congestion despite its immense width (up to 18 lanes), as its average speed varies between 31km/h and 52km/h in 2008. The speed limit is 100 km/h.[36][37]
According to the Toronto Board of Trade, in 2010, Toronto is ranked as the most congested city of 19 surveyed cities, with an average commute time of 80 minutes.[38]
China
The August 2010 China National Highway 110 traffic jam in Hebei province, China, is considered the world's worst traffic jam ever, as traffic congestion stretched more than 100 kilometres (62 mi) from August 14 to the 26, including at least 11 days of total gridlock.[39][40][41] The event was caused by a combination of road works and thousands of coal trucks from Inner Mongolia’s coalfields that travel daily to Beijing. The New York Times has called this event the "Great Chinese Gridlock of 2010."[41][42]
Towards the end of 2010, Beijing announced a series of drastic measures to tackle the city's traffic jam, including limiting the number of new plates issued to passenger cars to 20,000 a month and barring cars of non-Beijing plates from entering areas within the Fifth Ring Road during rush hours.[43]
Colombia
In Bogotá the excessive traffic jams cause high levels of stress in people, and are the main cause of air pollution. The problem has been mitigated partially since 2000 through the implementation of the TransMilenio, a bus rapid transit system that has been improving mobility throughout the city. The city also restricts use of vehicles several days each week depending on the last digits of license plates. However, this system, called 'Pico y placa' tends to promote the purchase of second cars by the wealthy.[citation needed]
Hong Kong
Hong Kong aborted a congestion pricing system in the 1980s due to public pressure and has since relied on a vehicle high purchase tax to discourage overall car purchasing but has developed no localised congestion management techniques, However the Transport Department in Hong Kong has set up websites with maps showing congestion for the Cross Harbour Tunnel, it has also set up signs on both sides of the harbour telling drivers which is the quickest way to get to the other side of Victoria Harbour.
Iran
Because of inadequate public transportation and high population density traffic congestion is a common problem in different cities like Mash'had, Isfahan, Shiraz and especially Tehran (capital city of Iran). Recently developing Metro and BRT systems in Tehran and strategies for limiting gas uses has been applied to reduce car using, but unfortunately the problem is still crucial.
Netherlands
The road network in the Netherlands is usually congested in the morning and afternoon rush hour on working days. However, the rush hour periods seem to have become longer and longer and one may occasionally run into congestion any time of the day or night. Commuter traffic to and from major cities such as Amsterdam, Rotterdam, The Hague, Utrecht, Eindhoven, Zwolle, Enschede and Groningen may cause congestion. Congestion is difficult to resolve because the Netherlands is a relatively densely populated country where there is little room for expansion. Proposals for a "pay per distance travelled" is thought to discourage car driving but has not been implemented yet due to car owner resistance.
New Zealand
New Zealand has followed strongly car-oriented transport policies since after World War II (especially in Auckland, where one third of the country's population lives),[44] and currently has one of the highest car-ownership rates per capita in the world, after the United States.[45] Because of the negative results, congestion in the big centres is a major problem. Current measures include both the construction of new road infrastructure as well as increased investment in public transport, which had strongly declined in all cities of the country except Wellington.
United Kingdom
In the United Kingdom the inevitability of congestion in some urban road networks has been officially recognised since the Department for Transport set down policies based on the report Traffic in Towns in 1963:
Even when everything that it is possibly to do by way of building new roads and expanding public transport has been done, there would still be, in the absence of deliberate limitation, more cars trying to move into, or within our cities than could possibly be accommodated..[46]
The Department for Transport sees growing congestion as one of the most serious transport problems facing the UK.[47] On 1 December 2006, Rod Eddington published a UK government-sponsored report into the future of Britain's transport infrastructure. The Eddington Transport Study set out the case for action to improve road and rail networks, as a "crucial enabler of sustained productivity and competitiveness". Eddington has estimated that congestion may cost the economy of England £22 bn a year in lost time by 2025. He warned that roads were in serious danger of becoming so congested that the economy would suffer.[48] At the launch of the report Eddington told journalists and transport industry representatives introducing road pricing to encourage drivers to drive less was an "economic no-brainer". There was, he said "no attractive alternative". It would allegedly cut congestion by half by 2025, and bring benefits to the British economy totalling £28 bn a year.[49]
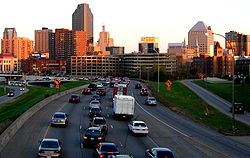
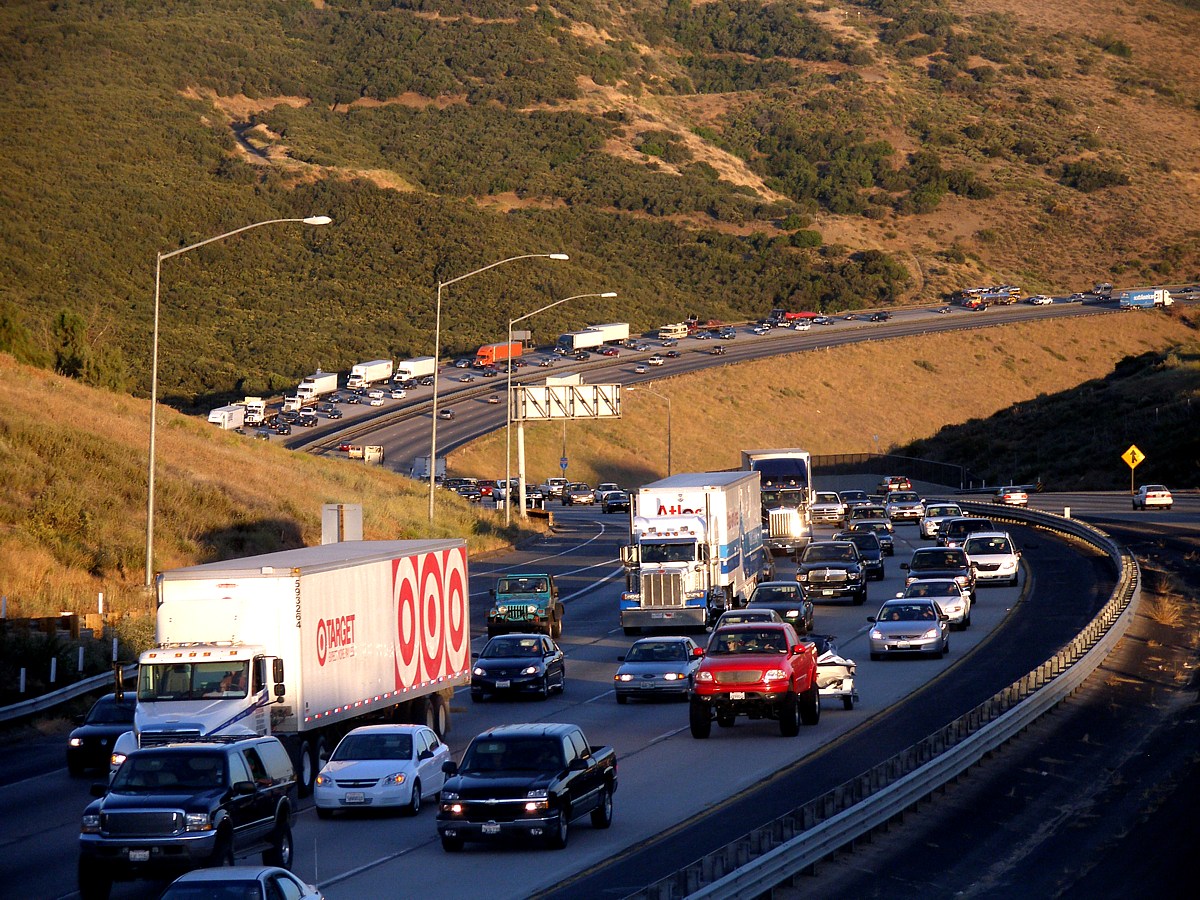
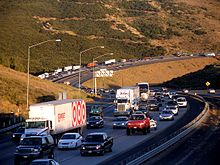 On Fridays in California, Interstate 5 is often congested as Los Angeles residents travel north for the weekend.
United States
The Texas Transportation Institute estimated that, in 2000, the 75 largest metropolitan areas experienced 3.6 billion vehicle-hours of delay, resulting in 5.7 billion U.S. gallons (21.6 billion liters) in wasted fuel and $67.5 billion in lost productivity, or about 0.7% of the nation's GDP. It also estimated that the annual cost of congestion for each driver was approximately $1,000 in very large cities and $200 in small cities. Traffic congestion is increasing in major cities and delays are becoming more frequent in smaller cities and rural areas.
By late 2010 the five cities in the United States with the worst rush hour traffic congestion were New York City, Washington, D.C., San Francisco, Seattle and Los Angeles.[50]
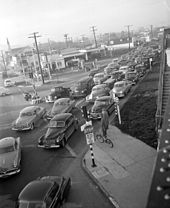 Traffic jam in Los Angeles, 1953
See also
- Gridlock, total standstill of traffic
- Journal of Transport and Land Use
- Peak car
- Smeed's law
- Traffic flow, the mathematical study of traffic flows
- Transims
- Transportation demand management, operational solutions
- Transportation forecasting
- Traffic Message Channel (TMC)
- Three-phase traffic theory
- Traffic congestion: Reconstruction with Kerner’s three-phase theory
References
- ^ a b Andrew Downie (2008-04-21). "The World's Worst Traffic Jams". Time. http://www.time.com/time/world/article/0,8599,1733872,00.html. Retrieved 2008-06-20.
- ^ Federal Highway Administration "Congestion: A National Issue". 2008-08-29. http://www.ops.fhwa.dot.gov/aboutus/opstory.htm Federal Highway Administration. Retrieved 2008-09-25.
- ^ "Science Hobbyist: Traffic Waves". http://www.amasci.com/amateur/traffic/traffic1.html.
- ^ Critical Mass - Ball, Philip, ISBN 0-09-945786-5
- ^ Mathematicians Take Aim At 'Phantom' Traffic Jams
- ^ Traffic Engineering, Third Edition. Roger P. Roess, Elana S. Prassas, and William R. McShane. ISBN 0-13-142471-8
- ^ British to help China build 'eco-cities' - The Observer, November 6, 2005
- ^ Wired, Pop-Up Cities: China Builds a Bright Green Metropolis, 04.24.07
- ^ Dreaming of a Clean Car? - Kay, Jane Holtz, journalist and author
- ^ 2005 Mayors Luncheon (from the NAIOP website, Tampa Bay, United States)
- ^ Hermann Knoflacher (2006). "A new way to organize parking: the key to a successful sustainable transport system for the future". Environment and Urbanization (International Institute for Environment and Development) 18 (2): 387–400. doi:10.1177/0956247806069621.
- ^ Shoup, Donald C. (2005). The High Cost of Free Parking. American Planning Association. ISBN 1884829988.
- ^ Knoflacher, Hermann (January 2001) [2001] (in German). Stehzeuge. Der Stau ist kein Verkehrsproblem.. Vienna: Böhlau. ISBN 978-3205989882.
- ^ Goddard, Haynes (July 1997). "Using Tradeable Permits to Achieve Sustainability in the World's Large Cities". Environmental and Resource Economics (Springer Netherlands) 10 (1): 63–99. doi:10.1023/A:1026444113237.
- ^ The high cost of motoring in Singapore - Toh, Rex S., Business Horizons, March–April, 1994
- ^ "LEDA Measure: License plate based traffic restrictions, Athens, Greece". LEDA database. http://www.leda.ils.nrw.de/database/measures/meas0205.htm. Retrieved 2008-04-09.
- ^ a b "Regulatory restrictions". KonSULT, the Knowledgebase on Sustainable Urban Land use and Transport. Institute for Transport Studies, University of Leeds. http://www.elseviersocialsciences.com/transport/konsult/private/level2/instruments/instrument009/l2_009a.htm. Retrieved 2008-04-20.
- ^ Henley, Jon (2005-03-15). "Paris drive to cut traffic in centre by 75%". The Guardian (London: Guardian Media Group). http://www.guardian.co.uk/world/2005/mar/15/france.jonhenley.
- ^ Simon, Hermann; Robert J Dolan. "Price Customization". Marketing Management (American Marketing Association) 7 (3).
- ^ Link, Heike (March 2004). "PEP-A Yield-Management Scheme for Rail Passenger Fares in Germany". Japan Railway & Transport Review 38: 54.
- ^ Andersen, Bjørn (January 1993). "A survey of the Swiss public transport system and policy". Transport Reviews 13 (1): 61–81. doi:10.1080/01441649308716835.
- ^ Adrian May (2007-03-16). "The philosophy and practice of Taktfahrplan: a case-study of the East Coast Main Line" (Working Paper). Working Paper 579. Institute of Transport Studies, University of Leeds, Leeds, UK. http://eprints.whiterose.ac.uk/2058/. Retrieved 2008-04-27.
- ^ Ogilvie, David; Matt Egan, Val Hamilton, Mark Petticrew (2004-09-22). "Promoting walking and cycling as an alternative to using cars: systematic review". British Medical Journal (BMJ Publishing Group) 329 (7469): 763. doi:10.1136/bmj.38216.714560.55. PMC 520994. PMID 15385407. http://www.pubmedcentral.nih.gov/articlerender.fcgi?tool=pmcentrez&artid=520994.
- ^ Rietveld, Piet; Vanessa Daniel (August 2004). "Determinants of bicycle use: do municipal policies matter?". Transportation Research Part A: Policy and Practice (Elsevier) 38 (7): 531–550. doi:10.1016/j.tra.2004.05.003.
- ^ "Cycling in the Netherlands". Rijkswaterstaat (Dutch Ministry of Transport, Public Works and Water Management). http://www.fietsberaad.nl/library/repository/bestanden/Cycling%20in%20the%20Netherlands%20VenW.pdf.
- ^ Matt Rosenberg (2007-09-26). "Slow But Steady "Telework Revolution" Eyed". Cascadia Prospectus. http://www.discovery.org/scripts/viewDB/index.php?command=view&program=DI%20Main%20Page%20-%20News&id=4235. Retrieved 2007-10-07.
- ^ "Motoring Towards 2050 – Roads and Reality". RAC foundation. http://www.racfoundation.org/index.php?option=com_content&task=view&id=535&Itemid=31.
- ^ "Smarter Choices - Changing the way we travel". Department for Transport. http://www.dft.gov.uk/pgr/sustainable/smarterchoices/ctwwt/.
- ^ "New & Innovative Concepts for Helping European Transport Sustainability". Niches Policy seminar. Committee of the Regions; Niches. December 2006.
- ^ Highways Agency (2007-10-25). "M42 Active Traffic Management Results –First Six Months" (PDF). Department for Transport. http://www.dft.gov.uk/pgr/roads/tpm/m42activetrafficmanagement/ATM6MonthSummaryResultsforP1.pdf. Retrieved 2007-12-31.[dead link]
- ^ WhyBike? (2006-03-06). "All the info you need on lanesharing (lanesplitting)". http://www.whybike.com/motorcycle274.htm.
- ^ "Traffic Jam welcomes you". Traffic Jam: Latest on traffic conditions. Hitz Techno Pvt. Ltd.. 12/9/08. http://www.trafficjam.com. Retrieved 2009-02-01.
- ^ SP registra 293 km de congestionamentos; motorista deve evitar centro expandido até as 22h
- ^ "Kassab restringe carga e descarga em SP e inclui caminhões no rodízio" (in Portuguese). Folha de São Paulo Online. 2008-04-01. http://www1.folha.uol.com.br/folha/cotidiano/ult95u387928.shtml. Retrieved 2008-06-20.
- ^ Folha de São Paulo (2008-06-18). "Kassab cria rodízio para caminhão no centro" (in Portuguese). INTELOG. http://www.intelog.net/site/default.asp?TroncoID=907492&SecaoID=508074&SubsecaoID=948063&Template=../artigosnoticias/user_exibir.asp&ID=252171&Titulo=Kassab%20cria%20rod%EDzio%20para%20caminh%E3o%20no%20centro. Retrieved 2008-06-20.
- ^ Kalinowski, Tess (7 January 2010). "GTA commuter crawl gets slower". Toronto Star. http://www.thestar.com/news/gta/transportation/article/747348--gta-commuter-crawl-gets-slower. Retrieved 23 December 2010.
- ^ Kennedy, Brendan (7 January 2010). "GTA's worst routes: Highway 401". Toronto Star. http://www.thestar.com/news/gta/transportation/article/747327--gta-s-worst-routes-highway-401. Retrieved 23 December 2010.
- ^ John Spears; Tess Kalinowski (30 March 2010). "Toronto commuting times worst of 19 major cities, study says". Toronto Star. http://www.thestar.com/news/gta/transportation/article/787400--toronto-commuting-times-worst-of-19-major-cities-study-says. Retrieved 23 December 2010.
- ^ Leo Hickman (2010-08-23). "Welcome to the world's worst traffic jam". The Guardian. http://www.guardian.co.uk/technology/2010/aug/23/worlds-worst-traffic-jam. Retrieved 2010-09-20.
- ^ "The great crawl of China". The Economist. 2010-08-26. http://www.economist.com/node/16909167?story_id=16909167. Retrieved 2010-09-20.
- ^ a b Michael Wines (2010-08-27). "China’s Growth Leads to Problems Down the Road". New York Times. http://www.nytimes.com/2010/08/28/world/asia/28china.html?_r=1&scp=2&sq=straddling%20bus&st=cse. Retrieved 2010-09-20.
- ^ Jonathan Watts (2010-08-24). "Gridlock is a way of life for Chinese". The Guardian. http://www.guardian.co.uk/world/2010/aug/24/china-60-mile-motorway-tailback. Retrieved 2010-09-20.
- ^ "To Tackle Traffic Jam, Beijing Sets New Car Plate Quota, Limits Out-of-Towners". ChinaAutoWeb.com. http://chinaautoweb.com/2010/12/to-tackle-traffic-jam-beijing-sets-new-car-plate-quota-limits-out-of-towners/.
- ^ Backtracking Auckland: Bureaucratic rationality and public preferences in transport planning - Mees, Paul; Dodson, Jago; Urban Research Program Issues Paper 5, Griffith University, April 2006
- ^ Modern Society (from Te Ara Encyclopedia of New Zealand. Accessed 2008-04-25.)
- ^ Traffic in Towns. Penguin Books in association with HMSO. 1963/4.
- ^ "Tackling congestion on our roads". Department for Transport. http://www.dft.gov.uk/pgr/roads/roadcongestion/.
- ^ "Delivering choice and reliability". Department for Transport. http://www.dft.gov.uk/press/speechesstatements/speeches/congestion.
- ^ Rod Eddington (December 2006). "The Eddington Transport Study". UK Treasury. http://www.dft.gov.uk/about/strategy/transportstrategy/eddingtonstudy/.
- ^ "New York Has Worst Traffic in North America, Report Says". New York Times. 2010-11-24. http://wheels.blogs.nytimes.com/2010/11/24/new-york-has-worst-traffic-in-north-america-report-says/. Retrieved 2010-11-27.
Further reading
- R. Wiedemann, Simulation des Straßenverkehrsflusses. Schriftenreihe des IfV, 8, 1974. Institut für Verkehrswesen. Universität Karlsruhe. (In German language).
- K. Nagel and M. Schreckenberg. A Cellular Automaton Model for Freeway Traffic. Journal de Physique I, 2:2221-2229, December 1992.
- K. Nagel. High-speed Microsimulations of Traffic Flow. PhD thesis, Universität zu Köln, 1994. [1]
- D. Chowdhury, L. Santen, and A. Schadschneider. Statistical Physics of Vehicular Traffic and Some Related Systems. Phys. Rep., 329:199-329, 2000. [2]
- D. Helbing. Traffic and related self-driven many-particle systems. Rev. Mod. Phys., 73(4):1067-1141, 2001. [3]
- Koslowsky, Meni; Avraham N. Kluger; and Mordechai Reich. Commuting Stress, New York: Plenum, 1995.
- Koslowksky, Meni, and Moshe Krausz. "On the Relationship Between Commuting, Stress Symptoms, and Attitudinal Measures", Journal of Applied Behavioral Sciences, December 1993:485-92.
- B.S. Kerner, Introduction to Modern Traffic Flow Theory and Control: The Long Road to Three-Phase Traffic Theory, Springer, Berlin, New York 2009
- B.S. Kerner, The Physics of Traffic, Springer, Berlin, New York 2004
External links
- Institute of Transportation Engineers
- S. Maerivoet, Modelling Traffic on Motorways: State-of-the-Art, Numerical Data Analysis, and Dynamic Traffic Assignment, Katholieke Universiteit Leuven, 2006
- The Physics of Traffic Jams
- How Traffic Works from HowStuffWorks.com
- Traffic Bulldog - Commuter Advocacy
- Big Traffic Jams: A Photo Tour — slideshow by Life magazine
- Anatomy of a traffic jam (entry explaining a type of traffic jam from a private blog)
Categories:- Road traffic management
- Transport reliability


Wikimedia Foundation. 2010.