- Risks to the Glen Canyon Dam
-
 Glen Canyon Dam viewed from inside lower Glen Canyon
The Glen Canyon Dam, a concrete arch dam on the Colorado River in the U.S. state of Arizona, has been associated with a large amount of risk, most notably the risk of its siltation and failure. Because of high silt content carried in by the Colorado and San Juan rivers, Lake Powell is gradually filling with sediment, decreasing its capacity; eventually the sediment will build up against the dam and affect its safe operation. [1] The dam, anchored in unstable Navajo sandstone (sometimes said to be "solidified sand dunes"),[2] nearly failed in 1983 as the result of a flood on the upper Colorado River.
Siltation, degradation of concrete and reinforcements, spillway operational problems, and unstable dam abutments are all key factors that affect the safe operation of the dam.[3] It is estimated that breaching of the dam for any reason would produce a floodwave that would overtop the Hoover Dam by up to 230 feet (70 m), i.e. a megatsunami.[1] [4] As the dam's useful lifespan is estimated by some to be no more than 85 to 100 years, the dam has been called "America's most regretted environmental mistake" by David Brower, then-head of the Sierra Club.[5] Other estimates, by the Bureau of Reclamation and others suggest a lifespan of between 500–700 years.[6]
Contents
Siltation
The Colorado River carries an estimated 44 million tons of sediment annually at Glen Canyon,[7] and as Lake Powell is the farthest large reservoir upstream on the Colorado River mainstem,[8] the sediment load is completely trapped in the reservoir as the Colorado discharges into it. This sediment is creating a steadily advancing "toe" of sediment, i.e. an underwater alluvial fan, that is advancing towards the dam. It is estimated that the sediment will reach the dam base in a minimum as low as eighty to one hundred years[1] or as far as 500 to 700 years, although it will take much more time for the sediment deposited there to reach higher on the dam and clog the outlet works, the lowest openings in the upstream face of the dam. If water level then drops, it may lower below the penstock openings, which are higher up on the dam face, then the release capacity of the dam drops to zero, and the Colorado River below the dam could remain dry until the next major spring inflow, and only springs, seeps and tributaries such as the Paria, Little Colorado and Virgin River would replenish its flow during these times, perhaps causing unprecedented drops in levels of Lake Mead as well.[1]
The primary failure mode for Glen Canyon dam will undoubtedly be an overtopping one spring caused by insufficient storage capacity (either a huge inflow, bigger than 1983, or insufficient storage capacity because the lake was too full of either water or sediment).
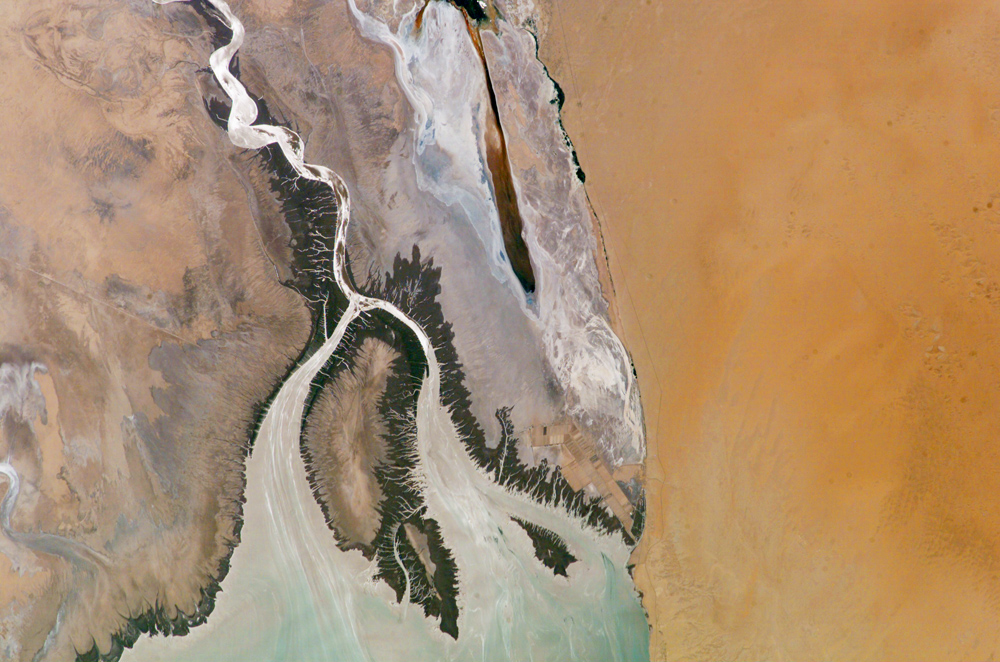
 Colorado River Delta today, showing inflows mostly from the Hardy River and other Mexican tributaries
An example of the fast deposition rate of Colorado River sediment is found in Lake Mead itself, where, before the completion of Glen Canyon Dam, ten percent of its storage was already compromised by sediment. When Lake Powell levels drop, sediments deposited in its upper reaches are carried into the receding water by the Colorado and its tributaries. One large flash flood caused by heavy rainfall could move all or most of these sediments into Lake Powell, creating a sudden loss of storage capacity. The only way to control sediment flow in the reservoir, without removing the dam outright, is by dredging.[9] Unfortunately, as Glen Canyon is remote and isolated, the cost of dredging (which would require to remove 84 tons per minute in order to keep pace with advancing sediment) is extremely high. Although the Colorado River Delta is the most ecologically friendly place for sediment to be dumped, the cost of transporting sediment from Glen Canyon to the Delta, which not only involves a long distance travelled as well as international negotiations (the Delta is located in Mexico) is $2.6 billion USD per year. [10]
Flooding
1983
In May 1983, three years after Lake Powell had first filled, an unusually long-lasting winter over the 108,335-square-mile (280,590 km2) Colorado River basin above the Glen Canyon Dam ended with a sudden influx of warm weather. Rain and snowmelt joined together to produce a combined inflow of over 111,500 cubic feet (3,160 m3) per second,[11] however, the Bureau of Reclamation predicts that the probable maximum flood at Glen Canyon is 697,000 cubic feet (19,700 m3) per second, almost 7 times that total, [6] and the average annual peak flow prior to 1963 was 93,400 cubic feet (2,640 m3) per second.[12] The Glen Canyon Dam has two tunnel spillways, capable of bypassing 276,000 cu ft/s (7,815 m3/s).[13] Making use of part of the old diversion tunnels that were used when the dam was built, the spillways were thus more economical to construct, but have less capacity and must have at least 30 percent clearance between the water level and the tunnel ceiling.[14] The dam also has a set of river outlet works designed to release 40,000 cubic feet (1,100 m3) per second, however, flaws in their expansion joints limit their releases to 15,000 cubic feet (420 m3) per second.[6] Finally, there are the releases from the power plant of the dam, which is capable of releasing 31,500 cubic feet (890 m3) per second.[15]
 The releases from the Glen Canyon Dam in May 1983
At the onset of the flood in 1983, several false weather predictions made the Bureau of Reclamation late in opening the spillways.[citation needed] At first, as inflows exceeded normal levels, the penstocks were opened to full release, and as inflow continued to rise, the river outlet works were also opened, discharging more water into the river below. The reservoir, however, continued to rise, and Reclamation finally decided to raise the floodgates. Other than test runs, this was the first time that the spillways had ever been put into operation for practical reasons, this time running at 20,000 cubic feet (570 m3) per second per tunnel. In several days, noticeable vibrations began to make themselves felt in the dam wall and surrounding rock. A close examination of water exiting the spillways revealed noticeable debris, including sandstone, which signaled severe erosion taking place. Reclamation responded by reducing releases by half, however, the rumblings continued, and it was not long before the spillways were shut down completely for examination.[14] The rumblings were so notable that a worker in the employee dining room, located near the power plant, was reported to say that it "sounded like the barrages that he had experienced in Vietnam". [16][17]
Subsequently, inspection crews were lowered down the spillway tunnels in a small cart to assess damage. What they found was that at tunnel bends, the force of the water, by means of cavitation,[16] had damaged and eroded the lining of the tunnel, which was 3-foot (0.91 m) concrete. At some places the erosion had completely worn away the lining, exposing the soft sandstone underneath; this was the source of much of the debris. The tunnels could not be closed for long, however: the National Weather Service was reporting more rainstorms in the Colorado River Basin, and the reservoir continued to rise. Reclamation opened the left spillway to 12,000 cubic feet (340 m3) per second; the right, which had suffered worse damage, was carrying 4,000 cubic feet (110 m3) per second. As the water level increased, wooden flashboards were installed on top of the spillway gates; this allowed reservoir water to rise 4 feet (1.2 m) while not increasing releases. The left tunnel, however, was suffering damage unknown until it began to show itself as a "surging, boiling flow that filled the portal".[14] The tunnel was now forming a hydraulic jump as it was turned into a "pressure conduit" by the surging flow of water, and as erosion threatened to collapse the tunnel, Reclamation had to open the gates further. The extra water would help to support the tunnel, but it would increase damage to the tunnel walls. Eventually, Reclamation attached even more boards to the spillway gates, allowing the reservoir to rise a further 8 feet (2.4 m) without increasing releases.[14]
 Spillway gates at Glen Canyon Dam during 1983 flood. Note the flashboards installed atop to prevent water from overtopping the gates.
The force of the water at the left tunnel was now eroding material away from the diversion plug (device blocking the old diversion tunnel) and surrounding sandstone at a rate of 1,000 tonnes per second; it was worried that the water would eventually erode around the diversion plug altogether, creating a connection to the reservoir floor. This uncontrolled spillage would cause the reservoir to drain. As the discharges from Glen Canyon Dam reached almost 90,000 cubic feet (2,500 m3) per second, with 32,000 cubic feet (910 m3) per second racing through the left spillway,[11] the 9,500,000 acre feet (11.7 km3) of flood storage space behind Hoover Dam was exhausted.[18] On July 15, 1983, Lake Powell reached its peak level, 1 foot (0.30 m) below the installed boards and only 6 feet (1.8 m) below the dam crest itself. Inflows to Lake Powell topped 120,000 cubic feet (3,400 m3) per second,[11][17] while releases from Glen Canyon topped 92,000 cubic feet (2,600 m3) per second. Eventually, Hoover Dam was also forced to open its gates; its discharge peaked at 40,000 cubic feet (1,100 m3) per second and still caused downstream flooding. As inflow lessened at the end of the flood, dam keepers were able to finally draw down Lake Powell; severe damage was found in both spillways. In the left spillway alone, inspection crews discovered a gap 32 feet (9.8 m) deep, 40 feet (12 m) wide, and 150 feet (46 m) long;[11] it was said that both tunnels had sustained similar damage but the left had suffered more.[14][17]
After the flood, it was suggested that the flashboards atop the spillway gates should be replaced with stronger boards and kept permanently; this would allow an "insurance" against a 1983-reminiscent flood.[15] An air slot was constructed in each spillway tunnel afterwards to prevent catastrophic cavitation events like those of 1983. Most surprising, however, is that the flood of 1983, although it nearly caused catastrophic disaster, it was a "relatively small flood".[19] It was, in fact, only a 25 year flood, or a flood that has a four percent chance of occurring in any given year.[11][17]
1984
 Glen Canyon Dam during the 1984 flood
After the floods of 1983, it was suggested that slots should be constructed in the Glen Canyon Dam spillways in order to maintain a cushion of air, preventing cavitation. Spillway upgrades and repairs commenced immediately after the 1983 floods receded, and continued through the winter of 1983-84. Through the winter, heavy snowpack was reported in the upper Colorado basin. It was feared that this would produce a flood greater than the 1983 one, and as the spillway repairs continued, water was constantly released through the dam power plant and outlet works, a rate of roughly 45,000 cubic feet (1,300 m3) per second. [20] As attempts were made to draw down Lake Powell, however, the upstream snowpack began to melt in spring of 1984, and water levels were soon rising again. Its highest level was reached in late June, several inches below the top of the flashboards. As summer continued, inflows decreased and the reservoir finally began to release. On August 12, 1984, the left spillway was repaired and was tested at 50,000 cubic feet (1,400 m3) per second for several days. No notable damage was recorded in the spillways. An added benefit was that the power plant, after running at full capacity for months, had provided more power than usual, thus replacing power that would otherwise be generated by oil.[11]
Factors contributing to a dam failure
In the Colorado River floods of 1983, the Glen Canyon Dam exhibited poorly designed and cavitating spillways, strong structural vibrations and as a result, an inability to bypass enough floodwater in the event of a major flood. After the 1983 flood, however, the spillways were redesigned to reduce or eliminate the cavitation damage seen in the 1983 flood by the use of air slots. These spillway revisions were tested successfully in 1984.[21] This revision basically eliminates the possibility of the dam being undermined via erosion of the spillways, and reduces the danger of the dam being over topped - the only reason the lake rose as high as it did was due to the flashboards placed atop the closed spillway gates.[21] If the reservoir rises over the dam crest it would overtop the dam and gradually erode it. This would be dangerous not only because the dam power plant is located at its base, but because the dam is built within porous, erosion-prone Navajo Sandstone; an overtopping would likely lead to erosion of the dam abutments and a subsequent failure.[14] In 1990, the Bureau of Reclamation prepared a study for a Glen Canyon Dam failure, predicting that the resulting flood would scour the bottom few hundred feet of the Grand Canyon, overtop Hoover Dam, and cause severe damage all along the lower Colorado River.[1]
Impacts of a failure
 Lake Powell with "bathtub ring"
In the event of dam failure with the Lake at high pool, about 27,000,000 acre feet (33 km3) of water would surge out of Lake Powell at an initial depth of over 500 feet (150 m). Downstream communities and perhaps every dam along the river, excluding possibly Hoover Dam, as well as riverside lowlands, would be flooded or obliterated. Located downstream from the Glen Canyon Dam are Hoover Dam forming Lake Mead, Davis Dam forming Lake Mohave, Parker Dam forming Lake Havasu, Palo Verde Dam, and other dams and reservoirs. Lake Havasu is also the starting point for the Colorado River Aqueduct, and in the event of a Glen Canyon Dam failure, water supply would be cut off to regions of southern California depending on damage to canal headworks. There is also a potential for the floodwave to once again break through Imperial Valley canal levees and flood the Salton Sea basin, as it did in 1905. [22] The failure of Glen Canyon Dam would also destroy up to 964 known archaeological sites, including 264 that it currently affects in the Grand Canyon.[10]
As the Glen Canyon Dam is the central element of the Colorado River Storage Project and also is vital for a large portion of Southwest water supply,[8] its failure would definitely cause severe water shortages in at least the areas covered by the system, which include residences, farmland and industry. Recreation on Lake Powell, which currently generates revenue for Glen Canyon National Recreation Area and the town of Page, Arizona, would also disappear with a dam failure although tourism is likely to continue or return to the broken dam site and the resurfaced Glen Canyon. As the dam generates a moderate amount of power, only 451 MW, the loss of the power plant would not have nationwide effects, though a loss of regional power and revenue for Reclamation would be instant.[8][23] A failure, however, would increase flows in the river over the long term as a sizable amount of water evaporates at Lake Powell instead of continuing downstream.[24]
References
- ^ a b c d e Haskell, Dave. "Creating a Sustainable Future". Grand Canyon River Guides. http://www.gcrg.org/bqr/16-1/future.html. Retrieved 2009-05-13.
- ^ "Glen Canyon Dam". DesertUSA.com. http://www.desertusa.com/gc/gcd/du_glencaydam.html. Retrieved 2009-05-16.
- ^ "Glen Canyon Dam". Grand Canyon River Guides. http://www.gcrg.org/bqr/11-1/glen.html. Retrieved 2009-05-13.
- ^ "Nuclear Green". http://nucleargreen.blogspot.com/2008/02/reactor-safety-and-dam-safety.html. Retrieved 2009-05-13.
- ^ "History of the River Restoration Movement". Glen Canyon Institute. http://www.glencanyon.org/library/riverrestoration.php. Retrieved 2009-05-13.
- ^ a b c "Glen Canyon Dam". Bureau of Reclamation. http://www.usbr.gov/dataweb/dams/az10307.htm. Retrieved 2009-05-14.[dead link]
- ^ "The One-Dam Solution". Living Rivers. July 2005. pp. 9. http://www.livingrivers.org/pdfs/TheOne-DamSolution.pdf. Retrieved 25 January 2011.
- ^ a b c "Colorado River Storage Project". U.S. Bureau of Reclamation. http://www.usbr.gov/projects/Project.jsp?proj_Name=Colorado%20River%20Storage%20Project. Retrieved 2009-05-14.
- ^ "Glen Canyon Institute Newsletter". Glen Canyon Institute. 4 May 2003. http://www.glencanyon.org/publications/newsletter/nl2.4.htm. Retrieved 2009-05-16.
- ^ a b "The One-Dam Solution". Colorado Riverkeeper, Bureau of Reclamation. July 2005. http://livingrivers.org/pdfs/TheOne-DamSolution.pdf. Retrieved 2009-05-14.
- ^ a b c d e f "The Confluence". Colorado Plateau River Guides. http://www.riversimulator.org/Resources/Legal/GCD/GCDemergency1983.pdf. Retrieved 2009-05-15.
- ^ "Controlled Flooding of the Colorado River in Grand Canyon: the Rationale and Data-Collection Planned". U.S. Geological Survey, Bureau of Reclamation and National Park Service. Grand Canyon Monitoring and Research Program. http://pubs.usgs.gov/fs/FS-089-96/. Retrieved 2009-05-16.
- ^ "Dam details: Glen Canyon Dam". U.S. Bureau of Reclamation. http://www.usbr.gov/projects/Facility.jsp?fac_Name=Glen+Canyon+Dam&groupName=Hydraulics+%26+Hydrology. Retrieved 25 January 2011.
- ^ a b c d e f Hannon, Steve. "The 1983 Flood at Glen Canyon". EarthScape. http://www.earthscape.org/p2/hp/hp_sum99/hp_sum99a.html. Retrieved 2009-05-14.[dead link]
- ^ a b Carothers, Steve. "The Glen Canyon Dam EIS: Random Thoughts and Revelations". http://www.gcrg.org/bqr/6-1/glencanyon.htm. Retrieved 2009-05-15.
- ^ a b Catchpoole, David. "Beware the bubble’s burst:Increased knowledge about cavitation highlights the destructive power of fast-flowing water". Creation Ministries International. http://creation.com/beware-the-bubble-s-burst. Retrieved 2009-04-14.[dead link]
- ^ a b c d "Canyon Legacy". Journal of the Dan O' Laurie Museum of Moab. www.riversimulator.org. http://www.riversimulator.org/Resources/Legal/GCD/KeysCanyonLegacy2007.pdf. Retrieved 2009-05-28.
- ^ Swain, Robert E.. "Evolution of the Hoover Dam Inflow Design Flood - A Study in Changing Methodologies". riversimulator.org. http://www.riversimulator.org/Resources/Legal/GCD/CoRiverFloods.pdf. Retrieved 2009-05-28.
- ^ Wegner, Dave. "Restoring Glen Canyon". Glen Canyon Institute. http://www.glencanyon.org/library/wegnerover.php. Retrieved 2009-05-15.
- ^ Assuming, roughly, that the river outlets have a capacity of 15000 and power plant has a rough capacity of 30000.
- ^ a b The Colorado in Flood. Bureau of Reclamation Video, on display at Carl Hayden Visitor Center
- ^ McClurg, Sue (March/April 1994). "The Salton Sea: The environmental and economic values of this vast inland lake prompt local officials to launch a new restoration effort". Water Education Foundation, Western Water. http://www.sci.sdsu.edu/salton/EnvirnEconValueSaltonSea.html. Retrieved 2009-05-14.
- ^ Ostler, Don A.. "Impact Evaluation of Lake Powell Surface Elevation Falling Below Minimum Power Pool". Upper Colorado River Commission. http://www.adwr.state.az.us/dwr/content/Find_by_Program/Colorado_River_Management/AZ_CO_files/Lake_Powell_surf_elevation.pdf. Retrieved 2009-05-15.
- ^ Takeuchi, Kuniyoshi. "Sustainable reservoir development and management." International Association of Hydrological Sciences, 1998
External links
- Controlled Flooding of the Colorado River in Grand Canyon from Glen Canyon Dam
- Hydrology analysis of the Colorado River floods of 1983
Categories:- Dam controversies
- 1983 floods
- 1984 floods


Wikimedia Foundation. 2010.