- Cluster diagram
-
A Cluster diagram or clustering diagram is a general type of diagram, which represents some kind of cluster. A cluster in general is a group or bunch of several discrete items that are close to each other. [1]
The cluster diagram figures a cluster, such as a network diagram figures a network, a flow diagram a process or movement of objects, and a tree diagram an abstract tree. But all these diagrams can be considered interconnected: A network diagram can be seen as a special orderly arranged kind of cluster diagram. A cluster diagram is a mesh kind of network diagram. A flow diagram can be seen as a line type of network diagram, and a tree diagram a tree type of network diagram.
Contents
Types of cluster diagrams
Specific types of cluster diagrams are:
-
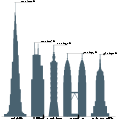
Comparison diagram of sky scraper
-
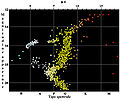
Astronomic cluster diagram of the Messier 3 globular cluster
-

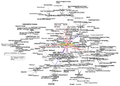
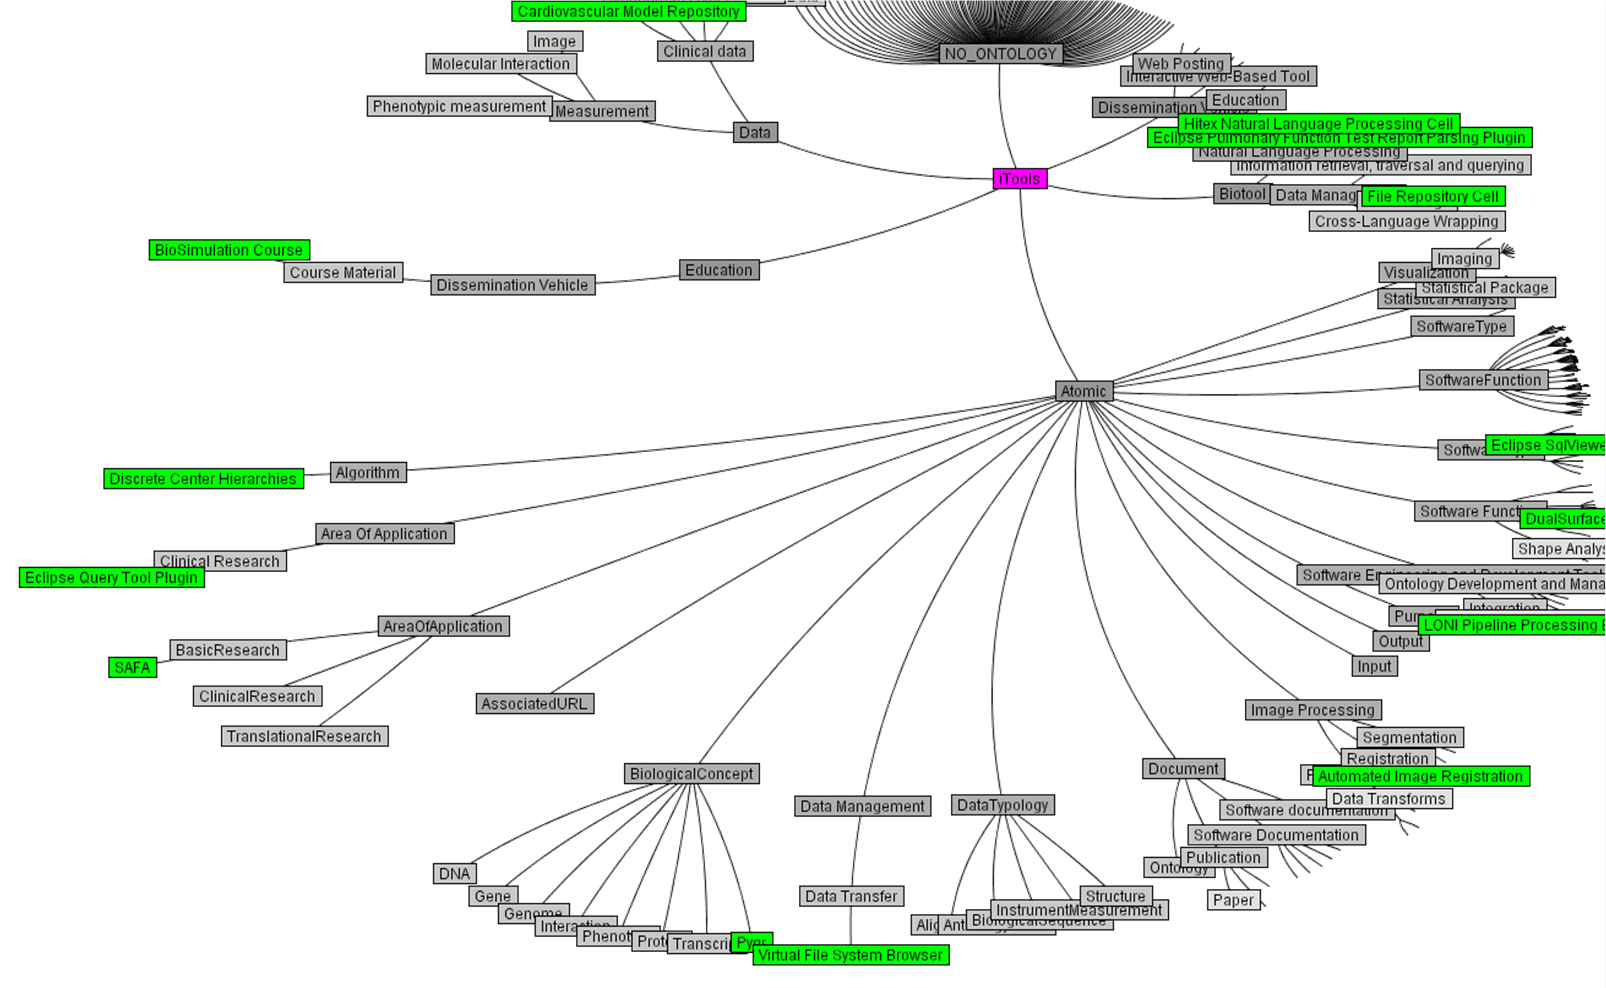
Biositemap diagram
-
Cluster chart in brainstorming
- In architecture a comparison diagram is sometimes called a cluster diagram.[2]
- In astronomy diagrams of star cluster, galaxy groups and clusters or globular cluster.
- In brainstorming a cluster diagrams is also called cloud diagram. They can be considered "are a type of non-linear graphic organizer that can help to systematize the generation of ideas based upon a central topic. Using this type of diagram... can more easily brainstorm a theme, associate about an idea, or explore a new subject".[3] Also, the term cluster diagrams is sometimes used as synonym of mind maps".[4]
-
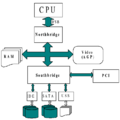
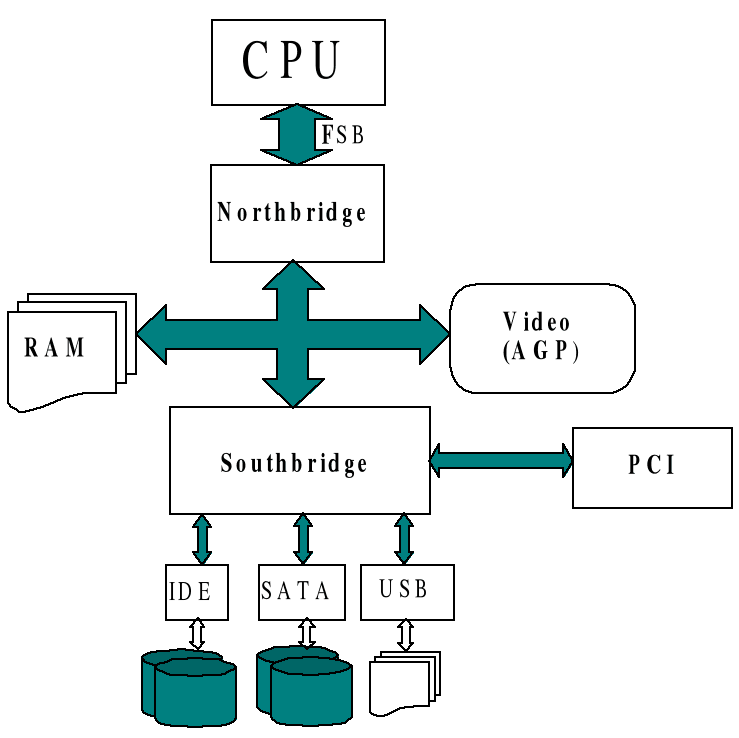
Computer architecture diagram of a PC
-
Internet diagram
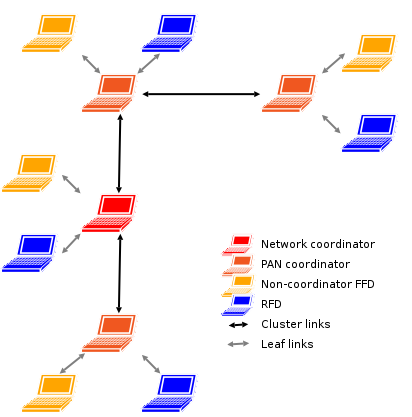
- In computer science more complex diagrams of computer networks, computer architecture, file systems and internet can be considered cluster diagrams.
- In information visualization specific visual representation of large-scale collections of non-numerical information are sometimes drawn in the shape of a cluster diagram.
- In quantum field theory for example, according to Crawford (1998), the called coupled cluster diagram is a "simple diagrammatic formalism popularized by Kucharski and Bartlett [in 1986] by which one may construct the coupled cluster energy and amplitude equations far more quickly than by direct application of Wick's theorem".[5]
-
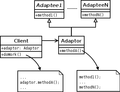
UML Class diagram
- In the Unified Modeling Language (UML) all structure diagrams can be considered cluster diagrams. These structure diagrams emphasize what things must be in the system being modeled. UML encounters here the Class diagram, Component diagram, Composite structure diagram, Deployment diagram, Object diagram, and the Package diagram.
References
- ^ Lemma cluster at Wiktionary. Retrieved Sept 18, 2008.
- ^ Illustration called City of London Skyscraper Cluster Diagram at skyscrapernews.com. Retrieved 18 september 2008. Comment: This illustration depicts a "comparison diagram", but yet is called a "cluster diagram".
- ^ Cluster/Cloud Diagrams at enchantedlearning.com. 2003-2009. Accessed Nov 17, 2009.
- ^ Cluster diagrams are another way to mind map by starting with the keywords first. at www.brainstorming-that-works.com. Retrieved 18 september 2008.
- ^ T. Daniel Crawford (1998). "An Introduction to Coupled Cluster Diagrams". In: Reviews in computational chemistry. Kenny B. Lipkowitz, Donald B. Boyd eds. (2000) Vol 14. p.77. (Retrieved 18 september 2008).
Further reading
- Lee E. Brasseur (2003). Visualizing technical information: a cultural critique. Amityville, N.Y: Baywood Pub. ISBN 0-89503-240-6.
- M. Dale and J. Moon (1988). "Statistical tests on two characteristics of the shapes of cluster diagrams". in: Journal of Classification, 1988, vol. 5, issue 1, pages 21–38.
- Robert E. Horn (1999). Visual Language: Global Communication for the 21st Century. MacroVU Press.
External links
- Cluster diagram at cap.nsw.edu.au
- City of London Skyscraper Cluster Diagram
Categories:- Diagrams
-


Wikimedia Foundation. 2010.