- Economy of Indonesia
-
Economy of Indonesia 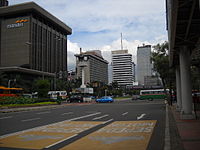
Jakarta's central business district at Thamrin Street, Central Jakarta.Rank 15th Currency Rupiah (IDR) Fiscal year Calendar year Trade organizations WTO, G-20, IOR-ARC Statistics GDP $1.0 trillion by PPP (2010) GDP growth 6.1% (2010 est.) GDP per capita $4,200 (2010 est.) GDP by sector agriculture: 15.3%, industry: 47%, services: 37.6% (2010 est.) Inflation (CPI) 5.1% (2010) Population
below poverty line13.3% (2010) Gini index 34.3 (2008)[1] Labour force 116.5 million (2010 est.) Labour force
by occupationagriculture: 38.3%, industry: 12.8%, services: 48.9% (2010 est.) Unemployment 7.1% (2010 est.) Main industries petroleum and natural gas, textiles, apparel, footwear, mining, cement, chemical fertilizers, plywood, rubber, food, tourism Ease of Doing Business Rank 129th[2] External Exports $158.1 billion (2010 est.)[3] Export goods oil and gas, electrical appliances, plywood, textiles, rubber Main export partners Japan 16.3%, China 9.9%, US 9.1%, Singapore 8.7%, South Korea 8%, India 6.3%, Malaysia 5.9% (2010) Imports $127.4 billion (2010 est.) Import goods machinery and equipment, chemicals, fuels, foodstuffs Main import partners China 15.1%, Singapore 14.9%, Japan 12.5%, US 6.9%, Malaysia 6.4%, South Korea 5.7%, Thailand 5.5% (2010)[3] Gross external debt $223 billion (30 June 2011 est.) Public finances Public debt 25.7% of GDP (2010 est.) Revenues $119.5 billion (2011 est.) Expenses $132.9 billion (2011 est.) Credit rating Standard & Poor's:[4]
BB+ (Domestic)
BB+ (Foreign)
BBB- (T&C Assessment)
Outlook: Positive[5]
Moody's:[5]
Ba1
Outlook: Stable
Fitch:[5]
BB+
Outlook: PositiveForeign reserves $105.709 billion (March 2011)[6] Main data source: CIA World Fact Book
All values, unless otherwise stated, are in US dollarsIndonesia is the largest economy in Southeast Asia and is one of the emerging market economies of the world. The country is also a member of G-20 major economies.[7] It has a market economy in which the government plays a significant role by owning more than 164 enterprises and administers prices on several basic goods, including fuel, rice, and electricity. In the aftermath of the financial and economic crisis that began in mid-1997, the government took custody of a significant portion of private sector assets through acquisition of nonperforming bank loans and corporate assets through the debt restructuring process. Since 2004, the national economy has recovered and undergone another period of rapid economic growth. Indonesia is quite a humid and tropical country with many tourist attractions. [8]
History
In the 1960s, the economy deteriorated drastically as a result of political instability, a young and inexperienced government, and economic nationalism, which resulted in severe poverty and hunger. By the time of Soekarno's downfall in the mid-1960s, the economy was in chaos with 1,000% annual inflation, shrinking export revenues, crumbling infrastructure, factories operating at minimal capacity, and negligible investment. Following President Soekarno's downfall in the mid-1960s, the New Order administration brought a degree of discipline to economic policy that quickly brought inflation down, stabilized the currency, rescheduled foreign debt, and attracted foreign aid and investment. (See Berkeley Mafia). Indonesia was until recently Southeast Asia's only member of OPEC, and the 1970s oil price raises provided an export revenue windfall that contributed to sustained high economic growth rates, averaging over 7% from 1968 to 1981.[9] High levels of regulation and a dependence on declining oil prices, growth slowed to an average of 4.3% per annum between 1981 and 1988. A range of economic reforms were introduced in the late 1980s including a managed devaluation of the rupiah to improve export competitiveness, and de-regulation of the financial sector,[10] Foreign investment flowed into Indonesia, particularly into the rapidly developing export-oriented manufacturing sector, and from 1989 to 1997, the Indonesian economy grew by an average of over 7%.[11][12]
GDP per capita grew 545% from 1970 to 1980 as a result of the sudden increase in oil export revenues from 1973 to 1979.[13]
High levels of economic growth from 1987–1997 masked a number of structural weaknesses in Indonesia's economy. Growth came at a high cost in terms of weak and corrupt institutions, severe public indebtedness through mismanagement of the financial sector, the rapid depletion of Indonesia’s natural resources, and a culture of favors and corruption in the business elite.[14] Corruption particularly gained momentum in the 1990s, reaching to the highest levels of the political hierarchy as Suharto became the most corrupt leader according to Transparency International's corrupt leaders list.[15][16] As a result, the legal system was very weak, and there was no effective way to enforce contracts, collect debts, or sue for bankruptcy. Banking practices were very unsophisticated, with collateral-based lending the norm and widespread violation of prudential regulations, including limits on connected lending. Non-tariff barriers, rent-seeking by state-owned enterprises, domestic subsidies, barriers to domestic trade and export restrictions all created economic distortions.
Asian Financial Crisis
The Asian Financial Crisis that began to affect Indonesia in mid-1997 became an economic and political crisis. Indonesia's initial response was to float the rupiah, raise key domestic interest rates, and tighten fiscal policy. In October 1997, Indonesia and the International Monetary Fund (IMF) reached agreement on an economic reform program aimed at macroeconomic stabilization and elimination of some of the country's most damaging economic policies, such as the National Car Program and the clove monopoly, both involving family members of President Soeharto. The rupiah remained weak, however, and President Soeharto was forced to resign in May 1998. In August 1998, Indonesia and the IMF agreed on an Extended Fund Facility (EFF) under President B.J Habibie that included significant structural reform targets. President Abdurrahman Wahid took office in October 1999, and Indonesia and the IMF signed another EFF in January 2000. The new program also has a range of economic, structural reform and governance targets.
The effects of the financial and economic crisis were severe. By November 1997, rapid currency depreciation had seen public debt reach US$60 bn, imposing severe strains on the government's budget.[17] In 1998, real GDP contracted by 13.7%. The economy reached its low point in mid-1999 and real GDP growth for the year was 0.3%. Inflation reached 77% in 1998 but slowed to 2% in 1999.
The rupiah, which had been in the Rp 2,600/USD1 range at the start of August 1997 fell to 11,000/USD1 by January 1998, with spot rates around 15,000 for brief periods during the first half of 1998.[18] It returned to 8,000/USD1 range at the end of 1998 and has generally traded in the Rp 8,000–10,000/USD1 range ever since, with fluctuations that are relatively predictable and gradual.
Post Suharto
In late 2005 Indonesia faced a 'mini-crisis' due to international oil prices rises and imports. The currency reached Rp 12,000/USD1 before stabilizing. The government was forced to cut its massive fuel subsidies, which were planned to cost $14 billion for 2005, in October.[19] This led to a more than doubling in the price of consumer fuels, resulting in double-digit inflation. The situation had stabilized, but the economy continued to struggle with inflation at 17% in 2005.
For 2006, Indonesia's economic outlook was more positive. Economic growth accelerated to 5.1% in 2004 and reached 5.6% in 2005. Real per capita income has reached fiscal year 1996/1997 levels. Growth was driven primarily by domestic consumption, which accounts for roughly three-fourths of Indonesia's gross domestic product. The Jakarta Stock Exchange was the best performing market in Asia in 2004 up by 42%. Problems that continue to put a drag on growth include low foreign investment levels, bureaucratic red tape, and very widespread corruption which causes 51.43 trillion Rupiah or 5.6573 billion US Dollar or approximately 1.4% of GDP to be lost on a yearly basis.[20] However, there is very strong optimism with the conclusion of peaceful elections during the year 2004 and the election of the reformist president Susilo Bambang Yudhoyono.
The unemployment rate in February 2007 was 9.75%.[21] Despite a slowing global economy, Indonesia’s economic growth accelerated to a ten-year high of 6.3 percent in 2007. This growth rate was sufficient to reduce poverty from 17.8 to 16.6 percent based on the Government’s poverty line and reversed the recent trend towards jobless growth, with unemployment falling to 8.46 percent in February 2008.[22][23] Unlike many of its more export-dependent neighbors, it has managed to skirt the recession, helped by strong domestic demand (which makes up about two-thirds of the economy) and a government fiscal stimulus package of about 1.4 percent of GDP, announced earlier this year. After India and China, Indonesia is currently the third fastest growing economy in the Group of Twenty (G20) industrialized and developing economies. The $512 billion economy expanded 4.4 percent in the first quarter from a year earlier and last month, the IMF revised its 2009 forecast for the country to 3-4 percent from 2.5 percent. Indonesia enjoyed stronger fundamentals with the authorities implemented wide-ranging economic and financial reforms, including a rapid reduction in public and external debt, strengthening of corporate and banking sector balance sheets and reducing bank vulnerabilities through higher capitalization and better supervision.[24]
Investment
Since the late 1980s, Indonesia has made significant changes to its regulatory framework to encourage economic growth. This growth was financed largely from private investment, both foreign and domestic. U.S. investors dominated the oil and gas sector and undertook some of Indonesia's largest mining projects. In addition, the presence of US banks, manufacturers, and service providers expanded, especially after the industrial and financial sector reforms of the 1980s. Other major foreign investors included India, Japan, the United Kingdom, Singapore, the Netherlands, Qatar, Hong Kong, Taiwan and South Korea.
The economic crisis made continued private financing imperative but problematic. New foreign investment approvals fell by almost two-thirds between 1997 and 1999. The crisis further highlighted areas where additional reform was needed. Frequently cited areas for improving the investment climate were establishment of a functioning legal and judicial system, adherence to competitive processes, and adoption of internationally acceptable accounting and disclosure standards. Despite improvements in the laws in recent years, Indonesia's intellectual property rights regime remains weak; lack of effective enforcement is a major concern. Under Suharto, Indonesia had moved toward private provision of public infrastructure, including electric power, toll roads, and telecommunications. The financial crisis brought to light serious weaknesses in the process of dispute resolution, however, particularly in the area of private infrastructure projects. Although Indonesia continued to have the advantages of a large labor force, abundant natural resources and modern infrastructure, private investment in new projects largely ceased during the crisis.
As of 28 June 2010, the Indonesia Stock Exchange had 341 listed companies with a combined market capitalization of $269.9 billion.[25] As at November 2010, two thirds of the market capitalization was in the form of foreign funds and only around one percent of the Indonesian population have stock investments.[26] Efforts are further being made to improve the business and investment environment. Within the World Bank's Doing Business Survey,[27] Indonesia rose to 122 out of 178 countries in 2010, from 129 in the previous year. Despite these efforts, the rank is still below regional peers and an unfavourable investment climate persists. For example, potential foreign investors and their executive staff cannot maintain own bank accounts in Indonesia, unless they are tax-paying local residents (paying tax in Indonesia for their worldwide income)[citation needed].
From 1990 to 2010, Indonesian companies have been involved in 3,757 mergers and acquisitions as either acquiror or target with a total known value of $137bn.[28] In 2010, 609 transactions have been announced which is a new record. Numbers had increased by 19% compared to 2009. The value of deals in 2010 was 17 bil. USD which is the second highest number ever.
Economic relations with the United States
U.S. exports to Indonesia in 1999 totaled $2.0 billion, down significantly from $4.5 billion in 1997. The main exports were construction equipment, machinery, aviation parts, chemicals, and agricultural products. U.S. imports from Indonesia in 1999 totaled $9.5 billion and consisted primarily of clothing, machinery and transportation equipment, petroleum, natural rubber, and footwear. Economic assistance to Indonesia is coordinated through the Consultative Group on Indonesia (CGI), formed in 1989. It includes 19 donor countries and 13 international organizations that meet annually to coordinate donor assistance.
 Indonesian exports in 2006
The U.S. Agency for International Development (USAID) has provided development assistance to Indonesia since 1950. Initial assistance focused on the most urgent needs of the new republic, including food aid, infrastructure rehabilitation, health care, and training. Through the 1970s, a time of great economic growth in Indonesia, USAID played a major role in helping the country achieve self-sufficiency in rice production and in reducing the birth rate.
USAID's current program aims to support Indonesia as it recovers from the financial crisis by providing food aid, employment generating activities, and maintaining critical public health services. USAID is also providing technical advisers to help the Indonesian Government implement economic reforms and fiscal decentralization and is supporting democratization and civil society development activities through non-governmental organizations.
Macro-economic trend
This is a chart of trend of gross domestic product of Indonesia at market prices[29] by the IMF with figures in millions of rupiah.
Year GDP USD exchange
(rupiah)Inflation index
(2007=100)Nominal Per Capita GDP
(as % of USA)PPP Per Capita GDP
(as % of USA)1980 60,143.191 626.98 10 5.25 5.93 1985 112,969.792 1,110.58 11 3.47 5.98 1990 233,013.290 1,842.80 16 3.01 6.63 1995 502,249.558 2,248.60 24 4.11 8.14 2000 1,389,769.700 8,396.33 53 2.32 6.92 2005 2,678,664.096 9,705.16 83 3.10 7.51 2010 6,422,918.230 8,555.00 121 6.38 9.05 For purchasing power parity comparisons, the US dollar is exchanged at 3,094.57 rupiah only.
Mean wages were $2.32 per manhour in 2009.
Structure of the economy
Agriculture, livestock, forestry and fishery
Statistics Indonesia provisionally valued food crop yields at 213,529,700 million rupiahs in 2006 thus registering over 35% growth since 2003.[30] Badan Pusat Statistik provisionally valued estate crop yields at 62,690,900 million rupiahs in 2006 thus registering over 34% growth since 2003.[30] Badan Pusat Statistik provisionally valued livestock and its derivative products at 51,276,400 million rupiahs in 2006 thus registering over 37% growth since 2003.[30] Badan Pusat Statistik provisionally valued forestry at 30,017,000 million rupiahs in 2006 thus registering over 63% growth since 2003.[30] Badan Pusat Statistik provisionally valued fishery at 72,979,900 million rupiahs in 2006 thus registering over 60% growth since 2003.[31]
Hydrocarbons
Badan Pusat Statistik provisionally valued the oil and gas mining industry at 187,893,200 million rupiahs in 2006 thus registering over 97% growth since 2003.[31]
Indonesia was the only Asian member of the Organization of Petroleum Exporting Countries (OPEC) outside of the Middle East until 2008 and is currently a net oil importer. In 1999, Crude and condensate output averaged 1.5 million barrels (240,000 m3) per day, and in the 1998 calendar year the oil and gas sector, including refining, contributed approximately 9% to GDP. As of 2005, Indonesian crude oil and condensate output was 1.07 million barrels (170,000 m3) per day. This is a substantial decline from the 1990s, due primarily to aging oil fields and a lack of investment in oil production equipment. This decline in production has been accompanied by a substantial increase in domestic consumption, about 5.4% per year, leading to an estimated US$1.2 billion cost for importing oil in 2005.
The state owns all petroleum and mineral rights. Foreign firms participate through production-sharing and work contracts. Oil and gas contractors are required to finance all exploration, production, and development costs in their contract areas; they are entitled to recover operating, exploration, and development costs out of the oil and gas produced.
Indonesia's fuel production has declined significantly over the years, owing to aging oil fields and lack of investment in new equipment. As a result, despite being an exporter of crude oil, Indonesia is now a net importer of oil products. It had previously subsidized fuel prices to keep prices low, costing US$ 7 billion in 2004 .[32] The current president has mandated a significant reduction of government subsidy of fuel prices in several stages .[33] The government has stated the cuts in subsidies are aimed at reducing the budget deficit to 1% of gross domestic product (GDP) this year, down from around 1.6% last year. At the same time, in order to alleviate economic hardships, the government has offered one-time subsidies to qualified citizens.
 Ore trucks in the mining area in West Sumbawa, NTB.
Non-oil and gas mining
Badan Pusat Statistik provisionally valued the non-oil and gas mining industry at 130,861,000 million rupiahs in 2006 thus registering over 145% growth since 2003.[31]
Indonesia is the world's largest tin market. Although mineral production traditionally centered on bauxite, silver, and tin, Indonesia is expanding its copper, nickel, gold, and coal output for export markets.
In mid-1993, the Department of Mines and Energy reopened the coal sector to foreign investment, with the result that the leading Indonesian coal producer now is a joint venture between UK firms - BP and Rio Tinto. Total coal production reached 74 million metric tons in 1999, including exports of 55 million tons. From January to August 2011, the coal production was 235 million tons and targeted 2011 coal production between 340 to 370 million tons. Not all of the productions can be exported due to there are Domestic Market Obligation (DMO) regulation which should fullfil the domestic market. In 2012, the DMO is 24.72 percent. And starting 2014, there are no low-grade coal exports allowed, so the upgraded brown coal process which crank up the calorie value of coal from 4,500 kcal/kg to 6,100 kcal/kg will be built in South Kalimantan and South Sumatra.[34]
Two US firms operate three copper/gold mines in Indonesia, with a Canadian and British firm holding significant other investments in nickel and gold, respectively. In 1998, the value of Indonesian gold production was $1 billion and copper, $843 million. Receipts from gold, copper, and coal comprised 84% of the $3 billion. Earned in 1998 by the mineral mining sector. India fortune groups like Vedanta Resources and Tata Group have significant mining operations in Indonesia.
April 2011: With additional of Tayan, West Kalimantan Alumina project which produce 5 percent of the world's alumina production, Indonesia will be the world's second largest Alumina producer. The project will not make the ores to become Aluminium due to there are 100 types of Alumina derivatives which can be developed further by other companies in Indonesia.[35]
Quarrying
Badan Pusat Statistik provisionally valued the quarrying industry at 35,872,700 million rupiahs in 2006 thus registering over 87% growth since 2003.[31]
Manufacturing
Oil and gas manufacturing
Badan Pusat Statistik provisionally valued the petroleum refinery industry at 119,833,900 million rupiahs in 2006 thus registering over 139% growth since 2003[31] while the liquefied natural gas industry was valued at 53,791,300 million rupiahs in 2006 thus registering over 94% growth since 2003.
Non-oil and gas manufacturing
Badan Pusat Statistik provisionally valued the food, beverage and tobacco industry at 213,173,300 million rupiahs in 2006 thus registering over 38% growth since 2003.[31]
Textile, leather products and footwear industry was valued at 90,871,700 million rupiahs in 2006 thus registering over 34% growth since 2003.
Wood and wood products industry was valued at 44,410,400 million rupiahs in 2006 thus registering over 48% growth since 2003.
Paper and printing products industry was valued at 39,968,900 million rupiahs in 2006 thus registering over 43% growth since 2003.
Fertilizers, chemicals and rubber products industry was valued at 95,765,000 million rupiahs in 2006 thus registering over 68% growth since 2003.
Cement and non-metallic quarry products industry was valued at 29,015,100 million rupiahs in 2006 thus registering over 50% growth since 2003.
Iron, steel and other basic metals industry was valued at 20,492,200 million rupiahs in 2006 thus registering over 52% growth since 2003.
Transport equipment, machinery and apparatus industry was valued at 221,891,800 million rupiahs in 2006 thus registering over 87% growth since 2003.
Other manufacturing industries were valued at 7,148,300 million rupiahs in 2006 thus registering over 67% growth since 2003.
April 2011, after more than 40 years Toyota has developed into a strong production base for the domestic and export markets. In the next two years the car market is expected to reach one million unit a year which Toyota and also its subsidiary company Daihatsu get a market share about 40 percent.[36]
In 2010, Indonesia sales 7.6 million motorcycles, which mainly produce in Indonesia with almost 100 percent local components. Honda led the market with a 50.95 percent market share, followed by Yamaha with 41.37 percent market share.[37]
Electricity, gas and water supply
Electricity
See also: Geothermal power in Indonesia and Nuclear power in IndonesiaBadan Pusat Statistik provisionally valued the electricity industry at 21,247,200 million rupiahs in 2006 thus registering over 51% growth since 2003.[31] The vast majority of production is with conventional fossil units, but hydroelectric and other renewables make a contribution. Total electric production in 2005 was 100 TWh.
Indonesia has expressed interest recently in possible use of nuclear plants.
City gas
Badan Pusat Statistik provisionally valued the city gas industry at 5,036,100 million rupiahs in 2006 thus registering over 119% growth since 2003.[31]
Water supply
Badan Pusat Statistik provisionally valued the water supply industry at 4,115,200 million rupiahs in 2006 thus registering over 43% growth since 2003.[31]
Construction
Badan Pusat Statistik provisionally valued the construction industry at 249,127,800 million rupiahs in 2006 thus registering over 98% growth since 2003.[31]
Trade, hotel and restaurant
Wholesale and retail trade

Badan Pusat Statistik provisionally valued the wholesale and retail trades at 386,872,500 million rupiahs in 2006 thus registering over 48% growth since 2003.[31]
Hotels
Badan Pusat Statistik provisionally valued the hotel industry at 17,248,800 million rupiahs in 2006 thus registering over 52% growth since 2003.[31]
Restaurants
Badan Pusat Statistik provisionally valued the restaurant industry at 92,214,900 million rupiahs in 2006 thus registering over 45% growth since 2003.[31]
Transportation and communication
Transportation
Badan Pusat Statistik provisionally valued railway transport at 1,345,000 million rupiahs in 2006 thus registering over 16% growth since 2003.[31]
Road transport was valued at 81,449,500 million rupiahs in 2006 thus registering over 106% growth since 2003.
Sea transport was valued at 16,120,700 million rupiahs in 2006 thus registering over 34% growth since 2003.
River, lake and ferry transport was valued at 4,510,700 million rupiahs in 2006 thus registering over 53% growth since 2003.
Air transport was valued at 14,685,200 million rupiahs in 2006 thus registering over 96% growth since 2003.
Other services allied to transport industry were valued at 24,868,900 million rupiahs in 2006 thus registering over 49% growth since 2003.
Communication
Badan Pusat Statistik provisionally valued the communication industry at 87,941,600 million rupiahs in 2006 thus registering over 123% growth since 2003.[31]
Finance, real estate and business services
Debt Sevice Ratio
At end of June 2011, Indonesia's debt service ratio was 21.6 percent, well below the dangerous threshold of 30 percent.[38]
Banking
Badan Pusat Statistik provisionally valued the banking industry at 97,708,300 million rupiahs in 2006 thus registering over 31% growth since 2003.[31]
Non-bank finance institutions
Badan Pusat Statistik provisionally valued the non-bank finance industry at 26,682,500 million rupiahs in 2006 thus registering over 87% growth since 2003.[31]
Services allied to finance
Badan Pusat Statistik provisionally valued other services allied to finance industry at 2,006,300 million rupiahs in 2006thus registering over 82% growth since 2003.[31]
Real estate
Badan Pusat Statistik provisionally valued the real estate industry at 97,764,400 million rupiahs in 2006 thus registering over 72% growth since 2003.[31]
Business services
Badan Pusat Statistik provisionally valued other business support services at 47,381,600 million rupiahs in 2006 thus registering over 71% growth since 2003.[31]
Small businesses
There are 50 million small businesses in Indonesia with online usage growth of 48 percent in 2010, so Google will open a local office in Indonesia before 2012.[39]
Other services
General government
Badan Pusat Statistik provisionally valued government administration and defence services at 103,508,800 million rupiahs in 2006 thus registering over 63% growth since 2003.[31]
Other government services were valued at 64,290,900 million rupiahs in 2006 thus registering over 67% growth since 2003.
Private
Badan Pusat Statistik provisionally valued the social and community services at 60,319,400 million rupiahs in 2006 thus registering over 92% growth since 2003.[31]
Amusement and recreational services were valued at 10,018,800 million rupiahs in 2006 thus registering over 46% growth since 2003.
Personal and household services were valued at 100,247,900 million rupiahs in 2006 thus registering over 69% growth since 2003.
Indonesian migrant workers
The most common destination of Indonesian migrant workers is Malaysia (including the illegal workers). In 2010, according to World Bank report, Indonesia is among the world's top ten remittance receiving countries with value of totalling $7 billion.[40]
May 2011: There are 6 million Indonesian citizens working overseas, 2.2 million of whom reside in Malaysia and another 1.5 million in Saudi Arabia.[41]
Public expenditure
Since the Asian financial crisis in the late 1990s, which brought down the Suharto regime in its wake in May 1998, Indonesia’s public finances have undergone a major transformation. The financial crisis itself caused a huge economic contraction and a commensurate decline in public spending. Not surprisingly, debt and subsidies increased dramatically, while development spending was sharply curtailed.
Now, one decade later, Indonesia has moved out of crisis and into a situation in which the country once again has sufficient financial resources to address its development needs. This change has come about as a result of prudent macroeconomic policies, the most important of which has been very low budget deficits. Also, the way in which the government spends money has been transformed by the 2001 ‘big bang’ decentralization, which has resulted in over one-third of all government spending being transferred to sub-national governments by 2006. Equally important, in 2005, spiraling international oil prices caused Indonesia’s domestic fuel subsidies to run out of control, threatening the country’s hard won macroeconomic stability. Despite the political risks of major price hikes in fuel driving more general inflation, the government took the brave decision to slash fuel subsidies.
 The headquarter of Bank Indonesia in Jakarta.
This decision freed up an extra US$10 billion for government spending on development programs.[42] Meanwhile, by 2006 an additional US$5 billion had become available thanks to a combination of increased revenues boosted by steady growth of the overall economy, and declining debt service payments, a hangover from the economic crisis.[42] This meant that in 2006 the government had an extra US$15 billion to spend on development programs.[42] The country has not seen “fiscal space” of such magnitude since the revenue windfall experienced during the oil boom of the mid-1970s. However, an important difference is that the 1970s oil revenue windfall was just that: a lucky and unforeseen financial boon. In contrast, the current fiscal space has been achieved as a direct result of sound and carefully thought through government policy decisions.
However, while Indonesia has made tremendous progress in freeing up financial resources for its development needs, and this situation is set to continue in the newt few years, subsidies continue to place a heavy burden on the government’s budget. The 2005 reductions on subsidies notwithstanding, total subsidies still accounted for some US$10 billion in government spending in 2006, or a significant 15 percent of the total budget.[42]
Thanks to the decision of the Habibie government (May 1998 to August 2001) to decentralize power across the country in 2001, increasingly high shares of government spending are being channeled through sub-national governments. As a result, provincial and district governments in Indonesia now spend 37 percent of total public funds, which represents a level of fiscal decentralization that is even higher than the OECD average.
Given the level of decentralization that has occurred in Indonesia and the fiscal space now available, the Indonesian government has a unique opportunity to revamp the country’s neglected public services. If carefully managed, this could allow the lagging regions of eastern Indonesian to catch up with other more affluent areas of the country in terms of social indicators. It could also enable Indonesian to focus on the next generation of reforms, namely improving quality of public services and targeted infrastructure provision. In effect, the correct allocation of public funds and the careful management of those funds once they have been allocated have become the main issues for public spending in Indonesia going forward.
For example, while education spending has now reached 17.2 percent of total public spending ─ the highest share of any sector and a share of 3.9 percent of GDP in 2006, compared with only 2.0 percent of GDP in 2001 ─ in contrast total public health spending remains below 1.0 percent of GDP.[42] Meanwhile, public infrastructure investment has still not fully recovered from its post-crisis lows and remains at only 3.4 percent of GDP.[42] One other area of concern is that the current level of expenditure on administration is excessively high. Standing at 15 percent in 2006, this suggests a significant waste of public resources.[42][43]
Economic challenges
 Jakarta has long been a destination for rural poor, many of whom end up living in slums.
Between 1945 and 1960s, Indonesia had been an excessively poor country. It was only until changes in government in 1965 that triggered off essential progress in lowering the country’s poverty rate. From a steep recession in 1965 with an 8% decline in GDP, the country began to develop economically in the 1970s, earning much benefit from the oil shock. This development continued throughout the 1980s and into the 1990s despite the oil counter-shocks. During these periods, GDP level rose at an average rate of 7.1%. Indonesia saw consistent growth, with the official poverty rate falling from 60% to 15%.[44] Despite this development, an estimated 13.33% of the population (2010 estimate) remains below the poverty line.[45]
Inequality
Poverty rate has since been higher in the outer islands. Java, Bali, and Sumatra have benefited more due to the rise of manufacturing and better infrastructure of the inner islands. Economic disparity and the flow of natural resource profits to Jakarta has led to discontent and even contributed to separatist movements in areas such as Aceh and Irian Jaya. Geographically, the poorest fifth regions account for just 8% of consumption, while the richest fifth account for 45%. While there are new laws on decentralization that may address the problem of uneven growth and satisfaction partially, there are many hindrances in putting this new policy into practice.[44]
At the Indonesian Chamber of Commerce and Industry (Kadin) meeting at Makassar on April 2011, Disadvantaged Regions Minister said there are 184 regencies classified as disadvantaged areas in Indonesia with around 120 regencies were located in the eastern part of Indonesia.[46]
Inflation
Inflation has long been another problem in Indonesia. Because of political turmoil, the country had once suffered hyperinflation, with 1000% annual inflation between 1964 and 1967,[47] and this had been enough to create severe poverty and hunger.[48] Even though the economy recovered very quickly during the first decade of New Order administration (1970–1981), never once was the inflation less than 10% annually. The inflation slowed during mid-1980s, however, the economy was also languid due to the decrease of oil price that reduced its export revenue dramatically. The economy was again experiencing rapid growth between 1989-1997 due to the improving export-oriented manufacturing sector, still the inflation rate was higher than economic growth, and this caused widening gap among several Indonesians. The inflation peaked in 1998 during the Asian financial crisis, with over 58%, causing the raise in poverty level as bad as the 1960s crisis.[49] During the economic recovery and growth in recent years, the government has been trying to decline the inflation rate. However, it seems that Indonesian inflation has been affected by the global fluctuation and domestic market competition.[50] As of 2010, the inflation rate was approximately 7%, when its economic growth was 6% (Note that economic growth rates already take inflation into account, so this comparison by no means implies economic reduction[51]). To date, inflation is affecting Indonesian lower middle class, especially those who can't afford food after price hikes.[52][53]
Best performance
Based on the regional administration implementation performance evaluation of 2009, by an order the best performance were:
- 3 Provinces: North Sulawesi, South Sulawesi and Central Java
- 10 Districts: Jombang and Bojonegoro in East Java Province, Sragen and Pacitan in Central Java, Boalemo in Gorontalo, Enrekang in South Sulawesi, Buleleng in Bali, Luwu Utara in South Sulawesi, Karanganyar in Central Java and Kulon Progo in Yogyakarta
- 10 Cities: Surakarta and Semarang in Central Java, Banjar in West Java, Yogyakarta city in Yogyakarta, Cimahi in West Java, Sawahlunto in West Sumatra, Probolinggo and Mojokerto in East java, Sukabumi and Bogor in West Java[54]
Based on JBIC Fiscal Year 2010 survey (22nd Annual Survey Report) found that in 2009, Indonesia has the highest satisfaction level in net sales and profits for the Japanese companies.[55]
High Net Worth Individuals
-According to Asia Wealth Report, Indonesia has the highest growth rate of High Net Worth Individuals (HNWI) predicted among the 10 most Asian economies. By 2015, Indonesia will have up to 99,000 wealthy individuals with total wealth $478 billion. HNWI means individuals with $1 million or more in investable assets excluding their primary residence.[56]
Other data
Agriculture - products: rice, cassava (tapioca), peanuts, rubber, cocoa, coffee, palm oil, copra; poultry, beef, pork, eggs
Exchange rates: Indonesian rupiah (IDR) per US dollar - 9,698.9 (2008), 9,143 (2007), 9,159.3 (2006), 9,704.7 (2005), 8,938.9 (2004)
See also
- CIVETS countries
- G20 developing nations
- Next Eleven
- Taxation in Indonesia
References
- ^ "Global Peace Index 2008 for Indonesia". Global Peace Index. http://www.visionofhumanity.org/gpi/results/indonesia/2008/. Retrieved 2009-03-25.[dead link]
- ^ "Doing Business in Indonesia 2012". World Bank. http://www.doingbusiness.org/data/exploreeconomies/indonesia/. Retrieved 2011-11-21.
- ^ a b "Federation of International Trade Associations : Indonesia profile". Fita.org. http://fita.org/countries/indonesia.html. Retrieved 2011-08-29.
- ^ "Sovereigns rating list". Standard & Poor's. http://www.standardandpoors.com/ratings/sovereigns/ratings-list/en/eu/?subSectorCode=39. Retrieved 26 May 2011.
- ^ a b c Rogers, Simon; Sedghi, Ami (15 April 2011). "How Fitch, Moody's and S&P rate each country's credit rating". The Guardian. http://www.guardian.co.uk/news/datablog/2010/apr/30/credit-ratings-country-fitch-moodys-standard. Retrieved 31 May 2011.
- ^ "International Reserves and Foreign Currency Liquidity - INDONESIA". International Monetary Fund. 4 May 2011. http://www.imf.org/external/np/sta/ir/IRProcessWeb/data/idn/eng/curidn.htm. Retrieved 31 May 2011.
- ^ What is the G-20, www.g20.org. Retrieved 2009-10-6.
- ^ "Acicis – Dspp". Acicis.murdoch.edu.au. http://www.acicis.murdoch.edu.au/hi/dspp1.html. Retrieved 2011-08-29.
- ^ Schwarz (1994), pp. 52–7.
- ^ (Schwarz (1994), pages 52–57)
- ^ Schwarz (1994), pages 52–57.
- ^ "Indonesia: Country Brief". Indonesia: Key Development Data & Statistics. The World Bank. September 2006. http://web.worldbank.org/WBSITE/EXTERNAL/COUNTRIES/EASTASIAPACIFICEXT/INDONESIAEXTN/0,,contentMDK:20095968~pagePK:141137~piPK:141127~theSitePK:226309,00.html.
- ^ "GDP info". Earthtrends.wri.org. http://earthtrends.wri.org/text/economics-business/variable-638.html. Retrieved 2011-08-29.
- ^ "Combating Corruption in Indonesia, World Bank 2003" (PDF). http://siteresources.worldbank.org/INTINDONESIA/Resources/Publication/03-Publication/Combating+Corruption+in+Indonesia-Oct15.pdf. Retrieved 2011-08-29.
- ^ "Transparency International Global Corruption Report 2004". Transparency.org. http://www.transparency.org/publications/gcr/gcr_2004. Retrieved 2011-08-29.
- ^ "Suharto tops corruption rankings". BBC News. 2004-03-25. http://news.bbc.co.uk/2/hi/3567745.stm. Retrieved 2011-08-29.
- ^ Robison, Richard (17 November 2009). "A Slow Metamorphosis to Liberal Markets". Australian Financial Review.
- ^ "Historical Exchange Rates". OANDA. 2011-04-16. http://www.oanda.com/convert/fxhistory. Retrieved 2011-08-29.
- ^ BBC News (2005-08-31). "Indonesia plans to slash fuel aid". BBC, London. http://news.bbc.co.uk/2/hi/business/4200100.stm.
- ^ "The Jakarta Post". The Jakarta Post. 2007. Archived from the original on December 14, 2007. http://web.archive.org/web/20071214184114/http://www.thejakartapost.com/detailgeneral.asp?fileid=20071105212913&irec=37. Retrieved 2007-11-11.
- ^ "Beberapa Indikator Penting Mengenai Indonesia" (in Indonesian) (PDF) (Press release). Indonesian Central Statistics Bureau. 2 December 2008. http://www.bps.go.id/leaflet/leaflet-desember-07-ind.pdf. Retrieved 2008-03-18.[dead link]
- ^ "Indonesia: Economic and Social update" (PDF) (Press release). World Bank. 2008. http://www-wds.worldbank.org/external/default/WDSContentServer/WDSP/IB/2008/06/19/000333037_20080619004758/Rendered/PDF/442730WP0BOX321ate1apr200801PUBLIC1.pdf. Retrieved April 2008.[dead link]
- ^ "Indonesia: BPS-STATISTICS INDONESIA STRATEGIC DATA" (Press release). BPS-Statistic Indonesia. 2009. http://www.bps.go.id/eng/download_file/data_strategis.pdf. Retrieved November 2008.
- ^ "IMF Survey: Indonesia’s Choice of Policy Mix Critical to Ongoing Growth". Imf.org. 2009-07-28. http://www.imf.org/external/pubs/ft/survey/so/2009/car072809b.htm. Retrieved 2011-08-29.
- ^ Bloomberg Terminal
- ^ "Economy risks losing momentum: Experts". The Jakarta Post. 2010-11-26. http://www.thejakartapost.com/news/2010/11/05/economy-risks-losing-momentum-experts.html. Retrieved 2011-08-29.
- ^ "Doing Business Survey, World Bank". Doingbusiness.org. http://www.doingbusiness.org/economyrankings/. Retrieved 2011-08-29.
- ^ "Statistics on Mergers & Acquisitions (M&A)". Imaa-institute.org. http://www.imaa-institute.org/statistics-mergers-acquisitions.html#MergersAcquisitions_Indonesia. Retrieved 2011-08-29.
- ^ "Edit/Review Countries". Imf.org. 2006-09-14. http://www.imf.org/external/pubs/ft/weo/2011/01/weodata/weoselco.aspx?g=2001&sg=All+countries. Retrieved 2011-08-29.
- ^ a b c d Gross Domestics Product[dead link]
- ^ a b c d e f g h i j k l m n o p q r s t u v [1][dead link]
- ^ Mar 10, 2005 (2005-03-10). "Tigers count the cost of easing fuel subsidies". Asia Times Online. http://www.atimes.com/atimes/Southeast_Asia/GC10Ae04.html. Retrieved 2011-08-29.
- ^ "Indonesia plans to slash fuel aid". BBC News. 2005-08-31. http://news.bbc.co.uk/2/hi/business/4200100.stm.
- ^ "Coal production may reach 370 million tons this year". September 23, 2011. http://www.thejakartapost.com/news/2011/09/23/coal-production-may-reach-370-million-tons-year.html.
- ^ "RI aims to be second largest alumina producer". Antara News. 2011-04-12. http://www.antaranews.com/en/news/70198/ri-aims-to-be-second-largest-alumina-producer. Retrieved 2011-08-29.
- ^ "Toyota develops Indonesia into production base". Waspada.co.id. 2011-04-20. http://waspada.co.id/index.php?option=com_content&view=article&id=188876:toyota-develops-indonesia-into-production-base&catid=30:english-news&Itemid=101. Retrieved 2011-08-29.
- ^ "Honda eyes larger share in premium bike market". The Jakarta Post. http://www.thejakartapost.com/news/2011/07/01/honda-eyes-larger-share-premium-bike-market.html. Retrieved 2011-08-29.
- ^ "RI's Foreign Debts Safe". August 18, 2011. http://www.embassyofindonesia.org/news/2011/08/news076.htm.
- ^ "Google to Open Indonesia Office 'Before 2012'". Embassyofindonesia.org. 2011-07-22. http://www.embassyofindonesia.org/news/2011/07/news058.htm. Retrieved 2011-08-29.
- ^ "Indonesia Among the World's Top 10 Remittance Receivers". Embassyofindonesia.org. 2011-05-04. http://www.embassyofindonesia.org/news/2011/05/news015.htm. Retrieved 2011-08-29.
- ^ "After Malaysia, RI seeks similar pact with S. Arabia". The Jakarta Post. 2011-08-19. http://www.thejakartapost.com/news/2011/06/04/after-malaysia-ri-seeks-similar-pact-with-s-arabia.html. Retrieved 2011-08-29.
- ^ a b c d e f g "Spending for Development: Making the Most of Indonesia’s New Opportunities Indonesia Public Expenditure Review 2007" (PDF). http://siteresources.worldbank.org/INTINDONESIA/Resources/Publication/280016-1168483675167/PEReport.pdf. Retrieved 2011-08-29.
- ^ http://www.dlprog.org/ftp/download/Public%20Folder/test%20folder/The%20Politics%20of%20Free%20Public%20Services%20in%20Decentralised%20Indonesia.pdf
- ^ a b "Indonesia Poverty and wealth, Information about Poverty and wealth in Indonesia". Nationsencyclopedia.com. http://www.nationsencyclopedia.com/economies/Asia-and-the-Pacific/Indonesia-POVERTY-AND-WEALTH.html#ixzz1FB50TL4X. Retrieved 2011-08-29.
- ^ "Central Intelligence Agency". Cia.gov. 2009-10-20. https://www.cia.gov/library/publications/the-world-factbook/fields/2046.html. Retrieved 2011-08-29.
- ^ "120 poor regencies are in the east". The Jakarta Post. 2011-07-18. http://www.thejakartapost.com/news/2011/04/04/120-poor-regencies-are-east.html. Retrieved 2011-08-29.
- ^ By the time of Sukarno's downfall in the mid-1960s, the economy was in chaos with 1,000% annual inflation, shrinking export revenues, crumbling infrastructure, factories operating at minimal capacity, and negligible investment. Schwarz (1994), pages 52–57
- ^ "Ir Soekarno The First President of Indonesia". Welcome2indonesia.com. 2010-05-18. http://www.welcome2indonesia.com/index.php?option=com_content&view=article&id=90:ir-soekarno-the-first-president-of-indonesia&catid=70:famous-people&Itemid=87. Retrieved 2011-08-29.
- ^ "Report for Selected Countries and Subjects". Imf.org. 2006-09-14. http://www.imf.org/external/pubs/ft/weo/2010/02/weodata/weorept.aspx?pr.x=46&pr.y=15&sy=1980&ey=2000&scsm=1&ssd=1&sort=country&ds=.&br=1&c=536&s=PCPI%2CPCPIPCH&grp=0&a=. Retrieved 2011-08-29.
- ^ "Indonesia - Financial & Private Sector Development in Indonesia". Web.worldbank.org. 2007-10-18. http://web.worldbank.org/WBSITE/EXTERNAL/COUNTRIES/EASTASIAPACIFICEXT/INDONESIAEXTN/0,,contentMDK:21517996~pagePK:141137~piPK:141127~theSitePK:226309,00.html. Retrieved 2011-08-29.
- ^ "Indonesia GDP - real growth rate - Economy". Indexmundi.com. 2011-07-12. http://www.indexmundi.com/indonesia/gdp_real_growth_rate.html. Retrieved 2011-08-29.
- ^ "Faced With Skyrocketing Food Prices, Indonesian Govt to Speed Up Work on Food Estate". The Jakarta Globe. http://www.thejakartaglobe.com/bisindonesia/faced-with-skyrocketing-food-prices-indonesian-govt-to-speed-up-work-on-food-estate/415712. Retrieved 2011-08-29.
- ^ "Indonesia Inflation Accelerates, Adding Pressure to Raise Rate :: Forex Trading Lebanon". Forextradinglb.com. 2011-02-01. http://www.forextradinglb.com/news.php?go=fullnews&newsid=1383. Retrieved 2011-08-29.
- ^ "Govt names 23 regions with best performance". Waspada.co.id. 2011-04-25. http://waspada.co.id/index.php?option=com_content&view=article&id=189842:govt-names-23-regions-with-best-performance&catid=30:english-news&Itemid=101. Retrieved 2011-08-29.
- ^ http://www.thejakartapost.com/news/2011/06/06/the-power-nature-and-indonesia’s-economy.html
- ^ "Close to 100,000 Super Rich Indonesians By 2015: Report". September 2, 2011. http://www.thejakartaglobe.com/home/close-to-100000-super-rich-indonesians-by-2015-report/462954.
Life in Indonesia Architecture · Art · Communications · Cuisine · Culture · Demographics · Economy · Education · Ethnic groups · Fauna · Flora · Geography · Geology · Government · Health · History · Languages · Law · Literature · Media · Military · Music · People · Politics · Provinces · Religion · Science and technology · Sport · Tourism · Transport
Economy of Asia Sovereign
states- Afghanistan
- Armenia
- Azerbaijan
- Bahrain
- Bangladesh
- Bhutan
- Brunei
- Burma (Myanmar)
- Cambodia
- People's Republic of China
- Cyprus
- East Timor (Timor-Leste)
- Egypt
- Georgia
- India
- Indonesia
- Iran
- Iraq
- Israel
- Japan
- Jordan
- Kazakhstan
- North Korea
- South Korea
- Kuwait
- Kyrgyzstan
- Laos
- Lebanon
- Malaysia
- Maldives
- Mongolia
- Nepal
- Oman
- Pakistan
- Philippines
- Qatar
- Russia
- Saudi Arabia
- Singapore
- Sri Lanka
- Syria
- Tajikistan
- Thailand
- Turkey
- Turkmenistan
- United Arab Emirates
- Uzbekistan
- Vietnam
- Yemen
States with limited
recognition- Abkhazia
- Nagorno-Karabakh
- Northern Cyprus
- Palestine
- Republic of China (Taiwan)
- South Ossetia
Dependencies and
other territoriesAsia-Pacific Economic Cooperation (APEC) Meetings External Links
Categories:- Economy of Indonesia
- Former OPEC member states
- World Trade Organization member economies


Wikimedia Foundation. 2010.