- Na h-Eileanan an Iar (UK Parliament constituency)
-
Not to be confused with Western Isles (Scottish Parliament constituency).
Coordinates: 57°40′16″N 6°57′11″W / 57.671°N 6.953°W
Na h-Eileanan an Iar County constituency for the House of Commons 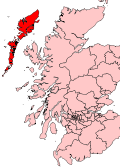
Boundary of Na h-Eileanan an Iar in Scotland.Subdivisions of Scotland Na h-Eileanan Siar Current constituency Created 1918 Member of Parliament Angus MacNeil (SNP) Created from Ross & Cromarty
Inverness-shireOverlaps European Parliament constituency Scotland Na h-Eileanan an Iar (Scottish Gaelic pronunciation: [nə'helanən ə'ɲiəɾ]; formerly Western Isles; English pronunciation: /nə ˈhɪlənən ənˈjɪər/) is a constituency of the House of Commons of the Parliament of the United Kingdom, created in 1918. It elects one Member of Parliament (MP) by the first past the post system of election.
Contents
History
The constituency was formed by merging together areas which were formerly within the Ross and Cromarty constituency and the Inverness-shire constituency.
Na h-Eileanan an Iar is the Scottish Gaelic for the Western Isles, which was the constituency's name prior to the 2005 general election. A similar constituency, with the same name is used by the Scottish Parliament.
Boundaries
The constituency area is that of the Outer Hebrides, known also as Na h-Eileanan Siar, and the constituency has the smallest electorate in the United Kingdom, one-fifth of the size of the largest, the Isle of Wight, with the latter also being an island constituency. However, the Isle of Wight is a substantially smaller parliamentary constituency in geographical terms. It has been suggested that Na h-Eileanan an Iar could be combined with the Orkney and Shetland constituency: the resulting combined electorate would still be well below the average constituency quota. Meanwhile the Scottish Boundary commission in 1980 originally proposed that the seat should be extended to include the Skye and Lochalsh areas, however this was overturned at a public enquiry. Generally, overriding considerations of sheer geographical size, a disparate population and of convenience for the MPs concerned as well as tradition and identity have tended to override the arguments about numerical imbalance. Furthermore, a change in the Boundary Commission's rules in 2000 added rule 3a which forbids Orkney or Shetland being combined with another council area.
Local government areas
When created, the area of the constituency was divided between two local government areas; the counties of Ross and Cromarty and Inverness-shire. The division line was the Lewis-Harris boundary, with Lewis in Ross and Cromarty and Harris in Inverness-shire.
In 1975 the constituency area became also an island council area, known as the Western Isles council area. That same area became one of the 32 unitary council areas of Scotland in 1996. The council area is known also as Na h-Eileanan Siar.
Politics
The seat has been a two-way marginal between the Labour Party and the Scottish National Party for many years. In the 2005 general election and the 2010 general election it was one of only two seats outside Northern Ireland in which the Conservative Party obtained less than 5% of the vote and was pushed into fifth place.
Members of Parliament
Election Member [1][2] Party 1918 Donald Murray Liberal 1922 Sir William Dingwall Mitchell Cotts National Liberal 1923 Alexander Mackenzie Livingstone Liberal 1929 Thomas Ramsay Liberal 1931 National Liberal 1935 Malcolm Macmillan Labour 1970 Donald Stewart SNP 1987 Calum MacDonald Labour 2005 Angus MacNeil SNP Election results
2010s
General Election 2010: : Na h-Eileanan an Iar[3] Party Candidate Votes % ±% SNP Angus MacNeil 6,723 45.7 +0.8 Labour Donald John MacSween 4,838 32.9 -1.6 Independent Murdo Murray 1,412 9.6 N/A Liberal Democrat Jean Davis 1,097 7.5 -0.5 Conservative Sheena Louise Norquay 647 4.4 +0.0 Majority 1,885 12.8 Turnout 14,717 66.1 +0.7 SNP hold Swing +1.2 2000s
General Election 2005: Na h-Eileanan an Iar Party Candidate Votes % ±% SNP Angus MacNeil 6,213 44.9 +8.0 Labour Calum MacDonald 4,772 34.5 −10.5 Liberal Democrat Jean Davis 1,096 7.9 +1.4 Christian Vote George Hargreaves 1,048 7.6 N/A Conservative Andy Maciver 610 4.4 −5.1 Scottish Socialist Joanne Telfer 97 0.7 −1.5 Majority 1,441 10.4 Turnout 13,836 64.1 +4.0 SNP gain from Labour Swing +9.3 General Election 2001: Western Isles Party Candidate Votes % ±% Labour Calum MacDonald 5,924 45.0 −10.6 SNP Alasdair Nicholson 4,850 36.9 +3.5 Conservative Douglas Taylor 1,250 9.5 +2.8 Liberal Democrat John Horne 849 6.5 +3.4 Scottish Socialist Joanne Telfer 286 2.2 N/A Majority 1,074 8.1 Turnout 13,159 60.6 −9.5 Labour hold Swing 1990s
General Election 1997: Western Isles Party Candidate Votes % ±% Labour Calum MacDonald 8,955 55.6 SNP Anne Lorne Gillies 5,379 33.4 Conservative James McGrigor 1,071 6.6 Liberal Democrat Neil Mitchison 495 3.1 Referendum Party Ralph Lionel 206 1.3 N/A Majority 3,576 22.2 Turnout 70.1 Labour hold Swing General Election 1992: Western Isles Party Candidate Votes % ±% Labour Calum MacDonald 7,664 47.8 SNP Frances MacFarlane 5,961 37.2 Conservative Robert Heany 1,362 8.5 Liberal Democrat Neil Mitchison 552 3.4 Independent Andrew Price 491 3.1 Majority 1,703 10.6 Turnout 70.4 Labour hold Swing 1980s
General Election 1987: Western Isles Party Candidate Votes % ±% Labour Calum MacDonald 7,041 42.7 SNP Ian Smith 4,701 28.5 Social Democrat Kenneth MacIver 3,419 20.7 Conservative M. Morrison 1,336 8.1 Majority 2,340 14.2 Turnout 70.2 Labour gain from SNP Swing General Election 1983: Western Isles Party Candidate Votes % ±% SNP Donald Stewart 8,272 54.5 Labour Brian Wilson 4,560 30.1 Conservative M. Morrison 1,460 9.6 Liberal N. MacLeod 876 5.8 Majority 3,712 24.5 Turnout 66.5 SNP hold Swing 1970s
General Election 1979: Western Isles Party Candidate Votes % ±% SNP Donald Stewart 7,941 52.5 Labour A. Matheson 4,878 32.3 Conservative M. Morrison 1,600 10.6 Liberal N. MacLeod 700 4.6 Majority 3,063 20.3 Turnout 67.5 SNP hold Swing General Election October 1974: Western Isles[4] Party Candidate Votes % ±% SNP Donald Stewart 8,758 61.45 Labour M. Doig 3,526 24.74 Conservative N.K. Wilson 1,180 8.28 Liberal N. Macmillan 789 5.54 Majority 5,232 36.71 Turnout 63.41 SNP hold Swing General Election February 1974: Western Isles[5] Party Candidate Votes % ±% SNP Donald Stewart 10,079 67.05 Labour A.W. Wilson 2,879 19.15 Conservative J.J. Mackay 1,042 6.93 United Labour Party (UK) M.K. Macmillan 1,031 6.86 Majority 7,200 47.90 Turnout 66.27 SNP hold Swing General Election 1970: Western Isles[6] Party Candidate Votes % ±% SNP Donald Stewart 6,568 43.12 Labour M.K. Macmillan 5,842 38.35 Conservative R.K. MacLeod 2,812 18.53 Majority 726 4.77 Turnout 23,533 64.73 SNP gain from Labour Swing 1960s
General Election 1966: Western Isles[7] Party Candidate Votes % ±% Labour Malcolm Kenneth Macmillan 8,565 61.03 Conservative Charles A. Cameron 2,832 20.18 Liberal John Francis Matheson Macleod 2,638 18.80 Majority 5,733 40.85 Turnout 61.49 Labour hold Swing General Election 1964: Western Isles[8] Party Candidate Votes % ±% Labour Malcolm Kenneth Macmillan 8,740 55.14 Liberal Donald B. Macleod 4,894 30.88 Unionist Charles A. Cameron 2,217 13.99 Majority 3,846 24.26 Turnout 66.88 Labour hold Swing 1950s
General Election 1959: Western Isles Party Candidate Votes % ±% Labour Malcolm Kenneth Macmillan 8,663 53.61 Liberal National Donald B. Macleod 7,496 46.39 Majority 1,167 7.22 Turnout 64.18 Labour hold Swing General Election 1955: Western Isles Party Candidate Votes % ±% Labour Malcolm Kenneth Macmillan 8,4,87 48.77 Liberal JC Frame 6,315 42.66 Majority 2,172 14.67 Turnout 59.55 Labour hold Swing General Election 1951: Western Isles Party Candidate Votes % ±% Labour Malcolm Kenneth Macmillan 8,039 48.77 Conservative J Mitchell 6,7,09 40.70 Liberal David Murray 916 5.56 SNP C Maclean 820 4.97 Majority 1,330 8.07 Turnout 60.55 Labour hold Swing General Election 1950: Western Isles Party Candidate Votes % ±% Labour Malcolm Kenneth Macmillan 8,387 53.21 Liberal Huntley McDonald Sinclair 6,950 44.09 Scottish Home Rule David Murray 425 2.70 Majority 1,437 9.12 Turnout 55.7 Labour hold Swing 1940s
General Election 1945: Western Isles Party Candidate Votes % ±% Labour Malcolm Macmillan 5,914 45.7 +4.7 Liberal H. McDonald Sinclair 4,277 33.0 Unionist Iain Macleod 2,756 21.3 Majority 1,637 12.7 +2.6 Turnout 12,947 53.3 +6.5 Labour hold Swing 1930s
General Election 1935: Western Isles[9] Party Candidate Votes % ±% Labour Malcolm Macmillan 5,421 41.0 Liberal National Thomas Ramsay 4,076 30.9 -23.9 SNP Alexander MacEwan 3,704 28.1 Majority 1,345 10.1 Turnout 12,947 46.8 +8.0 Labour gain from Liberal National Swing General Election 1931: Western Isles[10] Party Candidate Votes % ±% Liberal National Thomas Ramsay 5,793 54.8 +10.7 Unionist I. M. Moffatt Pender 4,785 45.2 +21.8 Majority 1,008 9.6 -2.0 Turnout 10,578 36.8 -3.7 Liberal National hold Swing 1920s
General Election 1929: Western Isles Party Candidate Votes % ±% Liberal Thomas Ramsay 4,877 44.1 -10.1 Labour J. M. MacDiarmid 3,589 32.5 15.3 Unionist I. M. Moffat-Pender 2,593 23.4 -5.2 Majority 1,288 21.6 -14.0 Turnout 11,059 40.5 +1.4 Liberal hold Swing General Election 1924: Western Isles Party Candidate Votes % ±% Liberal Alexander Livingstone 4,579 54.2 14.6 Unionist W. S. Morrison 2,318 28.6 -8.3 Labour A. G. Burns 1,454 17.2 Majority 2,161 25.6 +22.9 Turnout 8,451 39.1 -1.0 Liberal hold Swing 11.5 General Election 1923: Western Isles Party Candidate Votes % ±% Liberal Alexander Livingstone 3,391 39.6 -6.3 Unionist W. S. Morrison 3,158 36.9 N/A Independent Labour H. McCowan 2,011 23.5 Majority 233 2.7 -5.5 Turnout 6,549 40.1 -14.0 Liberal gain from National Liberal Swing N/A General Election 1922: Western Isles Party Candidate Votes % ±% National Liberal Sir William Dingwall Mitchell Cotts 6,177 54.1 +11.6 Liberal Donald Murray 5,238 45.9 -1.4 Majority 939 8.2 +3.4 Turnout 11,415 54.1 +10.5 National Liberal gain from Liberal Swing 6.5 1910s
General Election 1918: Western Isles[11] Party Candidate Votes % ±% Liberal Dr Donald Murray 3,765 47.3 Coalition Liberal William Dingwall Mitchell Cotts 3,375 42.5 Highland Land League H. MacGowan 809 10.2 Majority 390 4.8 Turnout 7,949 43.6 References
- ^ Leigh Rayment's Historical List of MPs – Constituencies beginning with "W" (part 2)
- ^ Leigh Rayment's Historical List of MPs – Constituencies beginning with "N" (part 1)
- ^ "Election 2010: Na H-Eileanan An Iar (Western Isles)", BBC News
- ^ Kimber's UK General Election results 1974 (Oct)
- ^ Kimber's UK General Election results 1974 (Feb)
- ^ Kimber's UK General Election results 1970
- ^ Kimber's UK General Election results 1966
- ^ Kimber's UK General Election results 1964
- ^ Whitaker's Almanack, 1939
- ^ Whitaker's Almanack, 1934
- ^ Whitaker's Almanack, 1920
Westminster constituencies of Scotland 
Aberdeen North · Aberdeen South · Airdrie & Shotts · Angus · Argyll & Bute · Ayr, Carrick & Cumnock · Banff & Buchan · Berwickshire, Roxburgh & Selkirk · Caithness, Sutherland & Easter Ross · Central Ayrshire · Coatbridge, Chryston & Bellshill · Cumbernauld, Kilsyth & Kirkintilloch East · Dumfries & Galloway · Dumfriesshire, Clydesdale & Tweeddale · Dundee East · Dundee West · Dunfermline & West Fife · East Dunbartonshire · East Kilbride, Strathaven & Lesmahagow · East Lothian · East Renfrewshire · Edinburgh East · Edinburgh North & Leith · Edinburgh South · Edinburgh South West · Edinburgh West · Falkirk · Glasgow Central · Glasgow East · Glasgow North · Glasgow North East · Glasgow North West · Glasgow South · Glasgow South West · Glenrothes · Gordon · Inverclyde · Inverness, Nairn, Badenoch & Strathspey · Kilmarnock & Loudoun · Kirkcaldy & Cowdenbeath · Lanark & Hamilton East · Linlithgow & East Falkirk · Livingston · Midlothian · Moray · Motherwell & Wishaw · Na h-Eileanan an Iar · North Ayrshire & Arran · North East Fife · Ochil & South Perthshire · Orkney & Shetland · Paisley & Renfrewshire North · Paisley & Renfrewshire South · Perth & North Perthshire · Ross, Skye & Lochaber · Rutherglen & Hamilton West · Stirling · West Aberdeenshire & Kincardine · West Dunbartonshire
Categories:- United Kingdom Parliamentary constituencies established in 1918
- Parliamentary constituencies in Scotland (Westminster)
- Politics of the county of Inverness
- Politics of the county of Ross and Cromarty

Wikimedia Foundation. 2010.