- Norwich North (UK Parliament constituency)
-
Norwich North Borough constituency for the House of Commons 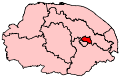
Boundary of Norwich North in Norfolk.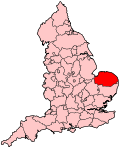
Location of Norfolk within England.County Norfolk Electorate 64,982 (December 2010)[1] Current constituency Created 1950 Member of Parliament Chloe Smith (Conservative) Number of members One Created from Norwich Overlaps European Parliament constituency East of England Norwich North is a parliamentary constituency represented in the House of Commons of the Parliament of the United Kingdom. It elects one Member of Parliament (MP) by the first past the post system of election.
Contents
Boundaries
The constituency includes parts of two local government areas, Norwich and Broadland with the majority of the electorate in Broadland. The Broadland wards of Mile Cross, Sewell, Crome, Thorpe St Andrew, Sprowston, Old Catton, Catton Grove, Hellesdon, Drayton and Taverham fall within its boundaries.
In boundary changes put in place for the United Kingdom general election, 2010, Norwich North lost the wards of Taverham North, Taverham South, Drayton North and Drayton South to the new Broadland constituency.
The constituency includes seven wards of the District of Broadland:- Hellesdon North West, Hellesdon South East, Old Catton and Sprowston West, Sprowston Central, Sprowston East, Thorpe St Andrew North West, Thorpe St Andrew South East; and four wards of the City of Norwich:- Catton Grove, Crome, Mile Cross, Sewell.[2]
History
The constituency was created at the 1950 general election, when the former two-seat constituency of Norwich was divided into two single-member seats, Norwich North and Norwich South.
It has been a Labour Party seat for most of its history, although it was held by the Conservatives for fourteen years, demonstrating its marginality. The Labour member from 1997 to 2009 was Dr Ian Gibson, who resigned as an MP with immediate effect on 5 June 2009 after being implicated in the expenses scandal. A by-election was held to replace him on 23 July 2009,[3] which was won comprehensively by the Conservative Chloe Smith.
Members of Parliament
Election Member [4] Party 1950 John Paton Labour 1964 George Wallace Labour Feb 1974 David Ennals Labour 1983 Patrick Thompson Conservative 1997 Ian Gibson Labour 2009 by-election Chloe Smith Conservative Elections
Elections in the 2010s
General Election 2010: Norwich North[5] Party Candidate Votes % ±% Conservative Chloe Smith 17,280 40.6 +10.1 Labour Co-op John Cook 13,379 31.4 -15.7 Liberal Democrat David Stephen 7,783 18.3 +2.2 UKIP Glenn Tingle 1,878 4.4 +2.1 Green Jess Goldfinch 1,245 2.9 -0.3 BNP Thomas Richardson 747 1.8 N/A Independent Bill Holden 143 0.3 N/A Christian Andrew Holland 118 0.3 N/A Majority 3,901 9.2 Turnout 42,573 65.2 +3.4 Conservative hold Swing 12.9 Elections in the 2000s
Norwich North by-election, 2009 Party Candidate Votes % ±% Conservative Chloe Smith 13,591 39.5 +6.3 Labour Chris Ostrowski 6,243 18.2 -26.7 Liberal Democrat April Pond 4,803 14.0 -2.2 UKIP Glenn Tingle 4,068 11.8 +9.4 Green Rupert Read 3,350 9.7 +7.0 Put an Honest Man into Parliament Craig Murray 953 2.8 N/A BNP Robert West 941 2.7 N/A Independent Bill Holden 166 0.5 -0.2 Monster Raving Loony Alan Hope 144 0.4 N/A NOTA Anne Fryatt 59 0.2 N/A Libertarian Thomas Burridge 36 0.1 N/A Independent Peter Baggs 23 0.1 N/A Majority 7,348 21.3 +9.8 Turnout 34,377 45.9[6] -15.2 Conservative gain from Labour Swing 16.5 General Election 2005: Norwich North Party Candidate Votes % ±% Labour Ian Gibson 21,097 44.9 −2.5 Conservative James Tumbridge 15,638 33.2 −1.4 Liberal Democrat Robin Whitmore 7,616 16.2 +1.4 Green Adrian Holmes 1,252 2.7 +1.0 UKIP John Youles 1,122 2.4 +1.4 Independent Bill Holden 308 0.7 N/A Majority 5,459 11.6 Turnout 47,033 61.1 +2.0 Labour hold Swing -0.6 General Election 2001: Norwich North Party Candidate Votes % ±% Labour Ian Gibson 21,624 47.4 -2.3 Conservative Kay Mason 15,761 34.6 +2.1 Liberal Democrat Moira Toye 6,750 14.8 +2.2 Green Rob Tinch 797 1.7 N/A UKIP Guy Cheyney 471 1.0 N/A Independent Michael Betts 211 0.5 N/A Majority 5,863 12.8 Turnout 45,614 59.1 -16.6 Labour hold Swing -2.2 Elections in the 1990s
General Election 1997: Norwich North[7] Party Candidate Votes % ±% Labour Ian Gibson 27,346 49.7 +6.9 Conservative Robert Kinghorn 17,876 32.5 -10.8 Liberal Democrat Paul Young 6,951 12.6 -0.3 Referendum Party Tony Bailey-Smith 1,777 3.2 N/A Legalise Cannabis Howard Marks 512 0.9 N/A Socialist Labour James Hood 495 0.9 N/A Natural Law Diana Mills 100 0.2 0.0 Majority 9,470 Turnout 75.9 -5.9 Labour gain from Conservative Swing +8.8 General Election 1992: Norwich North[7][8] Party Candidate Votes % ±% Conservative Patrick Thompson 22,419 43.3 −2.5 Labour Ian Gibson 22,153 42.8 +12.6 Liberal Democrat David Harrison 6,706 12.9 −11.1 Green Lou Betts 433 0.8 N/A Natural Law R. Arnold 93 0.2 N/A Majority 266 0.5 −15.2 Turnout 51,804 81.8 +2.6 Conservative hold Swing −7.6 Elections in the 1980s
General Election 1987: Norwich North[9] Party Candidate Votes % ±% Conservative Patrick Thompson 22,772 45.8 +1.1 Labour Mary Honeyball 14,996 30.2 -2.2 Liberal T. P. Nicholls 11,922 24.0 +1.4 Majority 7,776 15.7 +3.4 Turnout 49,690 79.2 +3.0 Conservative hold Swing +1.7 General Election 1983: Norwich North[10] Party Candidate Votes % ±% Conservative Patrick Thompson 21,355 44.7 +9.7 Labour David Ennals 15,476 32.4 -18.4 Liberal G. Jones 10,796 22.6 +10.5 Workers Revolutionary F. Cairns 194 0.4 +0.1 Majority 5,879 12.3 Turnout 47,821 76.2 +0.6 Conservative gain from Labour Swing +14.1 Elections in the 1970s
General Election 1979: Norwich North[11] Party Candidate Votes % ±% Labour David Ennals 15,927 50.8 -5.2 Conservative P. H. Rippon 12,336 35.0 +7.7 Liberal P. Moore 4,253 12.1 -4.7 Ecology G. Hannah 334 1.0 N/A National Front L. Goold 250 0.7 N/A Communist A. Panes 106 0.3 N/A Workers Revolutionary S. Colling 92 0.3 N/A Majority 5,591 15.8 -12.9 Turnout 75.6 +4.4 Labour hold Swing General Election October 1974: Norwich North[12] Party Candidate Votes % ±% Labour David Ennals 17,958 56.0 +7.4 Conservative T. P. Doe 8,754 27.3 -0.6 Liberal E. M. Wheeler 5,378 16.8 -5.3 Majority 9,204 28.7 +8.0 Turnout 71.2 -7.7 Labour hold Swing General Election February 1974: Norwich North[13] Party Candidate Votes % ±% Labour David Ennals 17,111 48.6 -10.1 Conservative T. P. Doe 9,817 27.9 -10.3 Liberal E. M. Wheeler 7,773 22.1 N/A National Front G. Goold 544 1.5 N/A Majority 7,294 20.7 -0.8 Turnout 78.9 +7.6 Labour hold Swing General Election 1970: Norwich North[14] Party Candidate Votes % ±% Labour George Wallace 18,564 59.7 -5.9 Conservative Amédée Turner 11,868 38.2 +3.8 Independent Progressive C. C. Fairhead 658 2.1 N/A Majority 6,696 21.5 -9.7 Turnout 71.3 -2.9 Labour hold Swing Elections in the 1960s
General Election 1966: Norwich North[15] Party Candidate Votes % ±% Labour George Wallace 18,777 65.6 +4.7 Conservative Amédée Turner 9,851 34.4 -4.7 Majority 8,926 31.2 +9.4 Turnout 74.2 -0.3 Labour hold Swing General Election 1964: Norwich North[16] Party Candidate Votes % ±% Labour George Wallace 18,111 60.9 +0.7 Conservative Amédée Turner 11,620 39.1 -0.7 Majority 6,491 21.8 +1.3 Turnout 74.5 -2.4 Labour hold Swing Elections in the 1950s
General Election 1959: Norwich North[17] Party Candidate Votes % ±% Labour John Paton 19,092 60.2 -0.5 Conservative D. R. Chance 12,609 39.8 +0.5 Majority 6,483 20.5 -0.9 Turnout 76.9 +1.6 Labour hold Swing General Election 1955: Norwich North[18] Party Candidate Votes % ±% Labour John Paton 18,682 60.7 -2.0 Conservative T. C. Eaton 12,087 39.3 +2.0 Majority 6,595 21.4 -10.1 Turnout 75.3 -8.8 Labour hold Swing General Election 1951: Norwich North[19] Party Candidate Votes % ±% Labour John Paton 22,880 62.7 +3.5 Conservative T. C. Eaton 13,587 37.3 +13.8 Majority 9,293 25.5 -10.2 Turnout 84.1 -2.1 Labour hold Swing General Election 1950: Norwich North[20] Party Candidate Votes % ±% Labour John Paton 21,898 59.2 N/A Conservative V. R. Rees 8,704 23.5 N/A Liberal Don Bennett 6,376 17.2 N/A Majority 13,194 35.7 N/A Turnout 86.2 N/A Labour hold Swing N/A See also
Notes and references
- ^ "Electorate Figures - Boundary Commission for England". 2011 Electorate Figures. Boundary Commission for England. 4 March 2011. http://www.boundarycommissionforengland.org.uk/electoral-figures/electoral-figures.htm. Retrieved 13 March 2011.
- ^ Boundary Commission for England: FINAL RECOMMENDATIONS FOR PARLIAMENTARY CONSTITUENCIES IN THE COUNTY OF NORFOLK
- ^ "MP quitting to force by-election". BBC News. 5 June 2009. http://news.bbc.co.uk/1/hi/uk_politics/8085910.stm.
- ^ Leigh Rayment's Historical List of MPs – Constituencies beginning with "N" (part 3)
- ^ Norwich North UKPolling
- ^ Sparrow, Andrew (24 July 2009). "Norwich North byelection results – live". The Guardian (London). http://www.guardian.co.uk/politics/blog/2009/jul/24/byelections-norwich-north-byelection.
- ^ a b Norwich North: Constituency, guardian.co.uk
- ^ "UK General Election results April 1992". Richard Kimber's Political Science Resources. Politics Resources. 9 April 1992. http://www.politicsresources.net/area/uk/ge92/i15.htm. Retrieved 2010-12-06.
- ^ UK General Election results: June 1987
- ^ UK General Election results: June 1983
- ^ UK General Election results: May 1979
- ^ UK General Election results: October 1974
- ^ UK General Election results: February 1974
- ^ UK General Election results: 1970
- ^ UK General Election results: March 1966
- ^ UK General Election results: October 1964
- ^ UK General Election results: October 1959
- ^ UK General Election results: May 1955
- ^ UK General Election results: October 1951
- ^ UK General Election results: February 1950
Categories:- United Kingdom Parliamentary constituencies established in 1950
- Parliamentary constituencies in Norfolk
- Politics of Norwich


Wikimedia Foundation. 2010.