- Climate of Florida
-
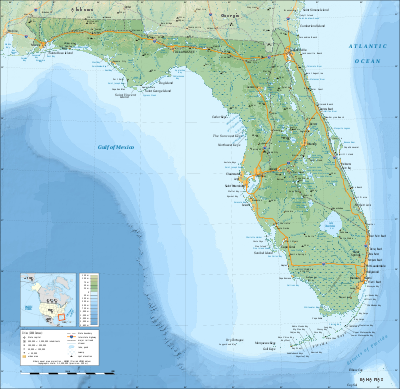 Topographical map of Florida. The state is the most southern of the contiguous 48 U.S. states, and has more coastline than any of the other 48 contiguous states.
The climate of North and Central Florida is humid subtropical. South Florida has a tropical climate.[1] There is a defined rainy season from June through September, which are the months most at risk of landfalling tropical cyclones. Thunderstorms, through lightning, lead to several deaths per year statewide. Florida is one of the most tornado-prone states in the United States. During mid summer, dust emanating from Africa affects the state, turning skies white and decreasing air quality.[2]
Between October and May, fronts regularly sweep through the state which keeps conditions dry, particularly over the peninsula. Towards the end of the dry season in the spring, brush fires become common statewide. In winters where an El Niño climate cycle exists, rainfall increases while temperatures are cooler statewide. In North Florida, snow and sleet have been witnessed as early as November and as late as April, though most areas do not experience any frozen precipitation during a typical year. Easterly winds off the warm waters of the Gulf Stream running through the Florida Straits keep temperatures moderate across the southern peninsula year round.
Contents
Pressure
The low pressure measured from an extratropical cyclone was 28.84 inches/976.7 hPa during the Storm of the Century (1993).[3] From a tropical cyclone, the lowest pressure measured was 26.35 inches/892 hPa in the Florida Keys during the Labor Day Hurricane of 1935.[4] The highest known pressure measured statewide was 30.74 inches/1041.1 hPa in Tallahassee on February 5, 1996 and January 4, 1979.[3]
Wind
Over the entire year, winds average out of the north across the panhandle and near Orlando, out of the west at Gainesville and Jacksonville, and generally out of the east elsewhere. During the summer months, the average wind pattern implies a surface ridge axis normally lies across central Florida, with easterly winds from Tampa southward and southwest winds across northern Florida, once Orlando is not considered for the distribution. The peak wind gust during the 1930 through 1997 period was 115 mph/100 knots at Miami International Airport during Hurricane Andrew.[5]
African dust outbreaks
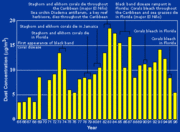
July is the month where the tradewinds south of the northward-moving subtropical ridge expand northwestward into Florida. Dust from the Sahara moving around the southern periphery of the ridge moves into the state, suppressing rainfall and changing the sky from a blue to a white appearance and leads to an increase in red sunsets. Its presence negatively impacts air quality across the Southeastern United States during the summer, by adding to the count of airborne particulates.[2] Over 50% of the African dust that reaches the United States affects Florida.[6] Since 1970, dust outbreaks have worsened due to periods of drought in Africa. There is a large variability in the dust transport to the Caribbean and Florida from year to year.[7] Dust events have been linked to a decline in the health of coral reefs across the Caribbean and Florida, primarily since the 1970s.[8]
Winter
On average, wintertime lows dip down to near 39 °F (4 °C) degrees Fahrenheit at Tallahassee in January to 65 °F (18 °C) in Key West while daytime highs range from 64 °F (18 °C) at Tallahassee to 77 °F (25 °C) at Miami.[9][10] Predominant easterly winds across southern Florida keep temperatures moderate during the winter, as the nearby Gulf Stream modifies cooler air moving in from the northeast and east. El Niño winters tend to be cooler due to increased cloud cover, but tend to have fewer freezes.[11] Despite its warm, southern location, there have been freezes detrimental to citrus production in North and Central Florida's history in the years 1835, 1894–1895, 1899, 1917, 1934, 1940, 1957, 1962, 1977, 1981, 1983, 1985, 1986, 1989, and 2010.[12][13] The record low temperature for Florida was −2 °F (−19 °C) at Tallahassee in 1899.[3] In February 2010, the USDA declared that 59 (out of 67) Florida counties were "primary natural disaster areas." This happened when the temperature falls below 28 degrees for 4 hours, where crops are being grown.[14]
Three "hardiness" zones exist. The warmest is South Florida, but includes Tampa, Melbourne and Orlando. Low temperatures range from 30 to 40 °F (-1 to 4 °C). Next is Central and North Florida with the above exclusions and includes Jacksonville, Gainesville, and Pensacola. Low temperatures range from 20 to 30 °F (-7 to -1 °C). The coolest is a relatively small area in northern Florida including Tallahassee. Low temperatures range from 10 to 20 °F (-12 to -7 °C).[15]
Summer
See also: Wet season
During the summer, minima range from near 70 °F (21 °C) in northern Florida to near 80 °F (27 °C) in the Keys. High temperatures during the summer average in the lower 90s Fahrenheit statewide.[16] Relief from the heat during the summer comes in the form of afternoon and evening thunderstorm activity, late morning and afternoon sea breezes off the relatively cooler ocean, and during the passage of a tropical cyclone. The passage of a cold front through the state is rare during the warm season. The record high temperature for the state is 109 °F (43 °C) at Monticello in 1931.[3]
Fog
Like the remainder of the Southeastern United States, Florida has a winter maximum in dense fog conditions. Unlike the remainder of the region, the maximum in Florida contains roughly half of the annual occurrences per year, on average. Its summer minimum is also less than the remainder of the Southeast. There has been no noticeable increase or decrease in fog across Florida, over the past several decades.[17]
Liquid precipitation equivalent
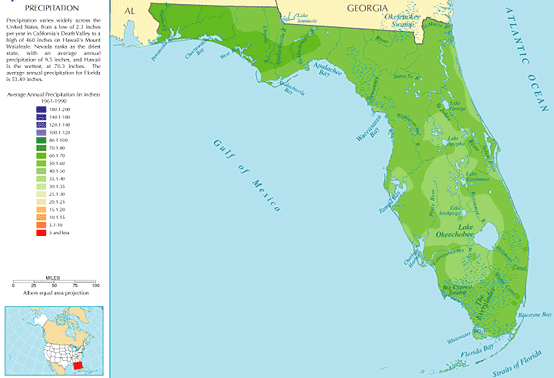
 Average Rainfall for Florida
Averages
See also: Dry season and Wet seasonStatewide, the highest rainfall amounts occur during the summer months. In northern Florida, there is a weak winter secondary maximum while statewide the driest months of the year are during the spring.[16] During El Niño, Florida sees greater rainfall between November and March.[11] Due to the lack of the secondary maximum across the peninsula, a distinct dry season is seen in the averages from winter through spring. This dry season provokes brush fires annually as temperatures rise during the late spring, before they fade during early June as the rainy season gets underway.
Extremes
 Hurricane Easy's Rainfall across the Southeastern United States
The heaviest rainfall to occur in 24 hours was measured in Yankeetown during Hurricane Easy (1950), 38.70 inches (98.3 cm). This is also the highest known point storm total maximum related to any tropical cyclone which has impacted Florida,[18] and by itself would be the highest known rainfall total for any month from any location within Florida. This rainfall amount remained the national 24-hour rainfall record until Tropical Storm Claudette (1979).[19] Heavy rainfall events have fallen due to stalled fronts near the state as well, and occur during the March through May and October through November timeframe.
The wettest month recorded at a Florida climate station was during May 1891 when Gainesville, Florida received 30.90 inches (78.5 cm).[20] The wettest year on record for a Florida climate station was during 1879 when 127.24 inches (323.2 cm) fell at Pensacola, Florida.[21] The driest year for a climate station statewide was during 1974 when only 19.99 inches (50.8 cm) fell at Key West.[22]
One of the worst years for wildfires was in 1998, at the end of an El Nino cycle. 480 wildfires consumed 500,000 acres (2,000 km2) statewide.[23] In 2010, the National Weather Service issued more fire alerts in Florida than anywhere else in the nation. In 2011, they are raising their criteria in order to drop the number reported to 1/15 of those reported in the past.[24]
A statewide drought existed until 2009, that began in November 2005, a month after Hurricane Wilma's passage through the state.[25] The previous significant drought occurred in 2000, which was the state's driest year on record.[26]
Snowfall
Main article: Snow in FloridaThe earliest recorded occurrence of snow or sleet occurred in 1774.[27] The latest occurrence of snow or sleet in the spring fell on January 7,8,and 9th 2010, as a cold front brought scattered snow flurries along with widespread sleet and freezing rain, especially in the northern and central portions of the state.[28]
The state record for snowfall is 5 inches (13 cm), set in northern Florida during January 1800.[29] The earliest in the season that frozen precipitation has fallen was during the Late November 2006 Nor'easter on November 21 across central Florida.[30] The latest in the season that snow or sleet has fallen was on April 8, 2007. A trace of snowfall has been recorded as far south as Homestead, mainly during a January 19, 1977 event.[31]
Thunderstorms
Florida receives the highest density of lightning strikes within the United States. Several deaths per year are blamed on lightning, making lightning one of the deadliest weather-related phenomenon in the state. However, since 1992, the number of lightning deaths has been slowly dropping despite a rising population, suggesting that lightning awareness programs are effective. The most likely targets of lightning strikes are construction workers and others who work outside, though 12 percent of the cases occurred indoors to people using electronic devices.[32]
Tornadoes
There are more tornadoes per square mile in Florida than any other state.[33] However, these tornadoes tend to be much weaker and short-lived than in other states like the Midwest or Great Plains. There are fewer deaths and property damage than are experienced by some other states. Strong tornadoes do occasionally form in Florida, usually in conjunctions with a cold frontal passage in the winter or spring. A total of 42 people died in February 1998 from the deadliest such tornado outbreak in Central Florida, which occurred during the nighttime hours.[34]
Tropical cyclones
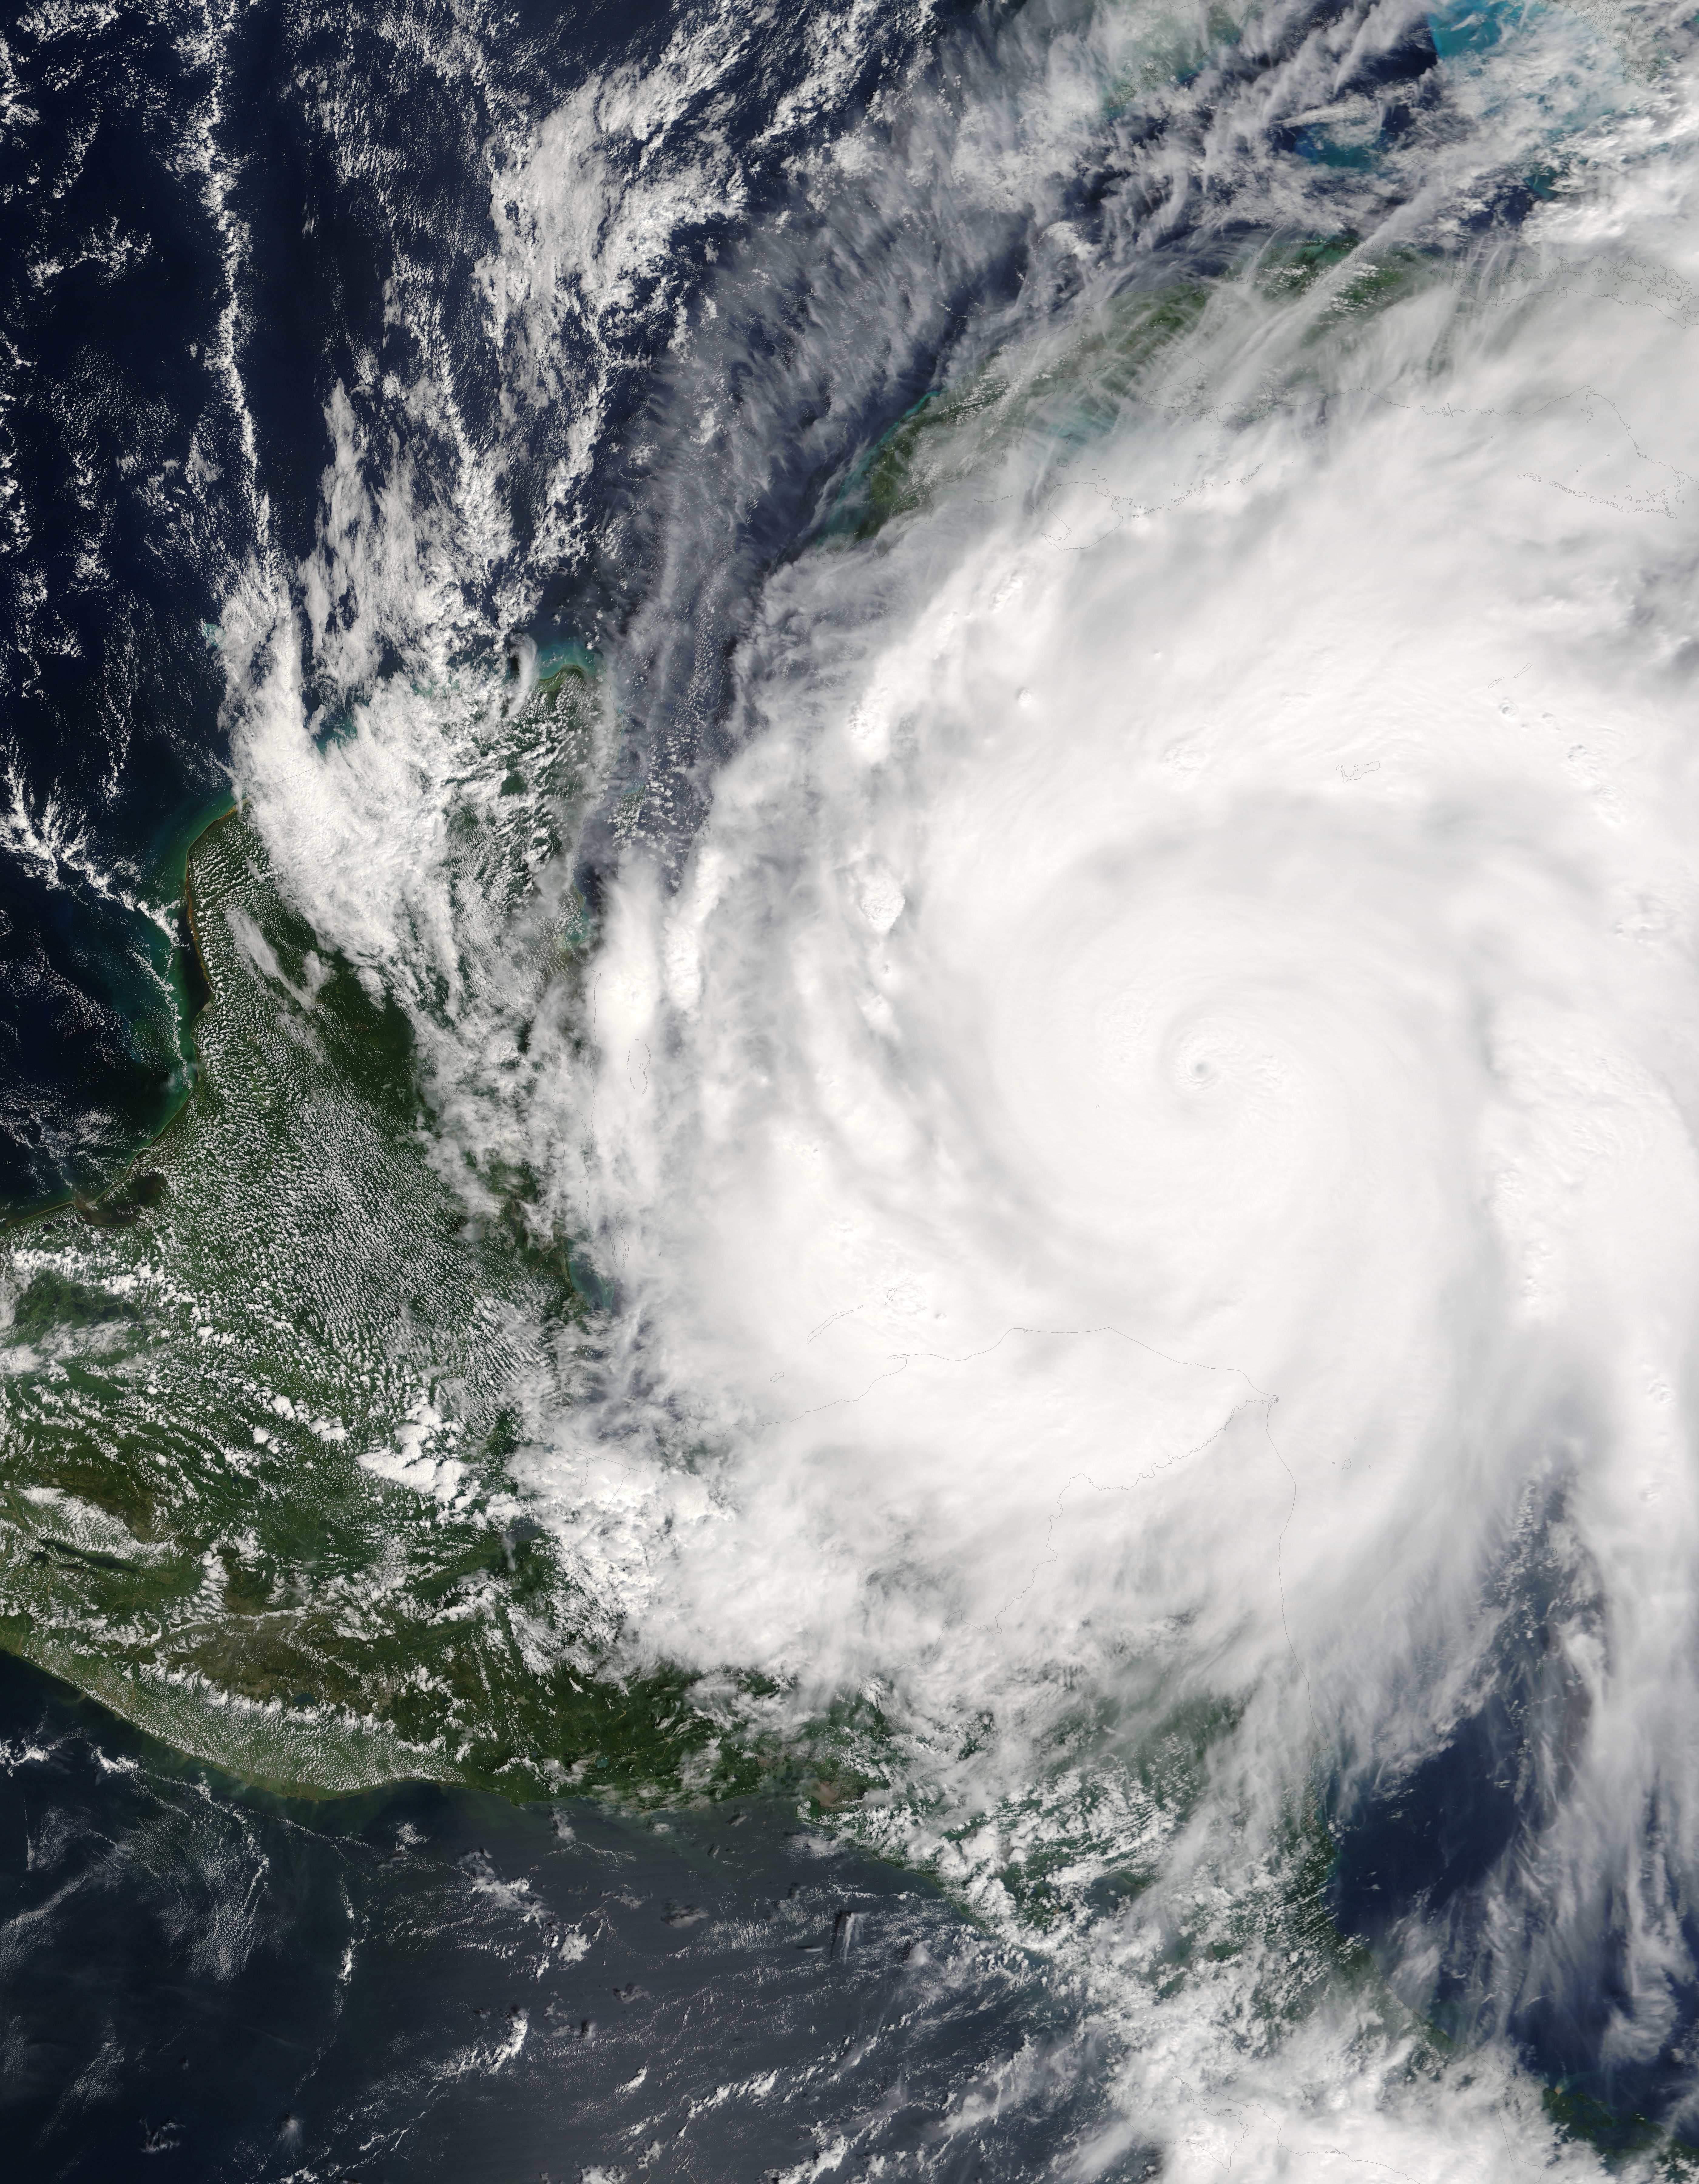
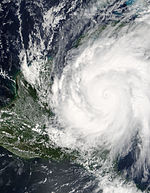 Hurricane Wilma (2005)Main article: List of Florida hurricanes
The earliest a tropical cyclone has struck the sunshine state was the Groundhog Day Tropical Storm in 1952. The latest impact was from a hurricane which struck near Tampa on December 1, 1925. The strongest hurricane to strike Florida was the Labor Day Hurricane of 1935. Hurricane Easy in 1950 produced the wettest known point total from any tropical cyclone.[18] The record number of hurricane strikes on the state in one season is four in 2004.[35] Hurricanes typically spawn tornadoes within their northeast quadrant.[36]
Tropical cyclones have affected Florida in every month of the year but January and March. Nearly one-third of the cyclones affected the state in September, and nearly three-fourths of the storms affected the state between August and October, which coincides with the peak of the hurricane season. Portions of the coastline have the lowest return period, or the frequency at which a certain intensity or category of hurricane can be expected within 86 mi (139 km) of a given location, in the country. Monroe County was struck by 26 hurricanes since 1926, which is the greatest total for any county in the United States.[37]
Effect of climate cycles
El Niño has the following effects on Florida climate: above average rainfall in the spring.[23] This is followed by wildfire threat when rain dries up. Northern Florida is more susceptible to severe weather; below normal temperatures, increased number of low pressure systems in the Gulf of Mexico during the winter, and "almost always" reduces the frequency of storms and hurricanes.[38]
La Niña has the following effects: often dry conditions prevail in late fall, winter and early spring, increased risk of wildfires in spring and summer months, the temperatures average slightly above normal, and the chance of hurricane activity increases substantially.[38]
Long term forecasts are made based on these effects. However, they are easily overridden, in winter, by the Arctic oscillation and North Atlantic oscillations, which can only be predicted about two weeks in advance.[39] These can drop the temperature noticeably from seasonal norms.
Climates of selected Florida cities
The climate regime for much of the state is humid subtropical (Koppen Cfa), though portions of the Gold Coast of southeast Florida, as well as all of the Florida Keys, qualify as tropical wet-and-dry (Koppen Aw).
A narrow eastern part of the state including Orlando and Jacksonville receives between 2,400 and 2,800 hours of sunshine annually. The rest of the state, including Miami, receives between 2,800 and 3,200 hours annually.[40]
Climate data for Pensacola, Florida Month Jan Feb Mar Apr May Jun Jul Aug Sep Oct Nov Dec Year Average high °F (°C) 61.2
(16.2)64.4
(18.0)70.2
(21.2)76.2
(24.6)83.4
(28.6)89.0
(31.7)90.7
(32.6)90.1
(32.3)87.0
(30.6)79.3
(26.3)70.3
(21.3)63.4
(17.4)77.1 Average low °F (°C) 42.7
(5.9)45.4
(7.4)51.7
(10.9)57.6
(14.2)65.8
(18.8)72.1
(22.3)74.5
(23.6)74.2
(23.4)70.4
(21.3)59.6
(15.3)51.1
(10.6)44.7
(7.1)59.2 Rainfall inches (mm) 5.34
(135.6)4.68
(118.9)6.40
(162.6)3.89
(98.8)4.40
(111.8)6.39
(162.3)8.02
(203.7)6.85
(174)5.75
(146.1)4.13
(104.9)4.46
(113.3)3.97
(100.8)64.28
(1,632.7)Source: NOAA Climate data for Tallahassee, Florida Month Jan Feb Mar Apr May Jun Jul Aug Sep Oct Nov Dec Year Average high °F (°C) 63.9
(17.7)66.9
(19.4)73.3
(22.9)80.0
(26.7)86.6
(30.3)90.6
(32.6)91.5
(33.1)91.1
(32.8)88.2
(31.2)81.0
(27.2)72.3
(22.4)65.5
(18.6)79.2 Average low °F (°C) 39.8
(4.3)41.8
(5.4)47.4
(8.6)53.2
(11.8)61.9
(16.6)69.2
(20.7)71.7
(22.1)71.8
(22.1)68.5
(20.3)57.1
(13.9)46.8
(8.2)41.2
(5.1)55.9 Rainfall inches (mm) 4.37
(111)4.86
(123.4)5.72
(145.3)3.74
(95)4.27
(108.5)7.11
(180.6)8.27
(210.1)7.33
(186.2)5.43
(137.9)3.17
(80.5)3.34
(84.8)4.18
(106.2)61.79
(1,569.5)Source: Florida Climate Center Climate data for Jacksonville, Florida Month Jan Feb Mar Apr May Jun Jul Aug Sep Oct Nov Dec Year Average high °F (°C) 65.1
(18.4)67.8
(19.9)73.6
(23.1)79.7
(26.5)85.8
(29.9)89.8
(32.1)91.9
(33.3)90.8
(32.7)87.1
(30.6)80.3
(26.8)73.0
(22.8)66.5
(19.2)79.3 Average low °F (°C) 42.5
(5.8)44.9
(7.2)50.2
(10.1)55.9
(13.3)63.7
(17.6)70.2
(21.2)72.8
(22.7)72.7
(22.6)70.1
(21.2)60.8
(16.0)50.7
(10.4)44.0
(6.7)58.2 Rainfall inches (mm) 3.03
(77)3.42
(86.9)3.72
(94.5)2.82
(71.6)3.40
(86.4)5.99
(152.1)6.57
(166.9)7.23
(183.6)7.83
(198.9)3.92
(99.6)1.90
(48.3)2.61
(66.3)62.44
(1,586)Source: Florida Climate Center Climate data for Orlando, Florida Month Jan Feb Mar Apr May Jun Jul Aug Sep Oct Nov Dec Year Average high °F (°C) 71.8
(22.1)73.9
(23.3)78.8
(26.0)83.0
(28.3)88.2
(31.2)91.0
(32.8)92.2
(33.4)92.0
(33.3)90.3
(32.4)85.0
(29.4)78.9
(26.1)73.3
(22.9)83.2 Average low °F (°C) 49.9
(9.9)51.3
(10.7)55.9
(13.3)59.9
(15.5)65.9
(18.8)71.3
(21.8)72.6
(22.6)73.0
(22.8)71.9
(22.2)65.5
(18.6)58.7
(14.8)52.6
(11.4)62.4 Rainfall inches (mm) 2.43
(61.7)2.35
(59.7)3.54
(89.9)2.42
(61.5)3.74
(95)7.35
(186.7)7.15
(181.6)6.25
(158.8)5.76
(146.3)2.73
(69.3)2.32
(58.9)2.31
(58.7)48.35
(1,228.1)Source: Florida Climate Center Climate data for Tampa, Florida Month Jan Feb Mar Apr May Jun Jul Aug Sep Oct Nov Dec Year Average high °F (°C) 70.1
(21.2)71.6
(22.0)76.3
(24.6)80.6
(27.0)86.3
(30.2)88.9
(31.6)89.7
(32.1)90.0
(32.2)89.0
(31.7)84.1
(28.9)78.0
(25.6)72.0
(22.2)81.4 Average low °F (°C) 52.4
(11.3)53.8
(12.1)58.5
(14.7)62.4
(16.9)68.9
(20.5)74.0
(23.3)75.3
(24.1)75.4
(24.1)74.3
(23.5)67.6
(19.8)60.7
(15.9)54.7
(12.6)64.8 Rainfall inches (mm) 2.27
(57.7)2.67
(67.8)2.84
(72.1)1.80
(45.7)2.85
(72.4)5.50
(139.7)6.49
(164.8)7.60
(193)6.54
(166.1)2.29
(58.2)1.62
(41.1)2.30
(58.4)44.77
(1,137.2)Source: Florida Climate Center Climate data for Miami, Florida Month Jan Feb Mar Apr May Jun Jul Aug Sep Oct Nov Dec Year Average high °F (°C) 75.7
(24.3)77.0
(25.0)79.7
(26.5)82.7
(28.2)85.9
(29.9)88.3
(31.3)89.6
(32.0)89.9
(32.2)88.4
(31.3)85.1
(29.5)80.6
(27.0)76.9
(24.9)83.3 Average low °F (°C) 59.6
(15.3)60.9
(16.1)64.3
(17.9)68.1
(20.1)72.2
(22.3)75.1
(23.9)76.5
(24.7)76.8
(24.9)75.9
(24.4)72.4
(22.4)67.7
(19.8)61.8
(16.6)69.2 Rainfall inches (mm) 1.80
(45.7)2.12
(53.8)2.49
(63.2)3.20
(81.3)5.91
(150.1)9.33
(237)6.24
(158.5)7.97
(202.4)9.11
(231.4)6.95
(176.5)2.92
(74.2)1.95
(49.5)59.97
(1,523.2)Source: Florida Climate Center Climate data for Key West, Florida Month Jan Feb Mar Apr May Jun Jul Aug Sep Oct Nov Dec Year Average high °F (°C) 74.7
(23.7)75.7
(24.3)78.7
(25.9)81.7
(27.6)85.2
(29.6)88.0
(31.1)89.4
(31.9)89.6
(32.0)88.2
(31.2)84.7
(29.3)80.0
(26.7)76.1
(24.5)82.7 Average low °F (°C) 64.7
(18.2)65.6
(18.7)68.7
(20.4)72.0
(22.2)75.7
(24.3)78.4
(25.8)79.6
(26.4)79.4
(26.3)78.4
(25.8)75.7
(24.3)71.2
(21.8)66.6
(19.2)73.0 Rainfall inches (mm) 1.96
(49.8)1.60
(40.6)1.66
(42.2)1.82
(46.2)3.07
(78)4.61
(117.1)3.69
(93.7)5.30
(134.6)6.55
(166.4)5.02
(127.5)2.49
(63.2)2.04
(51.8)39.83
(1,011.7)Source: Florida Climate Center See also
- Climate
- Climatology
- List of wettest known tropical cyclones in Florida
- Climate of Miami
- Climate of the Tampa Bay Area
References
- ^ Koppen Classification Map, clearly showing South Florida has a tropical climate (image will take a few seconds to load)
- ^ a b Science Daily. African Dust Called A Major Factor Affecting Southeast U.S. Air Quality. Retrieved on 2007-06-10.
- ^ a b c d National Weather Service Forecast Office Tallahassee, Florida. Tallahassee Weather Extremes. Retrieved on 2007-06-03. Archived October 14, 2006 at the Wayback Machine
- ^ Eric. S. Blake, Edward N. Rappaport, and Christopher W. Landsea. The Deadliest, Costliest, and Most Intense United States Tropical Cyclones from 1851 to 2006 (AND OTHER FREQUENTLY REQUESTED HURRICANE FACTS). Retrieved on 2007-06-03.
- ^ National Climatic Data Center. Climatic Wind Data for the United States. Retrieved on 2007-06-02. Archived June 13, 2007 at the Wayback Machine
- ^ Science Daily. Microbes And The Dust They Ride In On Pose Potential Health Risks. Retrieved on 2007-06-10.
- ^ Usinfo.state.gov. Study Says African Dust Affects Climate in U.S., Caribbean. Retrieved on 2007-06-10.
- ^ U. S. Geological Survey. Coral Mortality and African Dust. Retrieved on 2007-06-10.
- ^ Southeast Regional Climate Center. Tallahassee WSO AP Averages from 1948-2005. Retrieved on 2007-06-02.
- ^ Southeast Regional Climate Center. Key West WSO AP Averages from 1948-2005. Retrieved on 2007-06-02.
- ^ a b South Florida Water Management District. EL NINO IN SOUTH FLORIDA. Retrieved on 2007-06-02. Archived September 16, 2007 at the Wayback Machine
- ^ Florida Citrus Mutual: Timeline of Florida Freezes
- ^ "Value of citrus and noncitrus production falls 3 percent from last year's record - 1990 late-December California temperature freeze causes sharp decline in citrus production that offsets higher value of non-citrus crop - U.S. Dept. of Agriculture, Economic Research Service report". Situation and Outlook Report: Fruit and Tree Nuts. 1991. http://findarticles.com/p/articles/mi_m3837/is_/ai_11911340.
- ^ Krol, Jenet (19 February 2010). "USDA declares Brevard County primary disaster area". Fort Pierce, Florida: Hometown News:The Beaches. pp. A4. http://www.myhometownnews.net/index.php?id=66890.
- ^ Kridler, Chris (5 March 2011). "Freeze frazzled? Seek hardier plants". Florida Today (Melbourne, Florida): pp. 1D. http://www.floridatoday.com/article/20110305/LIFE/103050301/Freeze-frazzled-Brevard-County-gardeners-seek-hardier-plants.
- ^ a b Southeast Regional Climate Center. Historical Climate Summaries for Florida. Retrieved on 2007-06-02.
- ^ Gloria Forthun, M. B. Johnson, W. G. Schmitz, and J. Blume. Trends in Fog Frequency and Duration in the Southeast United States. Retrieved on 2007-06-07.
- ^ a b David Roth. Tropical Cyclone Point Maxima. Retrieved on 2007-06-02.
- ^ David Roth. Hurricane Easy (1950) Rainfall Graphic. Retrieved on 2007-06-02.
- ^ Florida Climate Center. Gainesville Precipitation Data. Retrieved on 2007-06-02.
- ^ Florida Climate Center. Pensacola Precipitation Data. Retrieved on 2007-06-02.
- ^ Florida Climate Center. Key West Precipitation Data. Retrieved on 2007-06-02.
- ^ a b Waymer, Jim (11 March 2010). "Casualties of cold enhance fire fear". Melbourne, Florida: Florida Today. pp. 3A. http://www.floridatoday.com/article/20100311/NEWS01/3110311/Casualties-of-cold-enhance-fire-fear.
- ^ Knapp, Andrew (28 February 2011). "Wildfire alerts get stricted". Florida Today (Melbourne, Florida): pp. 1A. http://www.floridatoday.com/article/20110228/NEWS01/102280309/1006/rss01/Wildfire-alerts-get-stricter-Florida.
- ^ Travis Reed.Drought Saps Fla. Growers, Golf Courses Retrieved on 2007-06-02.
- ^ NOAA. SEVERE DROUGHT CONDITIONS/FIRE DANGER LIKELY TO PERSIST THROUGHOUT CENTRAL FLORIDA. Retrieved on 2007-06-02.
- ^ T. Frederick Davis (1908). "Climatology of Jacksonville, Fla. and Vicinity" (PDF). U.S. Weather Bureau. http://docs.lib.noaa.gov/rescue/mwr/035/mwr-035-12-0566.pdf. Retrieved 2008-03-09.
- ^ http://news.yahoo.com/s/ap/20100110/ap_on_re_us/us_winter_weather
- ^ George Winterling (2003-12-04). Snow on the First Coast. Retrieved on 2007-01-22.
- ^ Local6.com. Snow Falls In Central Florida. Retrieved on 2006-11-26.
- ^ National Weather Service Forecast Office Tallahassee, Florida. Florida's Top 10 Weather Events of the 20th Century. Retrieved on 2007-06-03. Archived October 14, 2006 at the Wayback Machine
- ^ Charles H. Paxton, J. Colson and N. Carlisle (2008). "P2.13 Florida lightning deaths and injuries 2004-2007". American Meteorological Society. http://ams.confex.com/ams/88Annual/techprogram/paper_132808.htm. Retrieved 2009-09-05.
- ^ http://www.tornadoproject.com/toptens/topten1.htm accessed October 14, 2007
- ^ United States Department of Commerce (June 1998). "Service Assessment: Central Florida Tornado Outbreak February 22–23, 1998". National Weather Service. http://www.nws.noaa.gov/os/assessments/pdfs/cntrlfl.pdf. Retrieved 2009-09-05.
- ^ National Hurricane Center. Atlantic Tracks File 1851-2006. Retrieved on 2007-06-02. Archived August 20, 2007 at the Wayback Machine
- ^ Atlantic Oceanographic and Meteorological Laboratory, Hurricane Research Division (2006-10-04). "Frequently Asked Questions: Are TC tornadoes weaker than midlatitude tornadoes?". NOAA. http://www.aoml.noaa.gov/hrd/tcfaq/L6.html. Retrieved 2006-07-25.
- ^ National Hurricane Center (2006). "Tropical Cyclone Climatology". http://www.nhc.noaa.gov/pastprofile.shtml. Retrieved 2007-10-02.
- ^ a b Florida Disaster Management accessed March 9, 2008[dead link]
- ^ Rice, Doyle (28 December 2010). "Winter "wild card" in play". Melbourne, Florida: Florida Today. pp. 4A. http://www.usatoday.com/weather/forecast/2010-12-28-whysocold28_ST_N.htm?csp=34news&utm_source=feedburner&utm_medium=feed&utm_campaign=Feed%3A+UsatodaycomNation-TopStories+%28News+-+Nation+-+Top+Stories%29.
- ^ "united states annual sunshine map". HowStuffWorks, Inc. http://maps.howstuffworks.com/united-states-annual-sunshine-map.htm. Retrieved 2011-03-14.
- ^ "Pensacola Climate Normals". National Oceanic and Atmospheric Administration. http://www.srh.noaa.gov/mob/?n=pns_normals.
- ^ "Tallahassee Climate Normals". Florida Climate Center. http://www.sercc.com/cgi-bin/sercc/cliMAIN.pl?fl8758.
- ^ "Jacksonville Climate Normals". Florida Climate Center. http://www.sercc.com/cgi-bin/sercc/cliMAIN.pl?fl4358.
- ^ "Orlando Climate Normals". Florida Climate Center. http://coaps.fsu.edu/climate_center/data/1971-2000normals_orlando.shtml.
- ^ "Tampa Climate Normals". Florida Climate Center. http://coaps.fsu.edu/climate_center/data/1971-2000normals_tampa.shtml.
- ^ "Miami Climate Normals". Florida Climate Center. http://www.sercc.com/cgi-bin/sercc/cliMAIN.pl?fl5663.
- ^ "Key West Climate Normals". Florida Climate Center. http://www.sercc.com/cgi-bin/sercc/cliMAIN.pl?fl4570.
Climate of the United States States - Alabama
- Alaska
- Arizona
- Arkansas
- California
- Colorado
- Connecticut
- Delaware
- Florida
- Georgia
- Hawaii
- Idaho
- Illinois
- Indiana
- Iowa
- Kansas
- Kentucky
- Louisiana
- Maine
- Maryland
- Massachusetts
- Michigan
- Minnesota
- Mississippi
- Missouri
- Montana
- Nebraska
- Nevada
- New Hampshire
- New Jersey
- New Mexico
- New York
- North Carolina
- North Dakota
- Ohio
- Oklahoma
- Oregon
- Pennsylvania
- Rhode Island
- South Carolina
- South Dakota
- Tennessee
- Texas
- Utah
- Vermont
- Virginia
- Washington
- West Virginia
- Wisconsin
- Wyoming
Federal district Insular areas - American Samoa
- Guam
- Northern Mariana Islands
- Puerto Rico
- U.S. Virgin Islands
External links
Categories:


Wikimedia Foundation. 2010.