- DeKalb County, Illinois
-
DeKalb County, Illinois 
Seal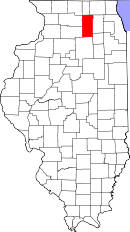
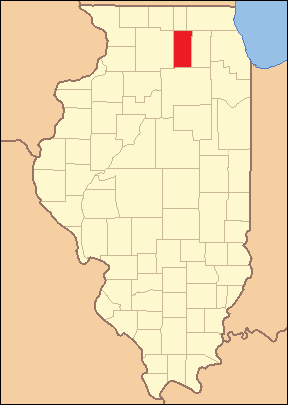
Location in the state of Illinois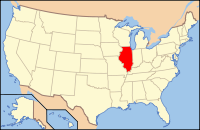
Illinois's location in the U.S.Founded 1836 Seat Sycamore Area
- Total
- Land
- Water
634.66 sq mi (1,644 km²)
631.31 sq mi (1,635 km²)
3.35 sq mi (9 km²), 0.53%Population
- (2010)
- Density
105,160
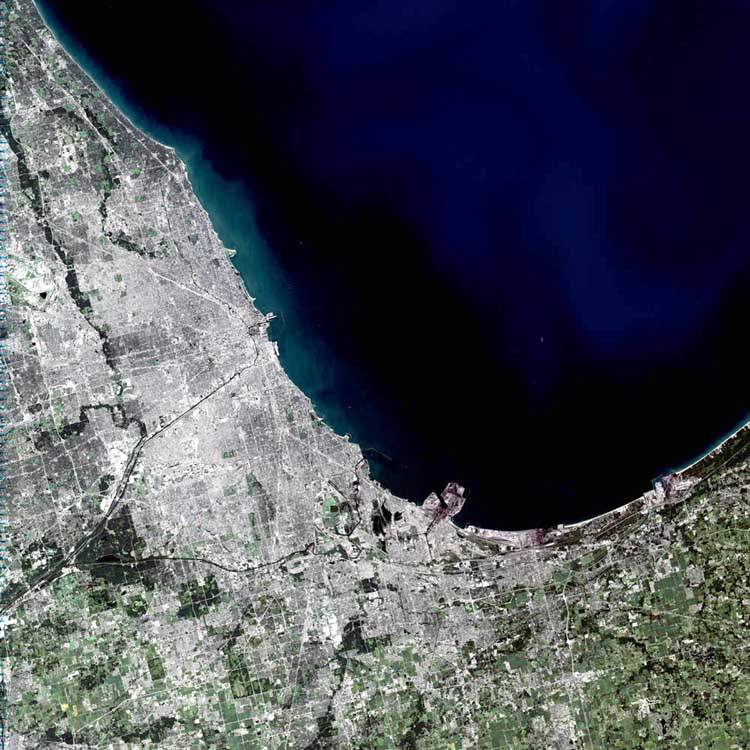
140/sq mi (54/km²)Website www.dekalbcounty.org DeKalb County is a county located in the U.S. state of Illinois. According to the 2010 census, it has a population of 105,160, which is an increase of 18.2% from 88,969 in 2000.[1] Its county seat is Sycamore.[2] DeKalb County is part of the Chicago metropolitan statistical area.
Contents
History
DeKalb County was formed in 1837 out of Kane County, Illinois. The County was named in honor of Johann de Kalb, a German (Bavarian) hero of the American Revolutionary War. Kalb was with Gen. Washington at Valley Forge. He was killed at the Battle of Camden.
-

DeKalb County at the time of its creation in 1837
Pronunciation
Unlike similarly spelled locations, such as DeKalb County, Georgia, DeKalb denizens from Illinois pronounce the county name /dɨˈkælb/ "di-KALB", with an L sound, as opposed to a silent "L."
Geography
According to the 2010 census, the county has a total area of 634.66 square miles (1,643.8 km2), of which 631.31 square miles (1,635.1 km2) (or 99.47%) is land and 3.35 square miles (8.7 km2) (or 0.53%) is water.[3]
Adjacent counties
- Boone County - north
- McHenry County - northeast
- Kane County - east
- Kendall County - southeast
- LaSalle County - south
- Lee County - west
- Ogle County - west
- Winnebago County - northwest
See also: List of counties bordering eight countiesMajor highways
 Interstate 88
 US Route 30
 US Route 34
 Illinois Route 23
 Illinois Route 38
 Illinois Route 64
 Illinois Route 72
Townships
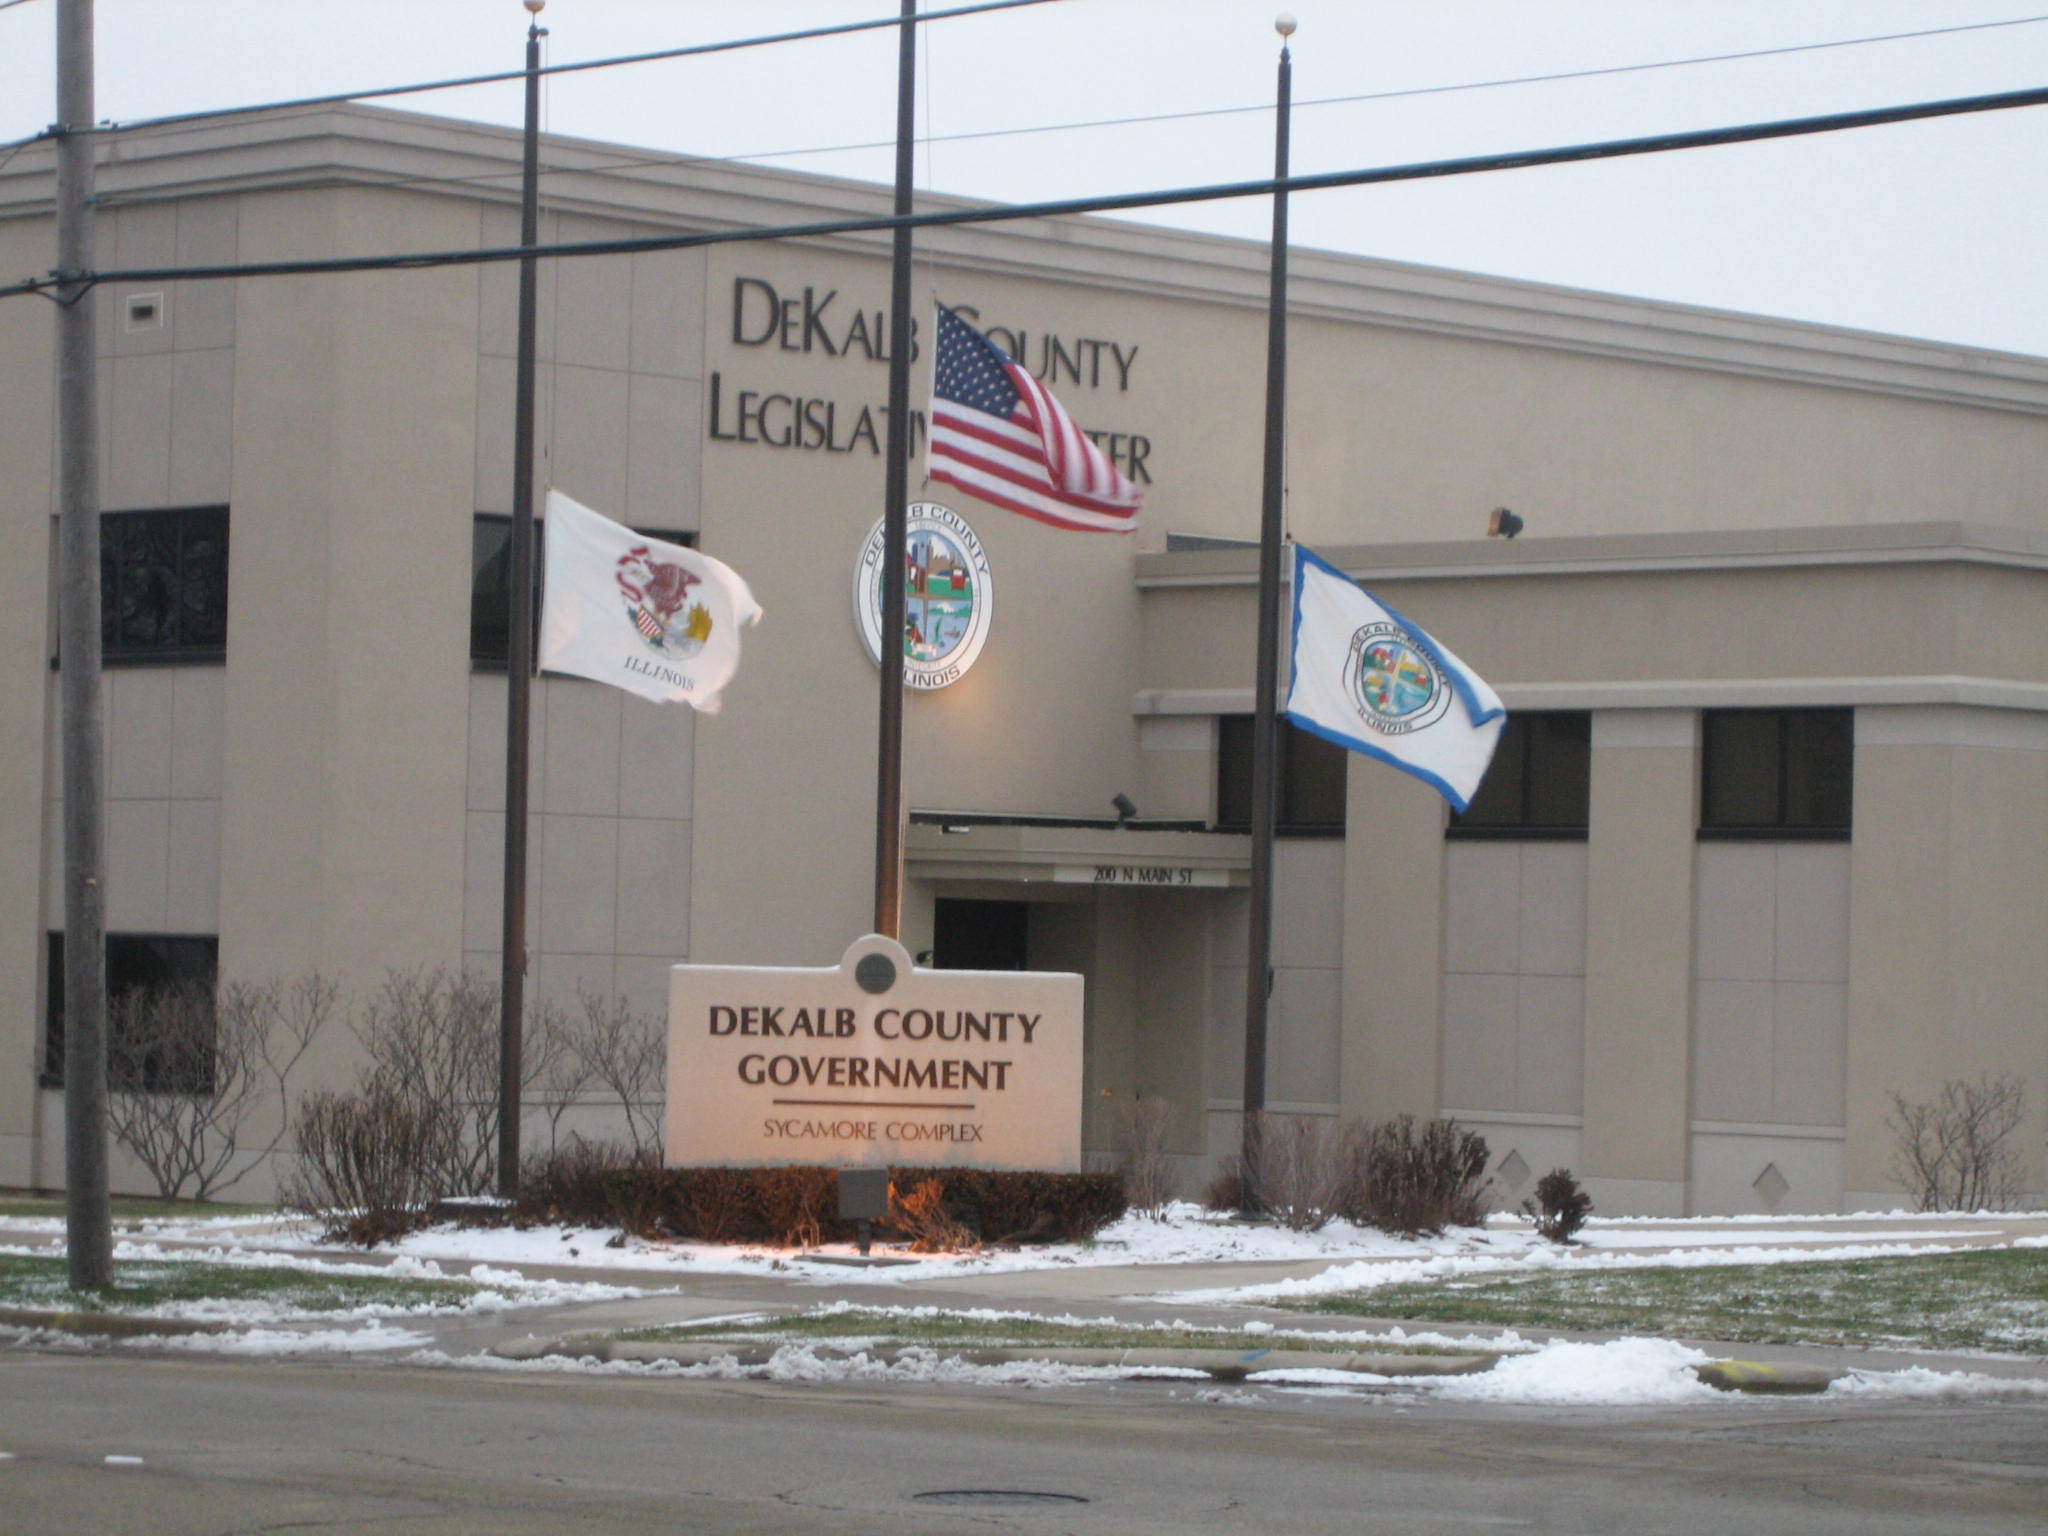
 DeKalb County's Legislative Center.
DeKalb County is divided into nineteen townships:
Cities and towns
- Cortland
- DeKalb
- Genoa
- Hinckley
- Kingston
- Kirkland
- Lee
- Malta
- Maple Park - Mostly in Kane County, Illinois
- Sandwich (north three-quarters)
- Shabbona
- Somonauk (north three-quarters)
- Sycamore
- Waterman
Political districts
- Illinois' 14th congressional district
- Illinois 16th Congressional District
- State House District 70
- State House District 90
- State Senate District 35
- State Senate District 45
- Note: Illinois was redistricted in 2011 as a result of the loss of a Congressional seat (IL went from holding 19 to 18). Prior to redistricting DeKalb was represented by House Districts: 69 and 70; Senate District: 35; and Congressional District: 14
Demographics
DeKalb County
Population by year2010 - 105,160
2000 - 88,969
1990 - 77,932
1980 - 74,624
1970 - 71,654
1960 - 51,714
1950 - 40,781
1940 - 34,388
1930 - 32,644
1920 - 31,339
1910 - 33,457
1900 - 31,756
1890 - 27,066
1880 - 26,768
1870 - 23,265
1860 - 19,086
1850 - 7,540
1840 - 1,697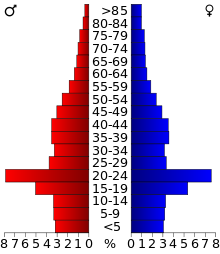 2000 census age pyramid for DeKalb County.
As of the census[4] of 2000, there were 88,969 people, 31,674 households, and 19,954 families residing in the county. The population density was 140 people per square mile (54/km²). There were 32,988 housing units at an average density of 52 per square mile (20/km²). The racial makeup of the county was 88.46% White, 4.59% Black or African American, 0.22% Native American, 2.35% Asian, 0.07% Pacific Islander, 2.74% from other races, and 1.57% from two or more races. 6.55% of the population were Hispanic or Latino of any race. 25.6% were of German, 10.8% Irish, 7.2% English, 5.9% American and 5.0% Norwegian ancestry according to Census 2000. 90.8% spoke English and 5.7% Spanish as their first language.
There were 31,674 households out of which 32.50% had children under the age of 18 living with them, 50.90% were married couples living together, 8.50% had a female householder with no husband present, and 37.00% were non-families. 25.50% of all households were made up of individuals and 7.90% had someone living alone who was 65 years of age or older. The average household size was 2.56 and the average family size was 3.11.
In the county the population was spread out with 23.10% under the age of 18, 22.00% from 18 to 24, 27.60% from 25 to 44, 17.40% from 45 to 64, and 9.80% who were 65 years of age or older. The median age was 28 years. For every 100 females there were 98.20 males. For every 100 females age 18 and over, there were 96.50 males.
The median income for a household in the county was $45,828, and the median income for a family was $58,194. Males had a median income of $41,111 versus $26,690 for females. The per capita income for the county was $19,462. About 5.10% of families and 11.40% of the population were below the poverty line, including 7.10% of those under age 18 and 4.50% of those age 65 or over.
Climate and weather
Sycamore, Illinois Climate chart (explanation) J F M A M J J A S O N D 1.527101.432162.544263.558374.270484.580584.284634.581613.574512.662402.845282.13217Average max. and min. temperatures in °F Precipitation totals in inches Source: The Weather Channel[5] Metric conversion J F M A M J J A S O N D 39-3-12360-9627-38914310721911427141072917114271689231166174727-2540-8Average max. and min. temperatures in °C Precipitation totals in mm In recent years, average temperatures in the county seat of Sycamore have ranged from a low of 10 °F (−12 °C) in January to a high of 84 °F (29 °C) in July, although a record low of −27 °F (−33 °C) was recorded in January 1985 and a record high of 103 °F (39 °C) was recorded in August 1988. Average monthly precipitation ranged from 1.40 inches (36 mm) in February to 4.49 inches (114 mm) in June.[5]
See also
References
- Forstall, Richard L. (editor) (1996). Population of states and counties of the United States: 1790 to 1990 : from the twenty-one decennial censuses. United States Department of Commerce, Bureau of the Census, Population Division. ISBN 0-934213-48-8.
- United States Census Bureau 2007 TIGER/Line Shapefiles
- United States Board on Geographic Names (GNIS)
- United States National Atlas
- ^ "DeKalb County QuickFacts". United States Census Bureau. http://quickfacts.census.gov/qfd/states/17/17037.html. Retrieved 2011-11-05.
- ^ "Find a County". National Association of Counties. http://www.naco.org/Counties/Pages/FindACounty.aspx. Retrieved 2011-06-07.
- ^ "Census 2010 U.S. Gazetteer Files: Counties". United States Census. http://www.census.gov/geo/www/gazetteer/files/Gaz_counties_national.txt. Retrieved 2011-11-05.
- ^ "American FactFinder". United States Census Bureau. http://factfinder.census.gov. Retrieved 2008-01-31.
- ^ a b "Monthly Averages for Sycamore, Illinois". The Weather Channel. http://www.weather.com/weather/wxclimatology/monthly/graph/USIL1144. Retrieved 2011-01-27.
Further reading
- Eric W. Mogren. Native Soil: A History of the DeKalb County Farm Bureau (DeKalb: Northern Illinois University Press, 2005), 288 pp.
External links
- History pages for DeKalb County towns and cities
- De Kalb County at the Open Directory Project
- DeKalb County Youth Service Bureau
- Taming the Wild Prairie: A History of DeKalb County, Illinois, 1837-1900, Illinois Historical Digitization Projects at Northern Illinois University Libraries
- DeKalb County Online Newspaper

Winnebago County Boone County McHenry County Lee County and Ogle County 
Kane County  DeKalb County, Illinois

LaSalle County Kendall County Municipalities and communities of DeKalb County, Illinois Cities 
Town Villages Townships Unincorporated
communitiesAfton Center | Charter Grove | Clare | Colvin Park | East Paw Paw‡ | Elva | Fairdale | Five Points | Franks | McGirr | New Lebanon | Rollo | Shabbona Grove | Wilkinson
Ghost towns Footnotes ‡This populated place also has portions in an adjacent county or counties
 State of Illinois
Topics - Index
- Buildings and structures
- Communications
- Culture
- Delegations
- Economy
- Education
- Environment
- Geography
- Government
- Health
- History
- Music
- People
- Portal
- Society
- Sports
- Tourism
- Transportation
- Windmills
Regions - American Bottom
- Central Illinois
- Champaign–Urbana metropolitan area
- Chicago metropolitan area
- Driftless Area
- Forgottonia
- Fox Valley
- Illinois–Indiana–Kentucky Tri-State Area
- Metro East
- Mississippi Alluvial Plain
- North Shore
- Northern Illinois
- Northwestern Illinois
- Peoria metropolitan area
- Quad Cities
- River Bend
- Rockford metropolitan area
- Southern Illinois
- Streatorland
- Wabash Valley
Major cities,
towns and villages- Alton/Granite City/Edwardsville
- Arlington Heights/Palatine
- Aurora/Naperville/Oswego/Plainfield
- Bartlett/Hanover Park/Streamwood
- Belleville/East St. Louis/Collinsville/O'Fallon
- Berwyn/Cicero
- Bloomington/Normal
- Bolingbrook/Romeoville
- Buffalo Grove/Wheeling
- Calumet City
- Canton
- Carbondale
- Carol Stream/Glendale Heights
- Centralia
- Champaign/Urbana
- Charleston/Mattoon
- Chicago
- Chicago Heights
- Crystal Lake/Algonquin
- Danville
- Decatur
- DeKalb/Sycamore
- Des Plaines/Mount Prospect/Park Ridge
- Dixon
- Downers Grove/Woodridge
- Effingham
- Elgin/Carpentersville
- Elmhurst/Lombard/Addison
- Evanston/Skokie
- Freeport
- Galesburg
- Glenview/Northbrook
- Harrisburg
- Jacksonville
- Joliet
- Kankakee/Bradley/Bourbonnais
- Lincoln
- Macomb
- Marion/Herrin
- Moline/East Moline/Rock Island
- Mount Vernon
- Mundelein
- Oak Lawn
- Oak Park
- Orland Park/Tinley Park
- Ottawa/Streator/LaSalle/Peru
- Peoria/Pekin/East Peoria/Morton
- Pontiac
- Quincy
- Rochelle
- Rockford/Belvidere/Machesney Park/Loves Park
- St. Charles
- Schaumburg/Hoffman Estates/Elk Grove Village
- Springfield
- Sterling/Rock Falls
- Taylorville
- Waukegan/North Chicago/Gurnee
- Wheaton
Counties - Adams
- Alexander
- Bond
- Boone
- Brown
- Bureau
- Calhoun
- Carroll
- Cass
- Champaign
- Christian
- Clark
- Clay
- Clinton
- Coles
- Cook
- Crawford
- Cumberland
- DeKalb
- DeWitt
- Douglas
- DuPage
- Edgar
- Edwards
- Effingham
- Fayette
- Ford
- Franklin
- Fulton
- Gallatin
- Greene
- Grundy
- Hamilton
- Hancock
- Hardin
- Henderson
- Henry
- Iroquois
- Jackson
- Jasper
- Jefferson
- Jersey
- Jo Daviess
- Johnson
- Kane
- Kankakee
- Kendall
- Knox
- LaSalle
- Lake
- Lawrence
- Lee
- Livingston
- Logan
- Macon
- Macoupin
- Madison
- Marion
- Marshall
- Mason
- Massac
- McDonough
- McHenry
- McLean
- Menard
- Mercer
- Monroe
- Montgomery
- Morgan
- Moultrie
- Ogle
- Peoria
- Perry
- Piatt
- Pike
- Pope
- Pulaski
- Putnam
- Randolph
- Richland
- Rock Island
- Saline
- Sangamon
- Schuyler
- Scott
- Shelby
- St. Clair
- Stark
- Stephenson
- Tazewell
- Union
- Vermilion
- Wabash
- Warren
- Washington
- Wayne
- White
- Whiteside
- Will
- Williamson
- Winnebago
- Woodford
Categories:- Illinois counties
- DeKalb County, Illinois
- 1836 establishments in the United States
- Populated places established in 1836
- Chicago metropolitan area
-


Wikimedia Foundation. 2010.