- Cartogram
-
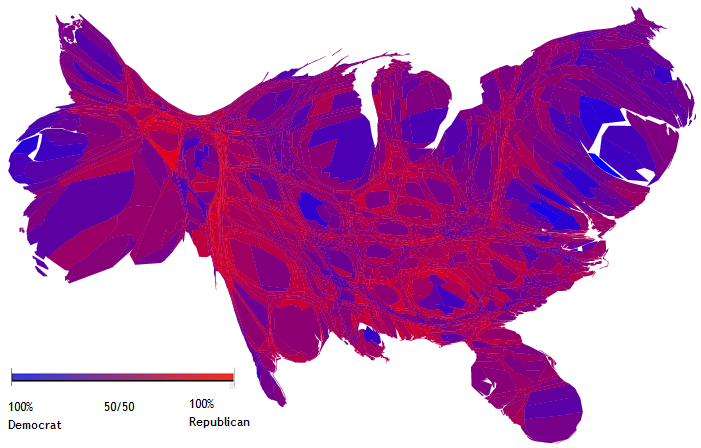
 Area cartogram of the United States, with each county rescaled in proportion to its population. Colors refer to the results of the 2004 U.S. presidential election popular vote.
 Cartogram showing Open Europe estimate of total European Union per capita net budget expenditure in euros for the whole period 2007-2013 per capita, based on Eurostat 2007 pop. estimates (Luxembourg not shown).
Net contributors-5000 to -1000 euro per capita-1000 to -500 euro per capita-500 to 0 euro per capita
Net recipients
0 to 500 euro per capita500 to 1000 euro per capita1000 to 5000 euro per capita5000 to 10000 euro per capita10000 euro plus per capitan/a Kartenanamorphote (not Kartogramm) of Germany, with the states and districts resized according to population.
A cartogram is a map in which some thematic mapping variable – such as travel time or Gross National Product – is substituted for land area or distance. The geometry or space of the map is distorted in order to convey the information of this alternate variable. There are two main types of cartograms: area and distance cartograms.
Contents
Area cartograms
An area cartogram is sometimes referred to as a value-by-area map or an isodemographic map, the latter particularly for a population cartogram, which illustrates the relative sizes of the populations of the countries of the world by scaling the area of each country in proportion to its population; the shape and relative location of each country is retained to as large an extent as possible, but inevitably a large amount of distortion results. Other synonyms in use are anamorphic map and density-equalizing map.[1][2]
Distance cartogram
A distance cartogram may also be called a central-point cartogram. This form is typically used to show relative travel times and directions from vertices in a network.
Production
One of the first cartographers to generate cartograms with the aid of computer visualization was Waldo Tobler of UC Santa Barbara in the 1960s. Prior to Tobler's work, cartograms were created by hand (as they occasionally still are). A number of software packages generate cartograms.
See also
Further reading
- Campbell, John. Map Use and Analysis. New York: McGraw-Hill, 2001.
- Gillard, Quentin. "Places in the News: The Use of Cartograms in Introductory Geography Courses." Journal of Geography. 78 (1979): 114-115.
- Tobler, Waldo. "Thirty-Five Years of Computer Cartograms." Annals of the Association of American Geographers. 94 (2004): 58-73.
- Vescovo, Victor. "The Atlas of World Statistics." Dallas: Caladan Press, 2005.
References
External links
- Cartogram Central
- Multiple cartograms showing the results of the 2008 U.S. presidential election
- Worldmapper collection of world cartograms
- Belgian cartograms
- Nonuniform coverage and cartograms
Categories:- Diagrams
- Statistical charts and diagrams


Wikimedia Foundation. 2010.