- Colorado's 3rd congressional district
-
"CO-3" redirects here. For the state highway, see Colorado State Highway 3.
Colorado's 3rd congressional district 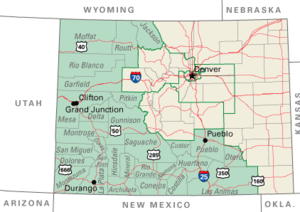
Current Representative Scott Tipton (R–Cortez) Area 54,100 mi² Distribution 61.0% urban, 39.0% rural Population (2000) 614,467 Median income $35,970 Ethnicity 74.6% White, 0.7% Black, 0.5% Asian, 21.5% Hispanic, 1.4% Native American, 0.1% other Cook PVI R+5 Colorado's 3rd congressional district is a congressional district in the U.S. state of Colorado. The district is located in western and south central Colorado, encompassing most of the rural Western Slope. It includes the cities of Grand Junction and Durango as well as southern portions of Colorado's eastern plains, including the city of Pueblo.
The district is currently represented by Republican Scott R. Tipton who defeated Democratic incumbent John Salazar in 2010.
History
1990s
Following the 1990 U.S. Census and associated realignment of Colorado congressional districts, the 3rd Congressional district consisted of Alamosa, Archuleta, Chaffee, Conejos, Costilla, Custer, Delta, Dolores, Eagle, Garfield, Grand, Gunnison, Hinsdale, Huerfano, Jackson, Lake, La Plata, Mesa, Mineral, Moffat, Montezuma, Montrose, Ouray, Park, Pitkin, Pueblo, Rio Blanco, Rio Grande, Routt, Saguache, San Juan, San Miguel and Summit counties, as well as portions of Douglas, Fremont, and Jefferson counties.
2000s
Following the 2000 U.S. Census and associated realignment of Colorado congressional districts, the 3rd Congressional district consisted of Alamosa, Archuleta, Conejos, Costilla, Custer, Delta, Dolores, Garfield, Gunnison, Hinsdale, Huerfano, Jackson, La Plata, Las Animas, Mesa, Mineral, Moffat, Montezuma, Montrose, Ouray, Pitkin, Pueblo, Rio Blanco, Rio Grande, Routt, Saguache, San Juan, and San Miguel counties and most of Otero County.
Characteristics
The district has two major population centers in Grand Junction and Pueblo. The two cities and their surrounding rural areas provide a competitive arena for congressional races. Grand Junction, on the Western Slope, provides a base for conservatism while Pueblo, a town with a large Latino population and (by Colorado norms) a heavily unionized workforce, provides a base of support for Democrats. George W. Bush received 55% of the vote in the district in 2004 while John McCain won the district in 2008 50%-47%.
Voting
Election results from presidential races[1]
Year Office Result 2000 President Bush 54% - Gore 39% 2004 President Bush 55% - Kerry 44% 2008 President McCain 50% - Obama 47% List of representatives
Representative Party Term Duration Congress District Home Electoral history District created March 4, 1915 Districts 3 and 4 were created
from the former at-large districtEdward Keating Democratic March 4, 1915 –
March 4, 191964th Pueblo First elected in 1912 (At-large district)
Lost re-election65th Guy Urban Hardy Republican March 4, 1919 –
March 4, 193366th Canon City First elected in 1918
Lost re-election67th 68th 69th 70th 71st 72nd John Andrew Martin Democratic March 4, 1933 –
December 23, 193973rd Pueblo First elected in 1932
Died74th 75th 76th Vacant December 23, 1939 –
November 5, 194076th William Evans Burney Democratic November 5, 1940 –
January 3, 194176th Pueblo Won special election to finish remaining term
Did not run as a candidate for a full term
in the 1940 general electionJohn Edgar Chenoweth Republican January 3, 1941–
January 3, 194977th Trinidad First elected in 1940
Lost re-election78th 79th 80th John Henry Marsalis Democratic January 3, 1949 –
January 3, 195181st Pueblo Elected in 1948
Lost re-electionJohn Edgar Chenoweth Republican January 3, 1951 –
January 3, 196582nd Trinidad Re-elected in 1950
Lost party re-nomination83rd 84th 85th 86th 87th 88th Frank E. Evans Democratic January 3, 1965 –
January 3, 197989th Beulah First elected in 1964
Retired90th 91st 92nd 93rd 94th 95th Ray Kogovsek Democratic January 3, 1979 –
January 3, 198596th Pueblo First elected in 1978
Retired97th 98th Mike Strang Republican January 3, 1985 –
January 3, 198799th Carbondale Elected in 1984
Lost re-election Ben Nighthorse Campbell
Democratic January 3, 1987 –
January 3, 1993100th First elected in 1986
Retired to run for U.S. Senate101st 102nd  Scott McInnis
Republican January 3, 1993 –
January 3, 2005103rd Glenwood Springs First elected in 1992
Retired104th 105th 106th 107th 108th 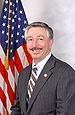 John Salazar
Democratic January 3, 2005 –
January 3, 2011109th Manassa First elected in 2004
Lost re-election110th 111th 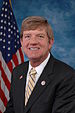 Scott Tipton
Republican January 3, 2011 –
Present112th Cortez Elected in 2010 Election results
1914 • 1916 • 1918 • 1920 • 1922 • 1924 • 1926 • 1928 • 1930 • 1932 • 1934 • 1936 • 1938 • 1940 (Special) • 1940 • 1942 • 1944 • 1946 • 1948 • 1950 • 1952 • 1954 • 1956 • 1958 • 1960 • 1962 • 1964 • 1966 • 1968 • 1970 • 1972 • 1974 • 1976 • 1978 • 1980 • 1982 • 1984 • 1986 • 1988 • 1990 • 1992 • 1994 • 1996 • 1998 • 2000 • 2002 • 2004 • 2006 • 2008 • 2010
1914
United States House of Representatives elections, 1914[2] Party Candidate Votes Percentage Democratic Edward Keating 37,191 53.31% Republican Neil N. McLean 32,567 46.69% Totals 69,758 100.0% Democratic win (new seat) 1916
United States House of Representatives elections, 1916[3] Party Candidate Votes Percentage Democratic Edward Keating (incumbent) 40,183 54.12% Republican George E. McClelland 31,137 41.93% Socialist David McGrew 2,492 3.36% Progressive William G. Francis 443 0.60% Totals 74,255 100.0% Democratic hold 1918
United States House of Representatives elections, 1918[4] Party Candidate Votes Percentage Republican Guy U. Hardy 31,715 50.95% Democratic Edward Keating (incumbent) 29,075 46.71% Socialist Edith Halcomb 1,453 2.33% Totals 62,243 100.0% Republican gain from Democratic 1920
United States House of Representatives elections, 1920[5] Party Candidate Votes Percentage Republican Guy U. Hardy (incumbent) 43,426 57.65% Democratic Samuel J. Burris 31,896 42.35% Totals 75,322 100.0% Republican hold 1922
United States House of Representatives elections, 1922[6] Party Candidate Votes Percentage Republican Guy U. Hardy (incumbent) 43,508 52.41% Democratic Chester B. Horn 39,500 47.59% Totals 83,008 100.0% Republican hold 1924
United States House of Representatives elections, 1924[7] Party Candidate Votes Percentage Republican Guy U. Hardy (incumbent) 53,877 58.66% Democratic Charles B. Hughes 37,976 41.34% Totals 91,853 100.0% Republican hold 1926
United States House of Representatives elections, 1926[8] Party Candidate Votes Percentage Republican Guy U. Hardy (incumbent) 46,916 53.97% Democratic Edmond I. Crockett 40,009 46.03% Totals 86,925 100.0% Republican hold 1928
United States House of Representatives elections, 1928[9] Party Candidate Votes Percentage Republican Guy U. Hardy (incumbent) 64,116 64.90% Democratic Harry A. McIntyre 34,670 35.10% Totals 98,786 100.0% Republican hold 1930
United States House of Representatives elections, 1930[10] Party Candidate Votes Percentage Republican Guy U. Hardy (incumbent) 55,170 60.68% Democratic Guy M. Weybright 35,744 39.32% Totals 90,914 100.0% Democratic hold 1932
United States House of Representatives elections, 1932[11] Party Candidate Votes Percentage Democratic John Andrew Martin 59,882 50.89% Republican Guy U. Hardy (incumbent) 57,793 49.11% Totals 117,675 100.0% Democratic gain from Republican 1934
United States House of Representatives elections, 1934[12] Party Candidate Votes Percentage Democratic John Andrew Martin (incumbent) 73,281 64.15% Republican W.O. Peterson 39,753 34.80% Socialist Joseph T. Landis 1,199 1.05% Totals 114,233 100.0% Democratic hold 1936
United States House of Representatives elections, 1936[13] Party Candidate Votes Percentage Democratic John Andrew Martin (incumbent) 74,013 60.23% Republican J. Arthur Phelps 48,871 39.77% Totals 122,884 100.0% Democratic hold 1938
United States House of Representatives elections, 1938[14] Party Candidate Votes Percentage Democratic John Andrew Martin (incumbent) 72,736 57.39% Republican Henry Leonard 54,007 42.61% Totals 126,743 100.0% Democratic hold 1940 (Special)
Colorado's 3rd congressional district special election, 1940[15] Party Candidate Votes Percentage Democratic William E. Burney 68,225 50.95% Republican Henry Leonard 65,675 49.05% Totals 133,900 100.0% Democratic hold 1940
United States House of Representatives elections, 1940[16] Party Candidate Votes Percentage Republican John Chenoweth 70,842 52.05% Democratic Byron G. Rogers 65,269 47.95% Totals 136,111 100.0% Republican gain from Democratic 1942
United States House of Representatives elections, 1942[17] Party Candidate Votes Percentage Republican John Chenoweth (incumbent) 55,838 62.75% Democratic J.C. Jarrett 33,154 37.25% Totals 88,992 100.0% Republican hold 1944
United States House of Representatives elections, 1944[18] Party Candidate Votes Percentage Republican John Chenoweth (incumbent) 69,492 56.32% Democratic Arthur M. Winnell 53,904 43.68% Totals 123,396 100.0% Republican hold 1946
United States House of Representatives elections, 1946[19] Party Candidate Votes Percentage Republican John Chenoweth (incumbent) 45,043 54.57% Democratic Walter Walford Johnson 37,496 45.43% Totals 82,539 100.0% Republican hold 1948
United States House of Representatives elections, 1948[20] Party Candidate Votes Percentage Democratic John H. Marsalis 65,114 50.70% Republican John Chenoweth (incumbent) 63,312 49.30% Totals 128,426 100.0% Democratic gain from Republican 1950
United States House of Representatives elections, 1950[21] Party Candidate Votes Percentage Republican John Chenoweth 58,831 51.63% Democratic John H. Marsalis (incumbent) 55,110 48.37% Totals 113,941 100.0% Republican gain from Democratic 1952
United States House of Representatives elections, 1952[22] Party Candidate Votes Percentage Republican John Chenoweth (incumbent) 84,739 57.74% Democratic John H. Marsalis 62,025 42.26% Totals 146,764 100.0% Republican hold 1954
United States House of Representatives elections, 1954[23] Party Candidate Votes Percentage Republican John Chenoweth (incumbent) 62,884 53.01% Democratic Alva B. Adams, Jr. 55,750 46.99% Totals 118,634 100.0% Republican hold 1956
United States House of Representatives elections, 1956[24] Party Candidate Votes Percentage Republican John Chenoweth (incumbent) 74,196 50.24% Democratic Alva B. Adams, Jr. 73,501 49.76% Totals 147,697 100.0% Republican hold 1958
United States House of Representatives elections, 1958[25] Party Candidate Votes Percentage Republican John Chenoweth (incumbent) 63,655 50.21% Democratic Fred M. Betz 63,112 49.79% Totals 126,767 100.0% Republican hold 1960
United States House of Representatives elections, 1960[26] Party Candidate Votes Percentage Republican John Chenoweth (incumbent) 85,825 52.05% Democratic Franklin R. Stewart 79,069 47.95% Totals 164,894 100.0% Republican hold 1962
United States House of Representatives elections, 1962[27] Party Candidate Votes Percentage Republican John Chenoweth (incumbent) 74,848 54.66% Democratic Albert "Al" Tomsic 62,097 45.34% Totals 136,945 100.0% Republican hold 1964
United States House of Representatives elections, 1964[28] Party Candidate Votes Percentage Democratic Frank E. Evans 85,404 51.16% Republican John Chenoweth (incumbent) 81,544 48.84% Totals 166,948 100.0% Democratic gain from Republican 1966
United States House of Representatives elections, 1966[29] Party Candidate Votes Percentage Democratic Frank E. Evans (incumbent) 76,270 51.71% Republican David W. Enoch 71,213 48.29% Totals 147,483 100.0% Democratic hold 1968
United States House of Representatives elections, 1968[30] Party Candidate Votes Percentage Democratic Frank E. Evans (incumbent) 88,368 52.13% Republican Paul Bradley 81,163 47.88% Totals 169,531 100.0% Democratic hold 1970
United States House of Representatives elections, 1970[31] Party Candidate Votes Percentage Democratic Frank E. Evans (incumbent) 87,000 63.65% Republican John "Jack" Mitchell, Jr. 45,610 33.37% Raza Unida Martin P. Serna 1,828 1.34% Peace Independent Walter Cranson 1,598 1.17% American Independent Henry John Olshaw 652 0.48% Totals 136,688 100.0% Democratic hold 1972
United States House of Representatives elections, 1972[32] Party Candidate Votes Percentage Democratic Frank E. Evans (incumbent) 107,511 66.34% Republican Chuck Brady 54,556 33.66% Totals 162,067 100.0% Democratic hold 1974
United States House of Representatives elections, 1974[33] Party Candidate Votes Percentage Democratic Frank E. Evans (incumbent) 91,783 67.95% Republican E. Keith Records 43,298 32.05% Totals 135,081 100.0% Democratic hold 1976
United States House of Representatives elections, 1976[34] Party Candidate Votes Percentage Democratic Frank E. Evans (incumbent) 89,302 50.96% Republican Melvin Takaki 82,315 46.98% Raza Unida Alfredo Archer 2,429 1.39% American Independent Henry John Olshaw 1,186 0.68% Totals 175,232 100.0% Democratic hold 1978
United States House of Representatives elections, 1978[35] Party Candidate Votes Percentage Democratic Raymond P. Kogovsek 69,669 49.26% Republican Harold L. McCormick 69,303 49.00% American Independent Henry John Olshaw 2,475 1.75% Totals 141,447 100.0% Democratic hold 1980
United States House of Representatives elections, 1980[36] Party Candidate Votes Percentage Democratic Raymond P. Kogovsek (incumbent) 105,820 54.89% Republican Harold L. McCormick 84,292 43.72% Libertarian James S. Glennie 2,670 1.39% Totals 192,782 100.0% Democratic hold 1982
United States House of Representatives elections, 1982[37] Party Candidate Votes Percentage Democratic Raymond P. Kogovsek (incumbent) 92,384 53.44% Republican Tom Wiena 77,409 44.77% Libertarian Paul "Stormy" Mohn 2,439 1.41% Independent Henry John Olshaw 656 0.38% Totals 172,888 100.0% Democratic hold 1984
United States House of Representatives elections, 1984[38] Party Candidate Votes Percentage Republican Michael L. Strang 122,669 56.83% Democratic W. Mitchell 90,963 42.14% Libertarian Robert Jahelka 1,358 0.63% Independent Henry John Olshaw 880 0.41% Totals 215,870 100.0% Republican gain from Democratic 1986
United States House of Representatives elections, 1986[39] Party Candidate Votes Percentage Democratic Ben Nighthorse Campbell 95,353 51.86% Republican Michael L. Strang (incumbent) 88,508 48.14% Totals 183,861 100.0% Democratic gain from Republican 1988
United States House of Representatives elections, 1988[40] Party Candidate Votes Percentage Democratic Ben Nighthorse Campbell (incumbent) 169,284 78.04% Republican Jim Zartman 47,625 21.96% Totals 216,909 100.0% Democratic hold 1990
United States House of Representatives elections, 1990[41] Party Candidate Votes Percentage Democratic Ben Nighthorse Campbell (incumbent) 124,487 70.21% Republican Bob Ellis 49,961 28.18% Populist ('84-'96) Howard E. Fields 2,859 1.61% Totals 177,307 100.0% Democratic hold 1992
United States House of Representatives elections, 1992[42] Party Candidate Votes Percentage Republican Scott McInnis 143,293 54.70% Democratic Mike Callihan 114,480 43.70% Populist ('84-'96) Ki R. Nelson 4,189 1.60% Totals 261,962 100.0% Republican gain from Democratic 1994
United States House of Representatives elections, 1994[43] Party Candidate Votes Percentage Republican Scott McInnis (incumbent) 145,365 69.62% Democratic Linda Powers 63,427 30.38% Totals 208,792 100.0% Republican hold 1996
United States House of Representatives elections, 1996[44] Party Candidate Votes Percentage Republican Scott McInnis (incumbent) 183,523 68.87% Democratic Albert Gurule 82,953 31.13% Totals 266,476 100.0% Republican hold 1998
United States House of Representatives elections, 1998[45] Party Candidate Votes Percentage Republican Scott McInnis (incumbent) 156,501 66.13% Democratic Robert Reed Kelley 74,479 31.47% Libertarian Barry Baggert 5,673 2.40% Totals 236,653 100.0% Republican hold 2000
United States House of Representatives elections, 2000[46] Party Candidate Votes Percentage Republican Scott McInnis (incumbent) 199,204 65.84% Democratic Curtis Imrie 87,921 29.06% Libertarian Drew Sakson 9,982 3.30% Reform Victor A. Good 5,433 1.80% Totals 302,540 100.0% Republican hold 2002
United States House of Representatives elections, 2002[47] Party Candidate Votes Percentage Republican Scott McInnis (incumbent) 143,433 65.80% Democratic Dennis Berckefeldt 68,160 31.27% Libertarian J. Brent Shroyer 4,370 2.01% Natural Law Gary W. Swing 1,903 0.87% Write-in Jason Alessio 106 0.05% Totals 217,972 100.0% Republican hold 2004
United States House of Representatives elections, 2004[48] Party Candidate Votes Percentage Democratic John Salazar 153,500 50.55% Republican Greg Walcher 141,376 46.56% Unaffiliated Jim Krug 8,770 2.89% Totals 303,646 100.0% Democratic gain from Republican 2006
United States House of Representatives elections, 2006[49] Party Candidate Votes Percentage Democratic John Salazar (incumbent) 146,488 61.59% Republican Scott Tipton 86,930 36.55% Libertarian Bert L. Sargent 4,417 1.86% Green Bruce E. Lohmiller (as a write-in) 23 0.01% Totals 237,858 100.0% Democratic hold 2008
United States House of Representatives elections, 2008[50] Party Candidate Votes Percentage Democratic John Salazar (incumbent) 203,457 61.61% Republican Wayne Wolf 126,762 38.39% Totals 330,219 100.0% Democratic hold 2010
United States House of Representatives elections, 2010[51] Party Candidate Votes Percentage Republican Scott Tipton 129,257 50.10% Democratic John Salazar (incumbent) 118,048 45.76% Libertarian Gregory Gilman 5,678 2.20% Unaffiliated Jake Segrest 4,982 1.93% Write-in John W. Hargis, Sr. 23 0.01% Write-in Jim Fritz 11 0.00% Totals 257,999 100.0% Republican gain from Democratic References
- Martis, Kenneth C. (1989). The Historical Atlas of Political Parties in the United States Congress. New York: Macmillan Publishing Company.
- Martis, Kenneth C. (1982). The Historical Atlas of United States Congressional Districts. New York: Macmillan Publishing Company.
- Congressional Biographical Directory of the United States 1774–present
- ^ Presidential Election Results, by district, swingstateproject.com
- ^ 1914 Election Results
- ^ 1916 Election Results
- ^ 1918 Election Results
- ^ 1920 Election Results
- ^ 1922 Election Results
- ^ 1924 Election Results
- ^ 1926 Election Results
- ^ 1928 Election Results
- ^ 1930 Election Results
- ^ 1932 Election Results
- ^ 1934 Election Results
- ^ 1936 Election Results
- ^ 1938 Election Results
- ^ 1940 Special Election Results
- ^ 1940 Election Results
- ^ 1942 Election Results
- ^ 1944 Election Results
- ^ 1946 Election Results
- ^ 1948 Election Results
- ^ 1950 Election Results
- ^ 1952 Election Results
- ^ 1954 Election Results
- ^ 1956 Election Results
- ^ 1958 Election Results
- ^ 1960 Election Results
- ^ 1962 Election Results
- ^ 1964 Election Results
- ^ 1966 Election Results
- ^ 1968 Election Results
- ^ 1970 Election Results
- ^ 1972 Election Results
- ^ 1974 Election Results
- ^ 1976 Election Results
- ^ 1978 Election Results
- ^ 1980 Election Results
- ^ 1982 Election Results
- ^ 1984 Election Results
- ^ 1986 Election Results
- ^ 1988 Election Results
- ^ 1990 Election Results
- ^ 1992 Election Results
- ^ 1994 Election Results
- ^ 1996 Election Results
- ^ 1998 Election Results
- ^ 2000 Election Results
- ^ 2002 Election Results
- ^ 2004 Election Results
- ^ 2006 Election Results
- ^ 2008 Election Results
- ^ 2010 Election Results
Colorado's congressional districts All districts: Territory At-large 1 2 3 4 5 6 7
See also: Colorado's past & present Representatives, Senators, and Delegations, 2010 elections, 2012 elections
All U.S. districts – Apportionment – Redistricting – Gerrymandering – MapsCategories:- Congressional districts of Colorado
- Colorado Western Slope
- San Luis Valley of Colorado


Wikimedia Foundation. 2010.