- Demographics of Ukraine
-
Demographics of Ukraine 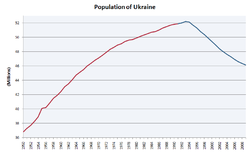
Population of Ukraine (in millions) from 1950-2010.Population: 45,778,500 (1 January 2011) Growth rate: -4.4 people/1,000 population (2010) Birth rate: 10.8 births/1,000 population (2010) Death rate: 15.2 deaths/1,000 population (2010) Life expectancy: 68.08 years (2008 est.) –male: 62.24 years –female: 74.24 years Fertility rate: 1.25 children born/woman (2008 est.) Infant mortality rate: 9.1 deaths/1,000 infants (2010) Net migration rate: 0.3 migrant(s)/1,000 population (2008) Age structure: 0-14 years: 13.9% (male 3,277,905/female 3,106,012) 15-64 years: 70% (male 15,443,818/female 16,767,931) 65-over: 16.1% (male 2,489,235/female 4,909,386) (2008 est.) Sex ratio: At birth: 1.06 male(s)/female Under 15: 1.06 male(s)/female 15-64 years: 0.92 male(s)/female 65-over: 0.51 male(s)/female Nationality: Nationality: noun: Ukrainian(s) adjective: Ukrainian Major ethnic: Ukrainians (77.8%) Minor ethnic: Russians (17.3%) Language: Official: Ukrainian Spoken: Russian, Ukrainian, others The Demographics of Ukraine is about the demographic features of the population of Ukraine, including population growth, population density, ethnicity, education level, health, economic status, religious affiliations, and other aspects of the population.
The data in this article are based on the most recent Ukrainian Census, which was carried out in 2001,[1] the CIA World Factbook, and the State Statistics Committee of Ukraine.
Contents
Historical Data
Historical populations Year Pop. ±% 1897 23,430,407 — 1905 30,837,300 +31.6% 1926 26,020,300 −15.6% 1931[2] 23,263,000 −10.6% 1939 40,469,000 +74.0% 1959[3] 41,869,046 +3.5% 1965 45,132,800 +7.8% 1970 47,126,517 +4.4% 1975 48,880,500 +3.7% 1979 49,609,333 +1.5% 1984 50,678,600 +2.2% 1989 51,452,034 +1.5% 1995 51,728,400 +0.5% 2001 48,457,100 −6.3% 2003 47,956,500 −1.0% 2004 47,576,831 −0.8% 2005 47,242,900 −0.7% 2006 46,886,356 −0.8% 2007 46,614,828 −0.6% 2008 46,337,340 −0.6% 2009 46,115,941 −0.5% 2010 45,939,820 −0.4% 2011[4] 45,778,500 −0.4% See also: Polish census of 1931, First All-Union Census of the Soviet Union, Soviet Census (1937), Soviet Census (1989), and Ukrainian Census (2001)The historical information is taken out of Demoscope.ru. Please, note that territory of the modern Ukraine at the times listed above varied greatly. The western regions of Ukraine, west of Zbruch river, until 1939 for most of time were part of the Kingdom Galicia and later the Polish Republic. The detailed information for those territories is missing, for more information see Demographics of Poland. The Crimean peninsula was changing hands as well, in 1897 it was a part of the Taurida Governorate, but after the October Revolution became part of the Russian SFSR, and later was turned under the administration of the Ukrainian SSR. The territory of Budjak (southern Bessarabia) became a part of the Ukrainian SSR in June 1940. The censuses of 1926 through 1989 were taken in the Ukrainian SSR. The census of 1897 is taken with the correspondence to nine gubernias that included in the territory of today's Ukraine. The statistics of 1905 records are taken from www.statoids.com which provides a broad degree of historical explanation on the situation in the Imperial Russia. The census statistics of 1931 was estimated by the professor Zenon Kuzela (1882–1952)[5] from Berlin. His calculations are as of January 1, 1931. This ethnograph is mentioned in the encyclopedia of Ukraine as one of the sources only available due to lack of the official census.[6][7] The 2001 census was the first official census of the independent republic of Ukraine. Its data is given as on January 1. The 2003-2009 stats were taken from the official web-site of www.ukrstat.gov.ua and represent the data as of February of each year for the real population.
Ethnic Groups
Before WW II
Population of the Ukrainian SSR according to ethnic group 1926–1939 Ethnic
groupcensus 19261 census 19392 Number % Number % Ukrainians 23,218,860 80.0 23,667,509 76.5 Russians 2,677,166 9.2 4,175,299 13.5 Jews 1,574,428 5.4 1,532,776 5.0 Germans 393,924 1.4 392,458 1.3 Poles 476,435 1.6 357,710 1.2 Moldavians 257,794 0.9 230,698 0.8 Belarusians 75,842 0.3 158,174 0.5 Greeks 104,666 0.4 107,047 0.4 Bulgarians 99,278 0.3 83,838 0.3 Tatars 22,281 0.1 55,456 0.2 Roma 13,578 0.0 10,443 0.0 Others 103,935 0.4 174,810 0.6 Total 29,018,187 30,946,218 1 Source: [4]. 2 Source: [5]. After WW II
 National structure of the population of Ukraine (2001).
UkrainiansRussiansOthersUkrainian 77.8%, Russian 17.3%, Romanian 0.8% (including Moldovan 0.5%), Belarusian 0.6%, Crimean Tatar 0.5%, Bulgarian 0.4%, Hungarian 0.3%, Polish 0.3%, Jewish 0.2%, Greeks 0.2% and other 1.6% (including Muslim Bulgarians, otherwise known as Torbesh, old communities of Armenians living on the Sea of Azov, and a microcosm of Gotlander Swedes of Gammalsvenskby).[8]
 Ethnic Ukrainians in Ukraine by oblast (2008)
Population of Ukraine according to ethnic group 1959-2001 Ethnic
groupcensus 19591 census 19702 census 19793 census 19894 census 20015 Number % Number % Number % Number % Number % Ukrainians 32,158,493 76.8 35,283,857 74.9 36,488,951 73.6 37,419,053 72.7 37,451,693 77.5 Russians 7,090,813 16.9 9,126,331 19.4 10,471,602 21.1 11,355,582 22.1 8,334,141 17.2 Belarusians 290,890 0.7 385,847 0.8 406,098 0.8 440,045 0.9 275,763 0.6 Moldavians 241,650 0.6 265,902 0.6 293,576 0.6 324,525 0.6 258,619 0.5 Crimean Tatars 193 0.0 3,554 0.0 6,636 0.0 46,807 0.1 248,193 0.5 Bulgarians 219,419 0.5 234,390 0.5 238,217 0.5 233,800 0.5 204,574 0.4 Hungarians 149,229 0.4 157,731 0.3 164,373 0.3 163,111 0.3 156,566 0.3 Romanians 100,863 0.2 112,141 0.2 121,795 0.3 134,825 0.3 150,989 0.3 Poles 363,297 0.9 295,107 0.6 258,309 0.5 219,179 0.4 144,130 0.3 Jews 840,311 2.0 777,126 1.7 634,154 1.3 486,628 1.0 103,591 0.2 Armenians 28,024 0.1 33,439 0.1 38,646 0.1 54,200 0.1 99,894 0.2 Greeks 104,359 0.3 106,909 0.2 104,091 0.2 98,594 0.2 91,548 0.2 Tatars 61,334 0.2 72,658 0.2 83,906 0.2 86,875 0.2 73,304 0.2 Romani 22,515 0.1 30,091 0.1 34,411 0.1 47,917 0.1 47,587 0.1 Azerbaijanis 6,680 0.0 10,769 0.0 17,235 0.0 36,961 0.1 45,176 0.1 Georgians 11,574 0.0 14,650 0.0 16,301 0.0 23,540 0.1 34,199 0.1 Germans 23,243 0.1 29,871 0.1 34,139 0.1 37,849 0.1 33,302 0.1 Gagauzs 23,530 0.1 26,464 0.1 29,398 0.1 31,967 0.1 31,923 0.1 Karaites 3,301 0.0 2,596 0.0 1,845 0.0 1,404 0.0 1,196 0.0 Others 129,338 0.3 157,084 0.3 165,650 0.3 209,172 0.4 539,604 1.1 Total 41,869,046 47,126,517 49,609,333 51,452,034 48,416,000 1 Source: [6]. 2 Source: [7]. 3 Source: [8]. 4 Source: [9]. 5 Source: [10]. 
Vital statistics [9][10]
 Population change, 1970 - 1979
 Population change, 1970 - 2010
 Population change, 1989 - 2001
 Population change, 1989 - 2010
 Population change of urban settlements, 1970 - 1989
 Population change of urban settlements, 1989 - 2010
Average population (x 1000) Live births Deaths1 Natural change Crude birth rate (per 1000) Crude death rate (per 1000) Natural change (per 1000) 1946 753 493 1947 712 994 1948 757 783 1949 911 641 1950 36 905 844 585 314 000 530 585 22.8 8.5 14.3 1951 37 569 858 052 321 000 529 000 22.8 8.6 14.2 1952 38 141 846 434 318 000 523 000 22.2 8.4 13.8 1953 38 678 795 652 315 000 476 000 20.6 8.2 12.4 1954 39 131 845 128 316 000 526 000 21.6 8.1 13.5 1955 39 506 792 696 297 000 499 000 20.1 7.5 12.6 1956 40 082 822 569 289 000 535 000 20.5 7.2 13.3 1957 40 800 847 781 302 000 548 000 20.8 7.4 13.4 1958 41 512 873 483 286 000 587 500 21.0 6.9 14.2 1959 42 155 880 552 308 000 572 600 20.9 7.3 13.6 1960 42 469 878 768 296 171 582 597 20.7 7.0 13.7 1961 43 097 843 482 304 346 539 136 19.6 7.1 12.5 1962 43 559 823 151 331 454 491 697 18.9 7.6 11.3 1963 44 088 794 969 323 556 471 413 17.9 7.3 10.6 1964 44 664 741 668 315 340 426 328 16.5 7.0 9.5 1965 45 133 692 153 342 717 349 436 15.3 7.6 7.7 1966 45 548 713 492 344 850 368 642 15.6 7.5 8.1 1967 45 997 699 381 368 573 330 808 15.1 8.0 7.2 1968 46 408 693 064 374 440 318 624 14.9 8.0 6.8 1969 46 778 687 991 404 151 283 840 14.7 8.6 6.0 1970 47 127 719 213 418 679 300 534 15.2 8.9 6.4 1971 47 507 736 691 424 717 311 974 15.4 8.9 6.5 1972 47 903 745 696 443 038 302 658 15.5 9.2 6.3 1973 48 274 719 560 449 351 270 209 14.9 9.3 5.6 1974 48 571 736 616 455 970 280 646 15.1 9.4 5.8 1975 48 881 738 857 489 550 249 307 15.1 10.0 5.1 1976 49 151 747 069 500 584 246 485 15.2 10.2 5.0 1977 49 388 726 217 517 967 208 250 14.7 10.5 4.2 1978 49 578 732 187 529 681 202 506 14.7 10.7 4.1 1979 49 755 735 188 552 019 183 169 14.7 11.1 3.7 1980 50 044 742 489 568 243 174 246 14.8 11.4 3.5 1981 50 222 733 183 568 789 164 394 14.6 11.3 3.3 1982 50 388 745 591 568 231 177 360 14.8 11.3 3.5 1983 50 573 807 111 583 496 223 615 16.0 11.6 4.4 1984 50 768 792 035 610 338 181 697 15.6 12.0 3.6 1985 50 941 762 775 617 548 145 227 15.0 12.1 2.9 1986 51 143 792 574 565 150 227 424 15.5 11.1 4.4 1987 51 373 760 851 586 387 174 464 14.8 11.4 3.4 1988 51 593 744 056 600 725 143 331 14.4 11.6 2.8 1989 51 770 690 981 600 590 90 391 13.3 11.6 1.7 1990 51 891 657 202 629 602 27 600 12.7 12.1 0.5 1991 52 001 630 813 669 960 -39 147 12.1 12.9 -0.8 1992 52 151 596 785 697 110 -100 325 11.4 13.4 -1.9 1993 52 179 557 467 741 662 -184 195 10.7 14.2 -3.5 1994 51 921 521 545 764 669 -243 124 10.0 14.7 -4.7 1995 51 513 492 861 792 587 -299 726 9.6 15.4 -5.8 1996 51 058 467 211 776 717 -309 506 9.2 15.2 -6.1 1997 50 594 442 581 754 151 -311 570 8.7 14.9 -6.2 1998 50 144 419 238 719 954 -300 716 8.4 14.4 -6.0 1999 49 674 389 208 739 170 -349 962 7.8 14.9 -7.0 2000 49 177 385 126 758 082 -372 956 7.8 15.4 -7.6 2001 48 663 376 479 745 953 -369 474 7.7 15.3 -7.6 2002 48 203 390 687 754 911 -364 224 8.1 15.7 -7.6 2003 47 813 408 591 765 408 -356 817 8.5 16.0 -7.5 2004 47 452 427 259 761 263 -334 004 9.0 16.0 -7.0 2005 47 106 426 085 781 964 -355 879 9.0 16.6 -7.6 2006 46 788 460 368 758 093 -297 725 9.8 16.2 -6.4 2007 46 510 472 657 762 877 -290 220 10.2 16.4 -6.2 2008 46 258 510 588 754 462 -243 874 11.0 16.3 -5.3 2009 46 053 512 526 706 740 -194 214 11.1 15.3 -4.2 2010 45 871 497 689 698 235 -200 546 10.8 15.2 -4.4 1 Deaths 1950-1959 are estimates Demographic statistics
Population
45,724,242 (April 1, 2011)[14]
Age structure
- 0–14 years: 13.9% (male 3,277,905/female 3,106,012)
- 15–64 years: 70% (male 15,443,818/female 16,767,931)
- 65 years and over: 16.1% (male 2,489,235/female 4,909,386) (2008 est.)
Median age
- total: 39.4 years
- male: 36.1 years
- female: 42.5 years (2008 est.)
Net migration rate
0.3 migrant(s)/1,002 population (2008)[15]
Sex ratio
- at birth: 1.06 male(s)/female
- under 15 years: 1.06 male(s)/female
- 15–64 years: 0.92 male(s)/female
- 65 years and over: 0.51 male(s)/female
- total population: 0.8375 male(s)/female (2008 est.)
Infant mortality rate
- 9.1 deaths/1,000 infants (2010)[16]
Life expectancy at birth
- total population: 68.06 years
- male: 62.24 years
- female: 74.24 years (2008 est.)
Total fertility rate
1.27 children born/woman (2010 est.)
HIV/AIDS
Main article: HIV/AIDS in Ukraineadult prevalence rate 1.46% (2006 est.)[17]
people living with HIV/AIDS 377,600 (2006 est.)[17]
deaths 20,000 (2003 est.)
Nationality
- noun: Ukrainian(s)
- adjective: Ukrainian
Religions
Ukrainian Orthodox Church - Kiev Patriarchy 39.8%, Ukrainian Orthodox Church (Moscow Patriarchate) 29.4%, Ukrainian Greek Catholic Church 14.1%, Ukrainian Autocephalous Orthodox Church 2.8%, Roman Catholic 1.7%, Protestant 2.4%, Islam 0.6%, Jewish 0.2%, other 2% (2008 est.)[18]
Languages
Main article: Languages of UkraineUkrainian 67%, Russian 30%, Crimean Tatar, Bulgarian-, Romanian-, Polish-, Hungarian-, Rusyn-speaking minorities and small remnants of a Yiddish speaking group among the local Jews. The below table gives the total population of various ethnic groups in Ukraine and the primary language, according to the 2000 census.[8]
Group Pop Native Ukrainian Russian Other Ukrainians 37541693 31970728 x 5544729 532 Russians 8334141 7993832 328152 x 402 Belarusians 275763 54573 48202 172251 x Moldavians 258619 181124 27775 45607 22 Crimean Tatars 248193 228373 184 15208 43 Bulgarians 204574 131237 10277 62067 9 Hungarians 156566 149431 5367 1513 14 Romanians 150989 138522 9367 2297 4 Poles 144130 18660 102268 22495 390 Jews 103591 3213 13924 85964 16 Armenians 99894 50363 5798 43105 11 Greeks 91548 5829 4359 80992 9 Tatars 73304 25770 3310 43060 6 Roma people (Gypsies) 47587 21266 10039 6378 6 Azerbaijanis 45176 23958 3224 16968 36 Georgians 34199 12539 2818 18589 15 Germans 33302 4056 7360 21549 20 Gagauzs 31923 22822 1102 7232 2 Koreans 12711 2223 700 9662 0 Uzbeks 12353 3604 1818 5996 0 Chuvash 10593 2268 564 7636 1 Mordvinians 9331 1473 646 7168 0 Turks 8844 7923 133 567 0 Lithuanians 7207 1932 1029 4182 4 Arabs 6575 4071 897 1235 0 Slovaks 6397 2633 2665 335 0 Czechs 5917 1190 2503 2144 2 Kazakhs 5526 1041 822 3470 11 Latvians 5079 957 872 3188 1 Ossetians 4834 1150 401 3110 4 Udmurts 4712 729 380 3515 0 Lezghinians 4349 1507 330 2341 4 Tadjiks 4255 1521 488 1983 0 Bashkirs 4253 843 336 2920 0 Mari people 4130 1059 264 2758 7 Thai 3850 3641 29 164 0 Turkmens 3709 719 1079 1392 0 Albanians 3308 1740 301 1181 0 Assyrians 3143 883 408 1730 0 Chechens 2877 1581 212 977 0 Estonians 2868 416 321 2107 4 Chinese people 2213 1817 73 307 0 Kurds 2088 1173 236 396 0 Darghins 1610 409 199 955 0 Komis 1545 330 127 1046 0 Karelians 1522 96 145 1244 1 Avars 1496 582 121 761 0 Indo-Pakistanis 1483 1092 26 192 0 Abkhazians 1458 317 268 797 0 Karaites 1196 72 160 931 0 Komi-Permians 1165 160 79 898 1 Kyrgyz people 1128 208 221 617 19 Laks 1019 199 271 514 13 Afghanis 1008 551 60 213 0 other 3228 1027 144 790 0 NA 188639 0 1108 1844 1 Literacy
- definition: age 15 and over can read and write
- total population: 99.3%
- male: 99.7%
- female: 99.2% (2001 census)
Regional Differences
Regional Differences in Population Change
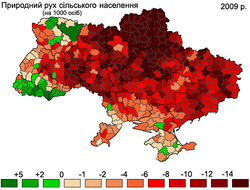
 Natural population growth rates by oblast (2009)
Between the Soviet census of 1989 and the Ukrainian census of 2001, Ukraine's population declined from 51,706,600 to 48,457,020,[19] a loss of 2,926,700 people or 5.7% of the 1989 population. However, this trend has been quite uneven and varied regionally. Two regions in western Ukraine — Rivne and Zakarpattia, saw slight population increases of .3% and .5% respectively. A third western Ukrainian region, Volyn, lost less than .1% of its population between 1989 and 2001.[19] Collectively, between 1989 and 2001 the seven westernmost regions of Ukraine lost 167,500 people or 1.7% of their 1989 population. The total population of these regions in 2001 was 9,593,800.[19]
Between 1989 and 2001, the population of Kiev City increased by .3% [19] due to positive net-migration.[citation needed] Outside the capital, the central, southern and eastern regions experienced a severe decline in population. Between 1989 and 2001, the Donetsk region lost 491,300 people or 9.2% of its 1989 population, and neighbouring Luhansk region lost 11% of its population.[19] Chernihiv region, in central Ukraine northeast of Kiev, lost 170,600 people or 12% of its 1989 population, the highest percentage loss in of any region in Ukraine. In southern Ukraine, Odessa region lost 173,600 people, or 6.6% of its 1989 population. By 2001, Crimea's population declined by 29,900 people, representing only 1.4% of the 1989 population.[19] However, this was due to the influx of approximately 200,000 Crimean Tatars – a number equivalent to approximately 10% of Crimea's 1989 population - who arrived in Crimea after 1989 and whose population in that region increased by a factor of 6.4 from 38,000 to 243,400 between 1989 and 2001.[20] Collectively, the net population loss in the regions of Ukraine outside the westernmost regions was 2,759,200 people or 6.6% of the 1989 population. The total population of these regions in 2001 was 39,186,100.[19]
Thus, from 1989–2001 the pattern of population change was one of slight growth in Kiev, slight declines in western Ukraine, large declines in eastern, central and southern Ukraine and slight decline in Crimea due to a large influx of Crimean tatars.
Natural population growth 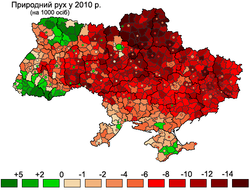
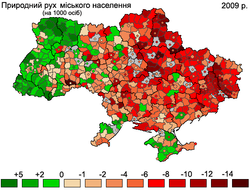
All population, 2010 Urban population, 2009 Rural population, 2009 Regional Differences in Birth and Fertility Rates
 Birth rate in Ukraine, 2003
 Birth rate in Ukraine, 2010
Ukraine's total fertility rate is one of the lowest in Europe.[21][22] However, significant regional differences in birth rates may account for some of the demographic differences. In the third quarter of 2007, for instance, the highest birth rate among Ukrainian regions occurred in Volyn Oblast, with a birth rate of 13.4/1,000 people, compared to the Ukrainian country-wide average of 9.6/1,000 people.[23] Volyn's birthrate is higher than the average birth rate of any European country with the exceptions of Iceland and Albania.[24] In 2007, for the first time since 1990, five Ukrainian regions (Zakarpattia Oblast, Rivne Oblast, Volyn Oblast, Lviv Oblast, and Kiev Oblast) experienced more births than deaths.[25] This demonstrates a positive trend of increasing birthrates in the last couple of years throughout Ukraine. The ratio of births to deaths in those regions in 2007 was 119%, 117%, 110%, 100.7%, and 108%, respectively.[25] With the exception of Kiev region, all of the regions with more births than deaths were in the less industrially developed regions of western Ukraine. According to a spokesperson for Ukraine's Ministry of Justice, the overall ratio of births to deaths in Ukraine had improved from 1 to 1.7 in 2004-2005 to 1 to 1.4 in 2008. However, the worst birth to death ratios in the country were in the eastern and central oblasts of Donetsk, Luhansk, Cherkasy and Poltava. In these regions, for every birth there were 2.1 deaths.[26]
Abortion behavior in the North, South, East and Center regions of Ukraine are relatively homogeneous while the Western region differs greatly. Overall, the abortion rate in western Ukraine is three times lower than in other regions; however this is not due to an increased use of modern contraceptive methods in the West, but simply due to the fact that pregnant women in the Western regions are more likely to keep their babies.[27] Donetsk and Dniproptrovsk oblasts in eastern and central Ukraine have the country's highest rate of abortions.[28]
Regional Differences and Death Rates and Health
 Death rate in Ukraine 2010
Death rates also vary widely by region; Eastern and southern Ukraine have the highest death rates in the country, and the life expectancy for children born in Chernigov, Dnepropetrovsk, Donetsk, Kherson, Kirovograd, Lugansk, Nikolaev, and Odessa regions is 1.5 years lower than the national average.[29] Ukraine had a suicide rate of 29.6 per 100,000 population in 1998, a significant increase from the suicide rate of 19 per 100,000 in 1988. Suicides are more frequent in the industrially developed regions and in the rural areas of the country than in the cities; In western Ukraine, the suicide rate was lower than the national average at 11.1 per 100,000.[30]
The Southern and eastern Ukrainian regions also suffer from the highest rates of HIV and AIDS, which impacts life expectancy. In late 2000, 60% of all AIDS cases in Ukraine were concentrated in the Odessa, Dnipropetrovsk, and Donetsk regions.[31] A major reason for this is the fact that the urbanized and industrialized regions in the East and South of Ukraine suffered most from the economic crisis in the 90s, which in turn led to the spread of unemployment, alcoholism, and drug abuse, thus setting the conditions for wider spread of the epidemic.[32]
Regional Differences in Income
In terms of income, the rural western and central regions of Ukraine are the poorest while Kiev and the industrialized eastern regions of Ukraine are the wealthiest. In December 2010 the average monthly income in Ukraine was 2629 hryvnias. The poorest regions in Ukraine, Volyn and Chernihiv, had monthly incomes of 1995 and 1951 hryvnias, respectively. In contrast, the monthly income in the city of Kiev was 4174 hryvnias per month, the city of Sevastopol 2712 hryvnias per month, and in Kiev region was 2647 per month. Outside of the capital and the city of Sevastopol, the wealthiest regions were Donetsk and Luhansk, whose monthly incomes were 2654 and 2631 hryvnias per month, respectively.[33]
In terms of poverty rates, the western and southern regions of Ukraine (particularly rural areas within those regions) have the country's highest poverty rates while Ukraine's eastern regions have the lowest poverty rates. In 2001, 39 percent of Ukraine's population could be defined as poor when the World Bank's poverty threshold of a dollar per day per capita was used. According to these standards, 49 percent of rural western Ukrainians and 45 percent of urban western Ukrainians were poor. In southern Ukraine, the percentages of poor were 51 and 40 percent, respectively. In contrast, 35% of urban and rural Ukrainians were poor based on per capita income less than one dollar per day in the regions of Eastern Ukraine. When povery was measured according to the percentage of the population who spent 80% or more of their income on food, regional differences shrank somewhat. In the western regions of Ukraine, 28 percent of rural residents and 9 percent of urban residents spent 80% of their income or more on food. In Ukraine's eastern regions, 19 percent of rural and 11 percent of urban residents spent 80% or more of their income on food.[34]
Urbanization
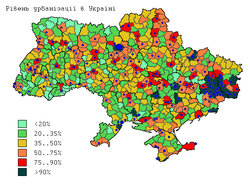
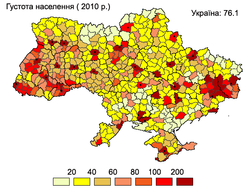
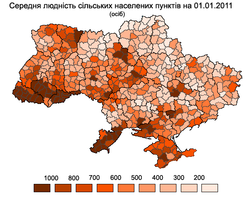
Urbabization rate, 2011 Population density, 2011 Medium population of rural settlements, 2011 Migration
Ukraine is the major source of migrants in many of the European Union Member States. During the 1990s and early 2000s, Ukraine's sputtering economy and political instability contributed to rising emigration, especially to nearby Poland and Hungary, but also to other States such as Italy, Portugal, Spain, Turkey, Israel, Russia and Canada. Although estimates vary, approximately two to three million Ukrainian citizens are currently working abroad, most of them illegally, in construction, service, housekeeping, and agriculture industries.
Between 1991 and 2004, the government counted 2,537,400 individuals who emigrated; 1,897,500 moved to other post-Soviet states, and 639,900 moved to other, mainly Western, states.[35]
By the early 2000s, Ukrainian embassies reported that 300,000 Ukrainian citizens were working in Poland, 200,000 in Italy, approximately 200,000 in the Czech Republic, 150,000 in Portugal, 100,000 in Spain, 35,000 in Turkey, 20,000 in the United States and small significant numbers in Austria, Belgium, France, Germany, Greece, Sweden, Switzerland and the UK. The largest number of Ukrainian workers abroad, about one million, are in the Russian Federation. Since 1992, 232,072 persons born in Ukraine have emigrated to the US.
From the point of view of the economic impact on natives, more appropriate than the absolute numbers is the volume of immigration as a proportion of the native population. Portugal and the Czech Republic have the highest rate of Ukrainian emigrants as a proportion of the native population.
See also
- Health in Ukraine
- Aging of Europe
- Demographic history of Crimea
- Ethnic groups in Ukraine
References
- ^ Population census of Ukraine, 2001
- ^ The Ukrainian Weekly of November 4, 1933
- ^ Demoscope
- ^ [1]
- ^ Brief description of Zenon Kuzela (Kuzelya) (English)
- ^ Ukraine: A Concise Encyclopedia Vol. 1, Book by Volodymyr Kubiyovych; University of Toronto Press, 1963
- ^ Posted availability of the book
- ^ a b Population census 2001: Population by nationality
- ^ [2] United Nations. Demographic Yearbooks
- ^ [3] State Statistics Committee of Ukraine
- ^ Ukrainian death rates 1950-2008 Demoscope Retrieved on 12-14-09
- ^ Ukrainian birth rates 1950-2008 Demoscope Retrieved on 12-14-09, 2009
- ^ State Statistics Committee of Ukraine Retrieved on 12-14-09
- ^ State Statistics Committee of Ukraine - Total population, as of April 1, 2011. Average annual populations January – March 2011 Retrieved on May 20, 2011
- ^ State Statistics Committee of Ukraine - Migration Retrieved on March 26, 2009
- ^ State Statistics Committee of Ukraine - Natural increase in population in 2010 Retrieved on May 20, 2011
- ^ a b UNAIDS Eastern Europe 2008 report Retrieved on September 6, 2008
- ^ Опитування: Віруючим якої церкви, конфесії Ви себе вважаєте?
- ^ a b c d e f g All-Ukrainian Population Census 2001
- ^ About number and composition population of Autonomous Republic of Crimea by data All-Ukrainian population census
- ^ Рождаемость в Украине самая низкая в Европе, Demoscope.ru, April 16–29, 2007 (Russian)
- ^ United Nations Department of Economic and Social Affairs, Population Division (2007). "United Nations World Population Prospects: 2006 revision, Table A.15". New York: UN. http://www.un.org/esa/population/publications/wpp2006/WPP2006_Highlights_rev.pdf. Retrieved 26 September 2010.
- ^ MIGnews: Volyn Region – Fertility Leader in Ukraine, 10 Oct 2007. Retrieved 19 Oct 2007.
- ^ CIA world factbook.
- ^ a b Ukrainian News: Birth Rate Exceeds Death Rate in Five Regions of Ukraine First Since 1990s 4th Oct 2007. Retrieved 19 Oct 2007.
- ^ Innas Filipeno. The Day. Births and deaths: A record-breaking half million children were born in Ukraine last year. #3. 3 February 2009. Retrieved 8 December 2009.
- ^ Natalia LEvchuk, Brienna Perelli-Harris. (2009). Declining Fertility in UKraine: What is the role of abortion and contraception? Max Planck Institute for Demographic Research
- ^ World Bank Report, Chapter 3: Demographic Forecast Under the HIV/AIDS Epidemic
- ^ Unicef. (2004). The Situation of Children and Young People at the Regional Level in Ukraine Prepared by Ukraine Country Statistical Team Co-ordinator: Iryna Kalachova State Statistic Committee, Kiev
- ^ Kryzhanovskaya, Ludmila; Pilyagina, Galina. (1999). Suicidal behavior in the Ukraine, 1988–1998.. Crisis: The Journal of Crisis Intervention and Suicide Prevention. Vol 20(4),1999, 184-190.
- ^ The International Encyclopedia of Sexuality of the Kinsey Institute. Tamara V. Hovorun, Ph.D., and Borys M. Vornyk, Ph.D. (Medicine). Rewritten and updated in 2003 by T. V. Hovorun and B. M. Vornyk(2003) Ukraine.
- ^ Vulnerability Assessment of People Living With HIV (PLHIV) in Ukraine United Nations Development Programme, page 24 - Retrieved on December 08, 2009
- ^ Average Income in Ukraine Per Region Per Month, 2010 State Statistics Committee of Ukraine
- ^ Institute for Economic Research and Policy Consulting, German Advisory Group on Economic Reform
- ^ By Olena Malynovska, National Institute for International Security Problems, Kyiv Caught Between East and West, Ukraine Struggles with Its Migration Policy
External links
- State Committee for Statistics of Ukraine, official web site (can be properly viewed only in Internet Explorer)
- Trafficking in and enslavement of women Follow-up to the Fourth World Conference on Women, 2–13 March 1998
- Migration News, 2001 University of California, Davis
- The demographic situation in Ukraine: present state. tendencies, and predictions, Razumkov Centre
- On the status of observance and protection of the rights of Ukrainian citizens abroad the Special Report of the Ukrainian Parliament Commissioner for Human Rights
- News on Trafficking of Ukrainian Women, 2000-01 Trafficking in Women from Ukraine Research Project, University of Rhode Island
- Caught Between East and West, Ukraine Struggles with Its Migration Policy By Olena Malynovska, National Institute for International Security Problems, Kyiv, January 2006
- Emigration from Ukraine, Oct 23rd 2003 The Economist (subscription required)
Demographics of Europe Sovereign
states- Albania
- Andorra
- Armenia
- Austria
- Azerbaijan
- Belarus
- Belgium
- Bosnia and Herzegovina
- Bulgaria
- Croatia
- Cyprus
- Czech Republic
- Denmark
- Estonia
- Finland
- France
- Georgia
- Germany
- Greece
- Hungary
- Iceland
- Ireland
- Italy
- Kazakhstan
- Latvia
- Liechtenstein
- Lithuania
- Luxembourg
- Macedonia
- Malta
- Moldova
- Monaco
- Montenegro
- Netherlands
- Norway
- Poland
- Portugal
- Romania
- Russia
- San Marino
- Serbia
- Slovakia
- Slovenia
- Spain
- Sweden
- Switzerland
- Turkey
- Ukraine
- United Kingdom
- (England
- Northern Ireland
- Scotland
- Wales)
- Vatican City
States with limited
recognition- Abkhazia
- Kosovo
- Nagorno-Karabakh
- Northern Cyprus
- South Ossetia
- Transnistria
Dependencies
and other territories- Åland
- Faroe Islands
- Gibraltar
- Guernsey
- Jan Mayen
- Jersey
- Isle of Man
- Svalbard
Other entities - European Union
Categories:


Wikimedia Foundation. 2010.