- Nova Scotia general election, 2003
-
Nova Scotia general election, 2003 
1999 ←
membersAugust 5, 2003
members→ 2006
members52 seats of the Nova Scotia House of Assembly
27 seats needed for a majorityFirst party Second party Third party 
Leader John Hamm Darrell Dexter Danny Graham Party Progressive Conservative New Democrat Liberal Leader's seat Pictou Centre Cole Harbour Halifax Citadel Last election 30 11 11 Seats won 25 15 12 Seat change -5 +4 +1 Popular vote 148,182 126,479 128,417 Percentage 36.32% 31.00% 31.47% Swing -2.88% +1.03% +1.66%
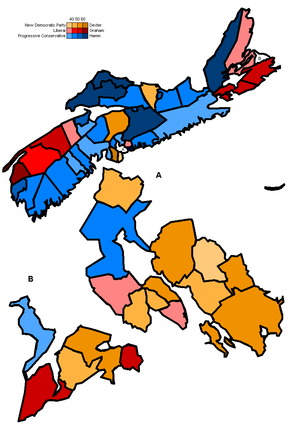
Riding map of Nova Scotia showing winning parties.
Premier before election
John Hamm
Progressive ConservativeElected Premier
John Hamm
Progressive ConservativeThe 36th Nova Scotia general election was held on August 5, 2003 to elect members of the 59th House of Assembly of the Province of Nova Scotia, Canada. The ruling Progressive Conservative Party, led by Premier John Hamm, was reduced to a minority government.
Contents
Election
The election was called by Conservatives, who decided to hold a rare summer election in the hope of strengthening their hold on the legislature. Running against them were the New Democratic Party (NDP), led by Darrell Dexter, and the Liberal Party, led by Danny Graham.
Hamm's party ran on a policy of fiscal management, tax cuts, and on their record of fulfilling most of their promises. While the NDP agreed in principle to tax cuts, their main cause was the creation of a public auto insurance company. The Liberals were the only party to criticize the tax cuts.
For the most part, the campaign was quiet and uneventful. Hamm received criticism for a great number of spending programs, including a $150 tax rebate cheque sent to Nova Scotians right before the election. The party was also criticized for holding an election in the summer when most people have other concerns. Darrell Dexter's friendly, non-confrontational style, was popular with many voters, and was a marked change from his party's usually strident socialism. Danny Graham, a young leader, was popular, but failed to make much of a mark.
The election was considered a mild failure for the Liberals and Conservatives, and something of a success for the NDP.
This election is also notable for being one of the last Canadian provincial elections in which British subjects could vote (a tiny number can still vote provincially in Saskatchewan if they were qualified in 1971).
General results
Results by party
Party Party leader # of
candidatesSeats Popular vote 1999 Dissolution Elected % Change # % Change Progressive Conservative John Hamm 52 30 31 25 -16.7% 148,182 36.32% -2.88% New Democratic Darrell Dexter 52 11 11 15 +36.4% 126,479 31.00% +1.03% Liberal Danny Graham 52 11 7 12 +9.1% 128,417 31.47% +1.66% Independents 6 0 1 - -100% 1,694 0.42% +0.13% Nova Scotia Party Gerry Rodgers 16 0 0 - - 1,637 0.40% -0.33% Marijuana Party Michael Patriquen 11 * 0 - * 1,608 0.39% * Vacant 2 Total 189 52 52 52 408,017 100% - The Marijuana Party did not contest the 1999 general election.
Results by region
Party name HRM C.B. Valley S. Shore Fundy Central Total Parties winning seats in the legislature: Progressive Conservative Seats: 4 2 3 7 5 4 25 Popular vote: 30.97% 26.68% 38.41% 45.57% 50.67% 42.94% 36.32% New Democratic Party Seats: 11 2 - - 1 1 15 Popular vote: 40.67% 26.21% 23.15% 25.10% 27.51% 25.59% 31.00% Liberal Seats: 3 5 4 - - - 12 Popular vote: 27.14% 45.71% 37.13% 29.06% 20.85% 29.21% 31.47% Parties not winning seats in the legislature: Independents Popular vote: 0.13% 1.40% - - 0.74% 0.41% 0.42% Nova Scotia Party Popular vote: 0.70% - 0.75% 0.27% 0.23% - 0.40% Marijuana Popular vote: 0.40% - 0.56% - - 1.85% 0.39% Total seats: 18 9 7 7 6 5 52 Riding results
- bold denotes a cabinet minister or party leader
- † denotes an incumbent not seeking re-election
Valley
Electoral District Candidates Incumbent PC NDP Liberal Other Annapolis Frank Chipman
2795 - (31.42%)Adrian Nette
1395 - (15.68%)Stephen McNeil
4522 - (50.83%)Harry Wilson (NSP)
185 - (2.08%)Frank Chipman Clare Marc Boudreau
1456 - (25.26%)Don Melanson
760 - (13.19%)Wayne Gaudet
3547 - (61.55%)Wayne Gaudet Digby-Annapolis Gordon Balser
2339 - (40.00%)Deborah Trask
755 - (13.20%)Harold Theriault, Jr.
2666 - (45.26%)Gordon Reid (NSP)
92 - (1.54%)Gordon Balser Hants West Ron Russell
3871 - (46.15%)Sean Bennett
2200 - (26.23%)Randy Matheson
2118 - (25.25%)Chummy Anthony (Mar.)
148 - (1.76%)
Connie Brauer (NSP)
51 - (0.61%)Ron Russell Kings North Mark Parent
4063 - (50.29%)Jim Morton
2340 - (28.94%)Michael Landry
1533 - (28.94%)Ben Friesen (Mar.)
147 - (1.82%)Mark Parent Kings South David Morse
3347 - (37.65%)David Mangle
2794 - (31.43%)Maura Ryan
2682 - (30.17%)Victor Harris (NSP)
67 - (0.75%)David Morse Kings West Jon Carey
2929 - (35.58%)Greg Hubbert
2275 - (27.51%)Leo Glavine
3045 - (36.91%)Jon Carey South Shore
Electoral District Candidates Incumbent PC NDP Liberal Other Argyle Chris d'Entremont
2345 - (47.95%)Charles Muise
595 - (12.17%)Aldric d'Entremont
1946 - (39.89%)Neil LeBlanc † Chester-St. Margaret's John Chataway
3451 - (37.33%)Hinrich Bitter-Suermann
3412 - (36.90%)Mitt Larsen
2249 - (24.25%)Sue Gault (NSP)
141 - (1.52%)John Chataway Lunenburg Michael Baker
3734 - (46.36%)Chris Heide
2625 - (46.36%)Jim Davis
1695 - (21.05%)Michael Baker Lunenburg West Carolyn Bolivar-Getson
3111 - (39.65%)David Ferguson
2180 - (27.80%)John MacDonald
2550 - (32.55%)Don Downe † Queens Kerry Morash
2721 - (44.19%)Vicki Conrad
2300 - (37.35%)Win Seaton
1137 - (18.46%)Kerry Morash Shelburne Cecil O'Donnell
3702 - (48.62%)Kendall Stoddard
810 - (10.62%)Clifford Huskilson
3107 - (40.75%)Cecil O'Donnell Yarmouth Richard Hurlburt
4656 - (56.48%)Gillian Rowley
1142 - (13.85%)Phil DeMille
2446 - (29.67%)Richard Hurlburt Fundy
Electoral District Candidates Incumbent PC NDP Liberal Other Colchester-Musquodoboit Valley Brooke Taylor
4695 - (64.34%)Kathryn Belzer
1694 - (23.22%)Joan Barnhill
908 - (12.44%)Brooke Taylor Colchester North Bill Langille
3324 - (45.22%)Garfield Forrest
1860 - (25.07%)John Davidson
2183 - (29.70%)Bill Langille Cumberland North Ernest Fage
4609 - (61.20%)Kim Cail
1105 - (14.87%)Marsh Fox
1380 - (19.41%)Jason Blanch (Ind.)
337 - (14.87%)Ernest Fage Cumberland South Murray Scott
4898 - (71.70%)Scott McKee
745 - (10.90%)Harriet McCready
1189 - (17.40%)Murray Scott Hants East Mary Lou LeRoy
1640 - (19.54%)John MacDonnell
4783 - (56.98%)Larry Matthews
1866 - (22.22%)Ken Smith (NSP)
106 - (1.26%)John MacDonnell Truro-Bible Hill Jamie Muir
3862 - (47.11%)Jim Harpell
2314 - (28.23%)Jeff Yuill
2021 - (24.66%)Jamie Muir Central Halifax
Electoral District Candidates Incumbent PC NDP Liberal Other Halifax Chebucto Sandy Phillips
1983 - (23.72%)Howard Epstein
3682 - (44.04%)Kenzie MacKinnon
2592 - (31.00%)Scott Higgins
103 - (1.23%)Howard Epstein Halifax Citadel Jane Purves
2466 - (30.28%)Peter Delefes
2542 - (31.17%)Danny Graham
3042 - (37.36%)Michael Patriquen (Mari.)
59-(0.71%)
James Marchoine (NSP)
38 - (0.48%)Jane Purves Halifax Clayton Park Mary Ann McGrath
3034 - (34.52%)Roberta Morrison
2312 - (34.52%)Diana Whalen
3329 - (37.62%)Greg Lavern
152 - (1.72%)Mary Ann McGrath Halifax Fairview Bruce MacCharles
1684 - (22.45%)Graham Steele
3439 - (45.85%)Susan Hayes
2284 - (30.45%)David Boyd (NSP)
94 - (1.25%)Graham Steele Halifax Needham Linda Carvery
1377 - (18.66%)Maureen MacDonald
3709 - (50.26%)Mike Rogers
2178 - (29.51%)Blair Baxter (NSP)
116 - (1.57%)Maureen MacDonald Suburban Halifax
Electoral District Candidates Incumbent PC NDP Liberal Other Bedford Peter Christie
4114 - (43.85%)Bob Watson
2055 - (21.97%)Richard Zurawski
3208 - (43.85%)Peter Christie Halifax Atlantic Linda Mosher
2996 - (33.68%)Michele Raymond
3327 - (37.40%)Ian MacKinnon
2382 - (26.78%)Gerald Rodgers (NSP)
191 - (2.15%)Robert Chisholm † Hammonds Plains Upper Sackville Barry Barnet
3322 - (40.99%)Brenda Haley
2229 - (27.82%)Pam Streeter
2419 - (29.89%)Melanie Patriquen (Mar.)
105 - (1.30%)Barry Barnet Sackville-Cobequid John Giannakos
2426 - (28.43%)Dave Wilson
3881 - (45.22%)Bob Harvey
2147 - (25.23%)Michael D. Patriquen (Mar.)
97 - (1.12%)John Holm † Timberlea-Prospect Barry Fraser
1535 - (18.2%)Bill Estabrooks
5049 - (60.06%)Bruce Holland
1829 - (21.74%)Bill Estabrooks Waverley-Fall River-Beaver Bank Gary Hines
3141 -(37.91%)Percy Paris
2778 - (33.53%)David Merrigan
2240 - (26.43%)Alex Neron (Mari.)
92 - (1.1%) Heather Sawers (NSP)
86 - (1.04%)Gary Hines Dartmouth/Cole Harbour/Eastern Shore
Electoral District Candidates Incumbent PC NDP Liberal Other Cole Harbour Brian Thomas
2387 - (26.39%)Darrell Dexter
4977 - (55.50%)Peter Foy
1523 - (16.98%)Jessica Gould (NSP)
102 - (1.14%)Darrell Dexter Cole Harbour-Eastern Passage Henry McInroy
1641 - (23.99%)Kevin Deveaux
3997 - (58.44%)Brian Churchill
1121 - (16.39%)Kallee McPherson (NSP)
80 - (1.17%)Kevin Deveaux Dartmouth East Terry Degen
3107 - (34.62%)Joan Massey
3272 - (36.61%)Debra Barlow
2321 - (26.05%)Hugo St-Onge (Mar.)
112 - (1.26%)
Scott Anderson (NSP)
98 - (1.10%)
Sebastien Theriault
28 - (0.36%)Jim Smith † Dartmouth North Jane MacKay
1900 - (26.46%)Jerry Pye
3799 - (53.05%)Rosemary Godin
1300 - (18.11%)Pat Gould (NSP)
96 - (1.34%)
Marc-Andre Roy (Mar.)
75 - (1.04%)Jerry Pye Dartmouth South-Portland Valley Tim Olive
2813 - (31.86%)Marilyn More
3844 - (43.30%)Colini MacEachern
2218 - (24.84%)Tim Olive Eastern Shore Bill Dooks
3073 - (45.02%)Sidney Prest
2427 - (35.57%)Randy Carter
1326 - (19.41%)Bill Dooks Preston David Hensbee
1361 - (32.92%)Douglas Sparks
1331 - (31.97%)Keith Colwell
1411 - (33.9%)Marc-Boris St-Maurice
(Mar.)50 - (1.21%)David Hensbee Central Nova
Electoral District Candidates Incumbent PC NDP Liberal Other Antigonish Angus MacIsaac
4256 - (41.64%)Terry O'Toole
1755 - (17.17%)David A. Cameron
3650 - (35.72%)Gene Purdy (Mar.)
560 - (5.48%)Angus MacIsaac Guysborough-Sheet Harbour Ronnie Chisholm
2587 - (37.99%)Jim Boudreau
2023 - (29.71%)Gordon MacDonald
2199 - (32.30%)Ronnie Chisholm Pictou Centre John Hamm
4262 - (54.71%)Alexander MacIsaac
1571 - (20.42%)Tim Daley
1789 - (22.69%)Darryl Gallivan (Mar.)
170 - (2.18%)John Hamm Pictou East Jim DeWolfe
3295 - (44.19%)Bob Matheson
1929 - (25.89%)John Fraser
2239 - (29.92%)Jim DeWolfe Pictou West Paul Veniot
2530 - (32.68%)Charlie Parker
3410 - (44.05%)Ed MacMaster
1639 - (21.17%)Doug Corbett (Ind.) 163 - (2.11%) Muriel Baillie † Cape Breton
Electoral District Candidates Incumbent PC NDP Liberal Other Cape Breton Centre Rita Tighe-MacLeod
373 - (4.81%)Frank Corbett
3929 - (50.64%)Basil McGillivray
3456 - (44.55%)Frank Corbett Cape Breton North Cecil Clarke
3754 - (43.46%)Cecil Snow
1714 - (19.84%)Mike White
3169 - (36.70%)Cecil Clarke Cape Breton Nova Todd Marsman
684 - (10.48%)Gordie Gosse
3168 - (45.19%)Mel Crowe
3094 - (44.33%)Paul MacEwan † Cape Breton South John Morrison
1677 - (17.05%)Mike MacSween
2759 - (28.99%)Manning MacDonald
5275 - (53.96%)Manning MacDonald Cape Breton West Ivan Doncaster
2221 - (25.44%)Douglas MacKinlay
1868 - (21.70%)Russell MacKinnon
4616 - (52.86%)Russell MacKinnon Glace Bay Mark Bettens
1351 - (16.20%)Vince Hall
2342 - (29.00%)David Wilson
4420 - (54.80%)David Wilson Inverness Rodney MacDonald
5398 - (51.19%)Tim Murphy
1277 - (12.11%)Debbie Gillis
3871 - (36.71%)Rodney MacDonald Richmond Richie Cotton
1850 - (31.18%)Clair Rankin
1036 - (17.46%)Michel Samson
3047 - (51.36%)Michel Samson Victoria-The Lakes Keith Bain
2036 - (32.48%)Nancy MacKeigan
934 - (14.90%)Gerald Sampson
2284 - (36.44%)Brian Boudreau (Ind.)
750 - (11.97%)
Stemer MacLeod (Ind.)
120 - (4.21%)Brian Boudreau By-elections since the general election
Chester—St. Margaret's (Death of John Chataway), June 21, 2005:
By-election: Chester—St. Margaret's Party Candidate Votes % ±% PC Judy Streatch 2,955 36.27 -1.03 Liberal Rick Fraughton 2,548 31.27 +6.96 NDP Hinrich Bitter-Suermann 2,434 29.88 -6.99 Independent Michael Oddy 210 2.58 +1.06* Total 9,270 100% - *Ind. results compared to that of the NSP during the general election.
See also
References
- Government of Nova Scotia. "Election Summary From 1867 - 2006" (PDF). Elections Statistics. Elections Nova Scotia. http://electionsnovascotia.ns.ca/results/ele_summary.pdf. Retrieved 2006-12-02.
External links
- CBC Nova Scotia Votes 2003
- Halifax Herald 2003 election website via Internet Archive.
 Elections and referendums in Nova Scotia
General elections Referendums 1929 · 2004Categories:- 2003 elections in Canada
- Elections in Nova Scotia


Wikimedia Foundation. 2010.