- Demographics of Sweden
-
Life in Sweden • Architecture
• Art
• Culture
• Demographics
• Economy
• Education• Geography
• Geology
• History
• Language
• Military
• PoliticsThe demographics of Sweden is about the demographic features of the population of Sweden, including population growth, population density, ethnicity, education level, health of the populace, economic status, religious affiliations and other aspects of the population. In addition to the ethnic Swedish majority, Sweden has historically had smaller minorities of Sami people in the northernmost parts of the country while Finns (at 5% of the total population) are most prominent in the Mälardalen and in the north of Sweden.
The demographic profile of Sweden has changed significantly as a result of immigration since the 1970s.
Contents
Population statistics
 Population of Sweden, 1961 to 2003. The population increased from 7.5 to 8.3 million during the 1960s to 1970s. After a phase of steadyness during the early 1980s, the population grew further from 8.3 to 8.8 million during 1987 to 1997, followed by another phase of stagnation (followed by another growth phase from 8.8 to 9.3 million over 2004 to 2010).
- Population: 9,316,256 (As of 31 August 2009[update])
- Annual population growth rate: 0.158% (As of 2010[update])
- Net migration rate: 1.66 migrant(s)/1,000 population (As of 2010[update] est.)
- Total fertility rate: 1.94 children born/woman (2010 est.)
- Infant mortality rate: 2.75 deaths/1,000 live births (As of 2010[update] est.)
- Life expectancy at birth: 80.86 years
- Male: 78.59 years
- Female: 83.26 years (As of 2010[update] est.)
Within Sweden's current borders, the historic population has been estimated to the following values:[1]
At the end of year Population Annual growth Total Per thousand 1570 900,000 - - 1650 1,225,000 4,063 3.86 1700 1,485,000 5,200 3.86 1720 1,350,000 - 6,750 - 4.75 1755 1,878,000 15,086 9.48 1815 2,465,000 9,783 4.54 1865 4,099,000 32,680 10.22 1900 5,140,000 29,743 6.48 1990 8,562,000 2005 9,002,000[2] 2010 9,348,000[3][4] 91,552 9.7 Sweden household census 1990
Swede (85.0%)Finns (5.0%)Other (10%)- Total number of households: 3 830 037
- Inv on average per household: 2.1
- Number of children 0–18 years on average per household: 1.72
For the population from household incounting date was the total population of Sweden estimated to be 8.526 million[5] of them 8.043 million people came from all 3.830 million household's. (1990)
Ethnicity number % Swede 6,836,615 85,0 Finns 402,153 5,0 % Assyrians 79,215 0.88 Norwegian 0.5 Danes 0.5 Croats 0.5 Albanians 0.5 Serbs 0.5 Bosnian 0.5 Lebanese 0.5 Turks 0.5 Iraqis 0.5 Iranians 0.5 Roma 39,974 0.497 Lappish 19,303 0.24 Estonians 0.1 Chilean 0.1 Greeks 0.1 Somalis 0,1 Others 279,336 3,473 Undeclared 0,0 Total 8,043,077 100.0 Sweden census 2005
Swede (85%)Finns (4.99%)Assyrians (1.30%)Other (8.71%)Note that the census does not collect data about ethnicity. It only collected data about which country a person was born in. Therefore the census does now show the number of citizens of Swedish ethnicity living in Sweden - probably a much lower rate than 85%. The 2005 Swedish census showed an increase of 475,322 compared to the 1990 census, an average increase of 31,680 annually. During the 1990s, birth rate increased by more than 100,000 children per year while death rates fell and immigration surged. In the early 2000s, birth rate declined as immigration increased further, with the context of unrest in the Middle East, upholding steady population growth.[6][7]
Notably, the Swedish-Finnish majority grew as well as the Assyrian minority, while the Sami and Roma minorities decreased sharply - leaving most other groups unchanged.
Ethnicity number % Swede 7,651,507 85.0 Finns 449,188 4.99 Assyrians 100,000-120,000 1.30 Norwegian 0.5 Danes 0.5 Croats 0.5 Albanians 0.5 Serbs 0.5 Bosnian 0.5 Lebanese 0.5 Turks 0.5 Iraqis 0.5 Iranians 0.5 Roma 36,007 0.4 Lappish 6,800 0.1 Estonians 0.1 Chilean 0.1 Greeks 0.1 Somalis 0,1 Others 270,053 3.0 Undeclared 0,0 Total 9,001,774 [8] 100.0 Ethnicity
Beside the Swedes, the Sweden-Finns are the largest ethnic minority comprising approximately 50,000 along the Swedish-Finnish border, and 450,000 first and second generation immigrated ethnic Finns. Also in the farthest North a small population of Samis live. More than 100,000-120,000 Assyrians/Syriacs live in Sweden, including around 50,000 in Stockholm County.[9][10]
CIA World Factbook demographic statistics
- For the latest statistics, see this country's entry in the CIA World Factbook
- Age structure
- 0–14 years: 15.7% (male 733,597; female 692,194)
- 15–64 years: 65.5% (male 3,003,358; female 2,927,038)
- 65 years and over: 18.8% (male 753,293; female 950,171) (As of 2010[update] est.)
- Net migration rate
- 1.66 migrant(s)/1,000 population (As of 2010[update] est.)
- Sex ratio
- at birth: 1.061 male(s)/female
- under 15 years: 1.06 male(s)/female
- 15–64 years: 1.02 male(s)/female
- 65 years and over: 0.8 male(s)/female
- total population: 0.98 male(s)/female (As of 2010[update] est.)
- Infant mortality rate
- total: 2.75 deaths/1,000 live births
- Life expectancy at birth
- total population: 80.86 years
- male: 78.59 years
- female: 83.26 years (As of 2010[update] est.)
- Total fertility rate
- 1.94 children born/woman (As of 2009[update] est.)
- Literacy
- definition: age 15 and over can read and write
- total population: 99% (As of 2003[update] est.)
Vital statistics since 1900 [11]
 Estimated birth rate (blue) and death rate in Sweden for the period of 1735 to 2000. The graph indicates strong population growth for the period of 1800 to 1970, and a beginning population decline from the 1980s.
Average population (x 1000) Live births Deaths Natural change Crude birth rate (per 1000) Crude death rate (per 1000) Natural change (per 1000) 1900 5 117 138 139 86 146 51 993 27.0 16.8 10.2 1901 5 156 139 370 82 772 56 598 27.0 16.1 11.0 1902 5 187 137 364 79 722 57 642 26.5 15.4 11.1 1903 5 210 133 896 78 610 55 286 25.7 15.1 10.6 1904 5 241 134 952 80 152 54 800 25.7 15.3 10.5 1905 5 278 135 409 82 443 52 966 25.7 15.6 10.0 1906 5 316 136 620 76 366 60 254 25.7 14.4 11.3 1907 5 357 136 793 78 149 58 644 25.5 14.6 10.9 1908 5 404 138 874 80 568 58 306 25.7 14.9 10.8 1909 5 453 139 505 74 538 64 967 25.6 13.7 11.9 1910 5 499 135 625 77 212 58 413 24.7 14.0 10.6 1911 5 542 132 977 76 462 56 515 24.0 13.8 10.2 1912 5 583 132 868 79 241 53 627 23.8 14.2 9.6 1913 5 621 130 200 76 724 53 476 23.2 13.6 9.5 1914 5 659 129 458 78 311 51 147 22.9 13.8 9.0 1915 5 696 122 997 83 587 39 410 21.6 14.7 6.9 1916 5 735 121 679 77 771 43 908 21.2 13.6 7.7 1917 5 779 120 855 77 385 43 470 20.9 13.4 7.5 1918 5 807 117 955 104 594 13 361 20.3 18.0 2.3 1919 5 830 115 193 84 289 30 904 19.8 14.5 5.3 1920 5 876 138 753 78 128 60 625 23.6 13.3 10.3 1921 5 929 127 723 73 536 54 187 21.5 12.4 9.1 1922 5 971 116 946 76 343 40 603 19.6 12.8 6.8 1923 5 997 113 435 68 424 45 011 18.9 11.4 7.5 1924 6 021 109 055 72 001 37 054 18.1 12.0 6.2 1925 6 045 106 292 70 918 35 374 17.6 11.7 5.9 1926 6 064 102 007 71 344 30 663 16.8 11.8 5.1 1927 6 081 97 994 77 219 20 775 16.1 12.7 3.4 1928 6 097 97 868 73 267 24 601 16.1 12.0 4.0 1929 6 113 92 861 74 538 18 323 15.2 12.2 3.0 1930 6 131 94 220 71 790 22 430 15.4 11.7 3.7 1931 6 152 91 074 77 121 13 953 14.8 12.5 2.3 1932 6 176 89 779 71 459 18 320 14.5 11.6 3.0 1933 6 201 85 020 69 607 15 413 13.7 11.2 2.5 1934 6 222 85 092 69 921 15 171 13.7 11.2 2.4 1935 6 242 85 906 72 813 13 093 13.8 11.7 2.1 1936 6 259 88 938 74 836 14 102 14.2 12.0 2.3 1937 6 276 90 373 75 392 14 981 14.4 12.0 2.4 1938 6 297 93 946 72 693 21 253 14.9 11.5 3.4 1939 6 326 97 380 72 876 24 504 15.4 11.5 3.9 1940 6 356 95 778 72 748 23 030 15.1 11.4 3.6 1941 6 389 99 727 71 910 27 817 15.6 11.3 4.4 1942 6 432 113 961 63 741 50 220 17.7 9.9 7.8 1943 6 491 125 392 66 105 59 287 19.3 10.2 9.1 1944 6 560 134 991 72 284 62 707 20.6 11.0 9.6 1945 6 636 135 373 71 901 63 472 20.4 10.8 9.6 1946 6 719 132 597 70 635 61 962 19.7 10.5 9.2 1947 6 803 128 779 73 579 55 200 18.9 10.8 8.1 1948 6 883 126 683 67 693 58 990 18.4 9.8 8.6 1949 6 956 121 272 69 537 51 735 17.4 10.0 7.4 1950 7 014 115 414 70 296 45 118 16.5 10.0 6.4 1951 7 073 110 168 69 799 40 369 15.6 9.9 5.7 1952 7 125 110 192 68 270 41 922 15.5 9.6 5.9 1953 7 171 110 144 69 553 40 591 15.4 9.7 5.7 1954 7 213 105 096 69 030 36 066 14.6 9.6 5.0 1955 7 262 107 305 68 634 38 671 14.8 9.5 5.3 1956 7 315 107 960 70 205 37 755 14.8 9.6 5.2 1957 7 364 107 168 73 132 34 036 14.6 9.9 4.6 1958 7 409 105 502 71 065 34 437 14.2 9.6 4.6 1959 7 446 104 743 70 889 33 854 14.1 9.5 4.5 1960 7 480 102 219 75 093 27 126 13.7 10.0 3.6 1961 7 520 104 501 73 555 30 946 13.9 9.8 4.1 1962 7 562 107 284 76 791 30 493 14.2 10.2 4.0 1963 7 604 112 903 76 460 36 443 14.8 10.1 4.8 1964 7 661 122 664 76 661 46 003 16.0 10.0 6.0 1965 7 734 122 806 78 194 44 612 15.9 10.1 5.8 1966 7 808 123 354 78 440 44 914 15.8 10.0 5.8 1967 7 868 121 360 79 783 41 577 15.4 10.1 5.3 1968 7 914 113 087 82 476 30 611 14.3 10.4 3.9 1969 7 968 107 622 83 352 24 270 13.5 10.5 3.0 1970 8 043 110 150 80 026 30 124 13.7 9.9 3.7 1971 8 098 114 484 82 717 31 767 14.1 10.2 3.9 1972 8 122 112 273 84 051 28 222 13.8 10.3 3.5 1973 8 137 109 663 85 640 24 023 13.5 10.5 3.0 1974 8 161 109 874 86 316 23 558 13.5 10.6 2.9 1975 8 193 103 632 88 208 15 424 12.6 10.8 1.9 1976 8 222 98 345 90 677 7 668 12.0 11.0 0.9 1977 8 252 96 057 88 202 7 855 11.6 10.7 1.0 1978 8 276 93 248 89 681 3 567 11.3 10.8 0.4 1979 8 294 96 255 91 074 5 181 11.6 11.0 0.6 1980 8 310 97 064 91 800 5 264 11.7 11.0 0.6 1981 8 320 94 065 92 034 2 031 11.3 11.1 0.2 1982 8 325 92 748 90 671 2 077 11.1 10.9 0.2 1983 8 329 91 780 90 791 989 11.0 10.9 0.1 1984 8 337 93 889 90 483 3 406 11.3 10.9 0.4 1985 8 350 98 463 94 032 4 431 11.8 11.3 0.5 1986 8 370 101 950 93 295 8 655 12.2 11.1 1.0 1987 8 398 104 699 93 307 11 392 12.5 11.1 1.4 1988 8 437 112 080 96 743 15 337 13.3 11.5 1.8 1989 8 493 116 023 92 110 23 913 13.7 10.8 2.8 1990 8 559 123 938 95 161 28 777 14.5 11.1 3.4 1991 8 617 123 737 95 202 28 535 14.4 11.0 3.3 1992 8 668 122 848 94 710 28 138 14.2 10.9 3.2 1993 8 719 117 998 97 008 20 990 13.5 11.1 2.4 1994 8 781 112 257 91 844 20 413 12.8 10.5 2.3 1995 8 831 103 326 96 910 6 416 11.7 11.0 0.7 1996 8 843 95 297 94 133 1 164 10.8 10.6 0.1 1997 8 846 89 171 92 674 -3 503 10.1 10.5 -0.4 1998 8 851 88 384 92 891 -4 507 10.0 10.5 -0.5 1999 8 858 88 173 94 726 -6 553 10.0 10.7 -0.7 2000 8 872 90 441 93 285 -2 844 10.2 10.5 -0.3 2001 8 896 91 466 93 752 -2 286 10.3 10.5 -0.3 2002 8 925 95 815 95 009 806 10.7 10.6 0.1 2003 8 958 99 157 92 961 6 196 11.1 10.4 0.7 2004 8 994 100 928 90 532 10 396 11.2 10.1 1.2 2005 9 030 101 346 91 710 9 636 11.2 10.2 1.1 2006 9 081 105 913 91 177 14 736 11.7 10.0 1.6 2007 9 148 107 421 91 729 15 692 11.7 10.0 1.7 2008 9 220 109 301 91 449 17 852 11.9 9.9 1.9 2009 9 299 111 801 90 080 21 721 12.0 9.7 2.3 2010 9 379 115 641 90 487 25 154 12.3 9.6 2.7 Migration
Immigration
Main article: Immigration to Sweden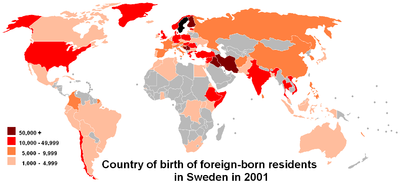
Demographics
According to Eurostat, in 2010, there were 1.33 million foreign-born residents in Sweden, corresponding to 14.3% of the total population. Of these, 859 000 (9.2%) were born outside the EU and 477 000 (5.1%) were born in another EU Member State.[12][13] The largest groups were:
 Finland (172,218)
 Former Yugoslavia (152,268)
 Iraq (117,919)
 Iran (59,922)
 Poland (49,518)
 Germany (47,803)
 Denmark (46,002)
 Norway (43,819)
 Turkey (40,766)
 Somalia (31,734)
[14] The number of Assyrians in Sweden is about 100,000 – 120,000.[15][16] Christian Assyrians are in fact the majority of people from Iraq in Sweden.
The fastest growing groups of foreign-born residents in Sweden between 2000 and 2010 were the following nationalities:
 Burundi (+3031%)
 Gaza Strip (+2542%)
 Mongolia (+2028%)
 Uzbekistan (+1439%)
 Cameroon (+1165%)
 Kyrgyzstan (+1115%)
 Myanmar (+1022%)
 Azerbaijan (+1015%)
 Lithuania (+758%)
 Central African Republic (+627%)
It should be noted that the predominant reason for the large percentage growth is that most of these nationalities were virtually non-existent in Sweden in the year 2000. For example, despite a growth of 627% the number of Swedish residents born in the Central African Republic only numbered 80 individuals.
History
- World War II
Immigration increased markedly with World War II. Historically, the most numerous of foreign born nationalities are ethnic Germans from Germany and other Scandinavians from Denmark and Norway. In short order, 70,000 war children were evacuated from Finland, of which 15,000 remained in Sweden. Also, many of Denmark's nearly 7,000 Jews who were evacuated to Sweden decided to remain there.
A sizable community from the Baltic States (Estonia, Latvia and Lithuania) arrived during the Second World War.[17]
- 1945 to 1967
During the 1950s and 1960s, the recruitment of immigrant labor was an important factor of immigration. The Nordic countries signed a trade agreement in 1952, establishing a common labour market and free movement across borders. This migration within the Nordic countries, especially from Findland to Scandinavia, was essential to create the tax-base required for the expansion of the strong public sector now charactreristic of Scandinavia.[citation needed] This continued until 1967, when the labour market became saturated, and Sweden introduced new immigration controls.
On a smaller scale, Sweden took in political refugees from Hungary and the former Czechoslovakia after their countries were invaded by the Soviet Union in 1956 and 1968 respectively. Some tens of thousands of American draft dodgers from the Vietnam War in the 1960s and 1970s also found refuge in Sweden.[citation needed]
Contemporary immigration
Since the early 1970s, immigration to Sweden has been mostly due to refugee migration and family reunification from countries in the Middle East and Latin America.[18]
The first group of Assyrians/Syriacs moved to Sweden from Lebanon in 1967. Many of them live in Södertälje (Stockholm), also known as Mesopotälje (after Mesopotamia).[19][20] There are also around 40,000 Roma in Sweden.[21]
Immigration of Iraqis has increased dramatically during the Iraq War, during 2003 to 2007. A total of 8,951 Iraqis came to Sweden in 2006, accounting for 45% of the entire Iraqi migration to Europe. By 2007, the community of Iraqis in Sweden numbered above 70,000. In 2008, Sweden introduced tighter rules on asylum seekers.[22]
Emigration
In the 19th century, Sweden's yearly population growth rate peaked at 1.2% (i.e. it doubled in less than 60 years), compared to 1% today (migration excluded). This considerable population growth rate led, before the Industrial Revolution, to a pauperization of the rural population, for each generation inherited smaller and smaller shares. Due to years of crop failure in the 1840s and 1860s, the U.S. Homestead Act of 1862, and to a lesser extent religious persecution, emigration started and grew. Between 1850 and 1930 1,050,000 Swedes emigrated (re-migration excluded), chiefly to Canada, U.S. and to Denmark. If they had not left, Sweden's population would have been about 2,000,000 higher today, assuming famine and civil war would not have resulted from their staying. (After 1929 the net-migration has been directed towards Sweden.)
The re-migration of Swedish nationals from the U.S. was culturally more important than the absolute figures reveal. The re-migrants often re-settled in their native parish, where their relative wealth and foreign experience ensured a prestigious position in the community. U.S. views, values and not the least world-view followed the re-migrants, ensuring a popular perception of closeness to U.S., contrary to the situation in for instance neighbouring Denmark or Finland (and contrary to the Swedish elite's closeness to Germany and Continental Europe).
Language
Main articles: Swedish Language and Languages of SwedenThe Swedish language is by far the dominating language in Sweden, and is used by the government administration.
The indigenous Uralic languages were repressed well into the 1960s.[citation needed] Since 1999 Sweden has five officially recognized minority languages: Sami, Meänkieli, Standard-Finnish, Romani chib and Yiddish.
The Sami language, spoken by about 7,000 people in Sweden, may be used in government agencies, courts, preschools and nursing homes in the municipalities of Arjeplog, Gällivare, Jokkmokk and Kiruna and its immediate neighbourhood.
Similarly, Finnish and Meänkieli can be used in the municipalities of Gällivare, Haparanda, Kiruna, Pajala and Övertorneå and its immediate neighbourhood. Finnish is also official language, along with Swedish, in the city of Eskilstuna[citation needed].
During the mid to late 20th century, immigrant communities brought other languages, among others being Danish, Turkish, Serbo-Croatian, Arabic, Neo-Aramaic.[23]
Religion
Main article: Religion in SwedenAlthough only one fifth of Swedes in one investigation chose to describe themselves as believing in God,[24] the majority (78%) of the population belongs to the Church of Sweden, the Lutheran church that separated from the state in 2000. This is because until recently, those who had family members in the church automatically became members at birth.[citation needed] Other Christian denominations in Sweden include Roman Catholic (see Catholic Church of Sweden), Orthodox, Baptist, and other evangelical Christian churches (frikyrkor = "free churches"). Shamanism persisted among the Sami people up until the 18th century, but no longer exists in its traditional form as most Sami today belong to the Lutheran church. There are also a number of Muslims, Buddhists, Bahá'í and Jews in Sweden, mainly from immigration.[citation needed]
See also
- Statistics Sweden
- Municipalities of Sweden
- Demographical center of Sweden
- Immigration to Europe
- List of countries by immigrant population
- Aging of Europe
References
- ^ Gustav Sundbärg, Sveriges land och folk (1901), page 90.
- ^ According to Statistiska centralbyrån (Statistics Sweden), Sweden's population reached 9,000,000 As of 12 August 2004[update]. See the Swedish population web counter.
- ^ The 2010 estimate from Statistiska Centralbyrån suggested that population to 9,347,899. This estimate represents an increase by 91,552 since 2009 years estimate, a record increase since 1946. [1][http://epp.eurostat.ec.europa.eu/tgm/table.do?tab=table&language=en&pcode=tps00001&tableSelection=1&footnotes=yes&labeling=labels&plugin=1
- ^ [2]
- ^ http://www.theodora.com/wfb1990/sweden/sweden_people.html
- ^ http://unstats.un.org/unsd/demographic/meetings/egm/Symposium2001/docs/symposium_13.htm
- ^ http://unstats.un.org/unsd/censuskb/article.aspx?id=10161
- ^ http://www.umsl.edu/services/govdocs/wofact2005/geos/sw.html#People
- ^ http://www.eurfedling.org/Sweden.htm
- ^ http://www.aina.org/brief.html
- ^ Statistics Sweden
- ^ 6.5% of the EU population are foreigners and 9.4% are born abroad, Eurostat, Katya VASILEVA, 34/2011.
- ^ [3]
- ^ [4]
- ^ http://www.eurfedling.org/Sweden.htm
- ^ http://www.aina.org/brief.html
- ^ The Swedish Integration Board (2006). Pocket Facts: Statistics on Integration. Integrationsverket, 2006. ISBN 9189609301. Available online in pdf format. Retrieved 14 February 2007.
- ^ Sweden: Restrictive Immigration Policy and Multiculturalism, Migration Policy Institute, 2006.
- ^ Assyrians/Syriacs in Sweden (Swedish)
- ^ K. Nordgren, Who Does History Belong To? History as Consciousness, Culture and Action in Multicultural Sweden, Karlstad University, Sweden, 2006. (Swedish)
- ^ Romani people in Sweden
- ^ "Sweden tightens rules on Iraqi asylum seekers". reuters.com. 2007-07-06. http://www.reuters.com/article/idUSL06873099. Retrieved 2010-12-14.
- ^ http://www.ethnologue.com/show_country.asp?name=SE
- ^ Sifo, Din egen livsåskådning
External links
- Population Statistics – in English
- Statistics Sweden – Official Data Base
Demographics of Europe Sovereign
states- Albania
- Andorra
- Armenia
- Austria
- Azerbaijan
- Belarus
- Belgium
- Bosnia and Herzegovina
- Bulgaria
- Croatia
- Cyprus
- Czech Republic
- Denmark
- Estonia
- Finland
- France
- Georgia
- Germany
- Greece
- Hungary
- Iceland
- Ireland
- Italy
- Kazakhstan
- Latvia
- Liechtenstein
- Lithuania
- Luxembourg
- Macedonia
- Malta
- Moldova
- Monaco
- Montenegro
- Netherlands
- Norway
- Poland
- Portugal
- Romania
- Russia
- San Marino
- Serbia
- Slovakia
- Slovenia
- Spain
- Sweden
- Switzerland
- Turkey
- Ukraine
- United Kingdom
- (England
- Northern Ireland
- Scotland
- Wales)
- Vatican City
States with limited
recognition- Abkhazia
- Kosovo
- Nagorno-Karabakh
- Northern Cyprus
- South Ossetia
- Transnistria
Dependencies
and other territories- Åland
- Faroe Islands
- Gibraltar
- Guernsey
- Jan Mayen
- Jersey
- Isle of Man
- Svalbard
Other entities - European Union
Categories:


Wikimedia Foundation. 2010.