- Demographics of Poland
-
The Demographics of Poland is about the demographic features of the population of Poland, including population density, ethnicity, education level, health of the populace, economic status, religious affiliations and other aspects of the population.
According to the estimates of Polish Central Statistical Office (GUS), at the end of 2007 Poland had a population of 38,115,000, which translates into average population density of 122 people/km² (urban 1105 per 1 km², rural 50 per 1 km²). 61.5% of Polish population lives in the urban areas, a number which is slowly diminishing. Poland is the 33rd most populous country in the world (9th in Europe, with 5.4% of European population). Total population of Poland is almost stagnant (population growth was 0,08%). Average life expectancy was 70.5 for men and 78.9 for women. In 2009 it is expected to be 73.1 for men and 79.5 for women. Population distribution is uneven. From ethnic perspective, Poland is very homogeneous, with 96.7% of population being Polish.
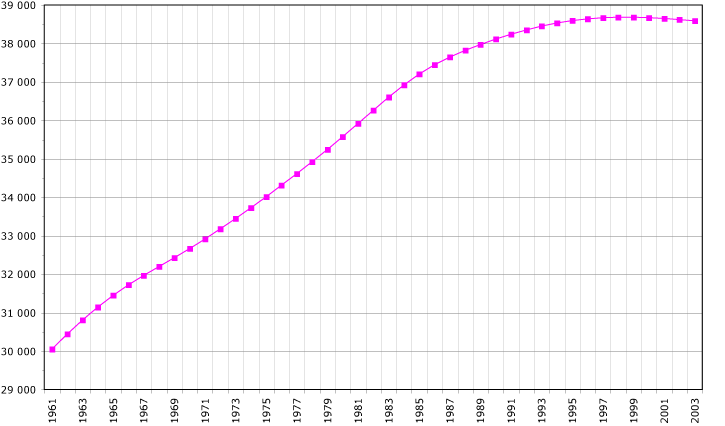
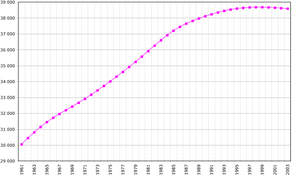 Demographics of Poland, Data of FAO, 1961-2010 ; Number of inhabitants in millions.
A number of censuses have assessed this data, including a national census in 2002, and a survey by the Helsinki Foundation for Human Rights (HFHR), which confirmed there are numerous autochthonous ethnic groups in Poland. Estimates by INTEREG and Eurominority present a similar demographics picture of Poland but they provide estimates only for the most numerous of the autochthonous ethnic groups.
Contents
Historical population
For more details on this topic, see Historical demography of Poland.For many centuries, until the end of Second World War, the Polish population was composed of many significant ethnic minorities. The population of Poland decreased due to the losses sustained during World War II, and became one of the most ethnically homogeneous in Europe as a result of radically altered borders after the war. The subsequent repatriations were accompanied by two waves of forced migrations ordered by joint Polish and Soviet authorities, who wished to remove the sizable Polish minorities from Lithuania, Belarus and Ukraine, deport Ukrainians back to USSR and expel the Germans from lands ceded to Poland after the Yalta Conference.
Vital statistics[1][2][3]
Before WW II
Average population (x 1000) Live births Deaths Natural change Crude birth rate (per 1000) Crude death rate (per 1000) Natural change (per 1000) 1921 27 150 890 000 568 000 322 000 32.8 20.9 11.9 1922 27 860 983 000 555 000 428 000 35.3 19.9 15.4 1923 28 210 1015 000 494 000 521 000 36.0 17.5 18.5 1924 28 550 1000 000 519 000 481 000 35.0 18.2 16.8 1925 29 290 1037 000 492 000 545 000 35.4 16.8 18.6 1926 29 900 989 000 533 000 456 000 33.1 17.8 15.3 1927 30 330 958 000 525 000 433 000 31.6 17.3 14.3 1928 30 760 984 000 505 000 479 000 32.0 16.4 15.6 1929 31 090 988 000 520 000 468 000 31.8 16.7 15.1 1930 31 440 1016 000 490 000 526 000 32.3 15.6 16.7 1931 31 970 966 000 495 000 471 000 30.2 15.5 14.7 1932 32 383 932 000 487 000 445 000 28.9 15.0 13.9 1933 32 810 869 000 466 000 403 000 26.5 14.2 12.3 1934 33 201 881 615 479 684 401 931 26.6 14.4 12.1 1935 33 601 876 667 470 998 405 669 26.1 14.0 12.1 1936 34 002 892 320 482 633 409 687 26.2 14.2 12.0 1937 34 359 856 064 481 594 374 470 24.9 14.0 10.9 1938 34 923 849 873 479 602 370 271 24.3 13.7 10.6 After WW II
Average population (x 1000) Live births Deaths Natural change Crude birth rate (per 1000) Crude death rate (per 1000) Natural change (per 1000) 1946 23 777 570 000 335 000 235 000 24.0 14.1 9.9 1947 23 970 630 000 271 000 359 000 26.3 11.3 15.0 1948 23 980 704 772 268 000 436 772 29.4 11.2 18.2 1949 24 410 725 061 284 000 441 061 29.7 11.6 18.1 1950 24 824 763 108 288 685 474 423 30.7 11.6 19.1 1951 25 271 783 597 312 314 471 283 31.0 12.4 18.6 1952 25 753 778 962 286 730 492 232 30.2 11.1 19.1 1953 26 255 779 000 266 527 512 473 29.7 10.2 19.5 1954 26 761 778 054 276 406 501 648 29.1 10.3 18.7 1955 27 281 793 847 261 576 532 271 29.1 9.6 19.5 1956 27 815 779 835 249 606 530 229 28.0 9.0 19.1 1957 28 310 782 319 269 137 513 182 27.6 9.5 18.1 1958 28 770 752 600 241 435 511 165 26.2 8.4 17.8 1959 29 240 722 928 252 430 470 498 24.7 8.6 16.1 1960 29 561 669 485 224 167 445 318 22.6 7.6 15.1 1961 29 965 627 624 227 759 399 865 20.9 7.6 13.3 1962 30 324 599 505 239 199 360 306 19.8 7.9 11.9 1963 30 691 588 235 230 072 358 163 19.2 7.5 11.7 1964 31 161 562 855 235 919 326 936 18.1 7.6 10.5 1965 31 496 546 362 232 421 313 941 17.3 7.4 10.0 1966 31 698 530 307 232 945 297 362 16.7 7.3 9.4 1967 31 944 520 383 247 705 272 678 16.3 7.8 8.5 1968 32 426 524 174 244 115 280 059 16.2 7.5 8.6 1969 32 555 531 135 262 823 268 312 16.3 8.1 8.2 1970 32 526 545 973 266 799 279 174 16.8 8.2 8.6 1971 32 805 562 341 283 702 278 639 17.1 8.6 8.5 1972 33 068 575 725 265 250 310 475 17.4 8.0 9.4 1973 33 363 598 559 277 188 321 371 17.9 8.3 9.6 1974 33 691 621 080 277 085 343 995 18.4 8.2 10.2 1975 34 022 643 772 296 896 346 876 18.9 8.7 10.2 1976 34 362 670 140 304 057 366 083 19.5 8.8 10.7 1977 34 698 662 582 312 956 349 626 19.1 9.0 10.1 1978 35 010 666 336 325 104 341 232 19.0 9.3 9.7 1979 35 257 688 293 323 048 365 245 19.5 9.2 10.4 1980 35 578 692 798 350 203 342 595 19.5 9.8 9.6 1981 35 902 678 696 328 923 349 773 18.9 9.2 9.7 1982 36 227 702 351 334 869 367 482 19.4 9.2 10.1 1983 36 571 720 756 349 388 371 368 19.7 9.6 10.2 1984 36 914 699 041 364 883 334 158 18.9 9.9 9.1 1985 37 203 677 576 381 458 296 118 18.2 10.3 8.0 1986 37 456 634 748 376 316 258 432 16.9 10.0 6.9 1987 37 664 605 492 378 365 227 127 16.1 10.0 6.0 1988 37 862 587 741 370 821 216 920 15.5 9.8 5.7 1989 37 963 562 530 381 173 181 357 14.8 10.0 4.8 1990 38 119 545 817 390 343 155 474 14.3 10.2 4.1 1991 38 245 547 719 405 716 142 003 14.3 10.6 3.7 1992 38 365 515 214 394 729 120 485 13.4 10.3 3.1 1993 38 459 494 310 392 259 102 051 12.9 10.2 2.7 1994 38 544 481 285 386 398 94 887 12.5 10.0 2.5 1995 38 588 443 109 386 084 57 025 11.5 10.0 1.5 1996 38 618 428 203 385 496 42 707 11.1 10.0 1.1 1997 38 650 412 635 380 201 32 434 10.7 9.8 0.8 1998 38 666 395 619 375 354 20 265 10.2 9.7 0.5 1999 38 654 382 002 381 415 587 9.9 9.9 0.0 2000 38 649 378 348 368 028 10 320 9.8 9.5 0.3 2001 38 248 368 205 363 220 4 985 9.6 9.5 0.1 2002 38 231 353 765 359 486 -5 721 9.3 9.4 -0.1 2003 38 205 351 072 365 230 -14 158 9.2 9.6 -0.4 2004 38 183 356 131 363 522 -7 391 9.3 9.5 -0.2 2005 38 166 364 383 368 285 -3 902 9.5 9.6 -0.1 2006 38 141 374 244 369 686 4 558 9.8 9.7 0.1 2007 38 121 387 873 377 226 10 647 10.2 9.9 0.3 2008 38 126 414 499 379 399 35 100 10.9 10.0 0.9 2009 38 152 417 600 384 900 32 700 10.9 10.1 0.9 2010 Nationalities
For more details on this topic, see Ethnic minorities in Poland.96.7% of the people of Poland claim Polish nationality, and 97.8% declare that they speak Polish at home (Census 2002).
Largest metropolitan and urban areas
Main article: Metropolitan areas in Poland- Population numbers by database
Area ESPON [4] Eurostat LUZ [5] Ministry of Regional Development[6] United Nations [7] Demographia.com[8] Citypopulation.de[9] Scientific study by T. Markowski[10] Scientific study by Swianiewicz, Klimska [11] Katowice (Katowice urban area) 3,029,000[12](5,294,000) 2,710,397 3,239,200 3,069,000 2,500,000 2,775,000 2,746,000 2,733,000 Warsaw 2,785,000 2,660,406 2,680,600 2,194,000 2,030,000 2,375,000 2,631,900 2,504,000 Kraków 1,236,000 1,264,322 1,227,200 818,000 750,000 Not listed 1,257,500 1,367,000 Łódź 1,165,000 1,163,516 1,061,600 974,000 950,000 1,060,000 1,178,000 1,129,000 Gdańsk 993,000 1,105,203 1,220,800 854,000 775,000 No data 1,098,400 1,210,000 Poznań 919,000 1,018,511 1,227,200 No data 600,000 No data 1,011,200 846,000 Wrocław 861,000 1,031,439 1,136,900 No data 700,000 No data 1,029,800 956,000 Szczecin 721,000 878,314 724,700 No data 500,000 No data No data 755,806 Demographics by town
City Voivodeship Inhabitants
May 20, 2002Inhabitants
December 31, 2004Inhabitants
December 31, 20061 Warsaw Masovia 1,671,670 1,692,854 1,702,139 2 Łódź Łódź 789,318 774,004 760,251 3 Kraków Lesser Poland 758,544 757,430 756,267 4 Wrocław Lower Silesia 640,367 636,268 634,630 5 Poznań Greater Poland 578,886 570,778 564,951 6 Gdańsk Pomerania 461,334 459,072 456,658 7 Szczecin Western Pomerania 415,399 411,900 409,068 8 Bydgoszcz Kuyavia-Pomerania 373,804 368,235 363,468 9 Lublin Lublin 357,110 355,998 353,483 10 Katowice Silesia 327,222 319,904 314,500 11 Białystok (Demographics) Podlaskie 291,383 292,150 294,830 12 Gdynia Pomerania 253,458 253,324 251,844 13 Częstochowa Silesia 251,436 248,032 245,030 14 Radom Masovia 229,699 227,613 225,810 15 Sosnowiec Silesia 232,622 228,192 245,030 16 Toruń Kuyavia-Pomerania 211,243 208,278 207,190 17 Kielce Świętokrzyskie 212,429 209,455 207,188 18 Gliwice Silesia 203,814 200,361 198,499 19 Zabrze Silesia 195,293 192,546 190,110 20 Bytom Silesia 193,546 189,535 186,540 21 Bielsko-Biała Silesia 178,028 176,987 176,453 22 Olsztyn Warmia-Masuria 173,102 174,550 174,941 23 Rzeszów Subcarpathia 160,376 159,020 165,578 24 Ruda Śląska Silesia 150,595 147,403 145,471 25 Rybnik Silesia 142,731 141,755 141,388 26 Tychy Silesia 132,816 131,547 130,492 27 Dąbrowa Górnicza Silesia 132,236 130,789 129,559 28 Opole Opole 129,946 128,864 127,602 29 Płock Masovia 128,361 127,841 127,224 30 Elbląg Warmia-Masuria 128,134 127,655 126,985 31 Gorzów Wielkopolski Lubusz 125,914 125,578 125,504 32 Wałbrzych Lower Silesia 130,268 127,566 124,988 33 Włocławek Kuyavia-Pomerania 121,229 120,369 119,256 34 Zielona Góra Lubusz 118,293 118,516 118,115 35 Tarnów Lesser Poland 119,913 118,267 116,967 36 Chorzów Silesia 117,430 115,241 113,978 37 Kalisz Greater Poland 109,498 108,792 108,477 38 Koszalin Western Pomerania 108,709 107,773 107,693 39 Legnica Lower Silesia 107,100 106,143 105,186 40 Grudziądz Kuyavia-Pomerania 99,943 98,757 99,244 41 Słupsk Pomerania 100,376 99,827 98,092 Demographics by voivodeship
Inhabitants of voivodeships
(2008, according to GUS)Kuyavian-Pomeranian 17 972 2 067 918 +0,07 Lublin 25 122 2 161 832 -0,15 Lubusz 13 998 1 008 926 0,00 Łódź 18 219 2 548 861 -0,20 Lesser Poland 15 183 3 287 136 +0.22 Masovian 35 558 5 204 495 +0,26 Opole 9412 1 033 040 -0,31 Subcarpathian 17 846 2 099 495 +0,03 Podlaskie (Demographics) 20 187 1 191 470 -0,07 Pomeranian 18 310 2 219 512 +0,32 Silesian 12 334 4 645 665 -0.12 Świętokrzyskie 11 710 1 272 784 -0,20 Warmian-Masurian 24 173 1 427 073 +0,03 Greater Poland 29 827 3 397 617 +0.26 West Pomeranian 22 892 1 692 957 +0,04 Poland 312 679 38 135 876 +0,05 Statistics
The following demographic statistics are from the CIA World Factbook, unless otherwise indicated.
Population
38,192,000 (June 2010 est.) - 34th country in comparison to the world.[13]
Total asylum seekers admitted
10,590 (2009) applications, mostly from the Russian Federation,[14] Georgia, and Armenia.[15]
Age structure
0–14 years: 14.8% (male 2,931,732/female 2,769,021)
15–64 years: 71.7% (male 13,725,939/female 13,863,103)
65 years and over: 13.5% (male 1,971,763/female 3,202,131) (2010 est.)Sex ratio
at birth: 1.061 male(s)/female
under 15 years: 1.06 male(s)/female
15–64 years: 0.99 male(s)/female
65 years and over: 0.62 male(s)/female
total population: 0.94 male(s)/female (2010 est.)Infant mortality rate
total: 6.66 deaths/1,000 live births
male: 7.38 deaths/1,000 live births
female: 5.9 deaths/1,000 live births (2010 est.)Life expectancy at birth
total population: 75.85 years
male: 71.88 years
female: 80.06 years (2010 est.)Total fertility rate
1.40 children born/woman (2009 est.).[16] The 2008 est. was 1.39, with 1.30 for urban areas and 1.53 for rural areas. The 2008 total fertility rate of 1.39 is a significant improvement over 1.31 in 2007.[16]
Ethnic groups
Main article: Minorities in Poland Polish 96.7%,
 German 152.897
 Ukrainians - 150.000
 Belarusians - 47.640
 Vietnamese - 40.000
 Armenians - 20.858
 Russians (including Chechens) - 12.550
 Chinese - 8.016
 Arabs - 4.072
 Indians - 2.094
Religions
See also: Religion in Poland and Catholic Church in Poland.Roman Catholic 94% (about 75% practicing), unspecified 6% (2002 census)
Languages
Main article: Languages of PolandPolish 97.8%, other and unspecified 2.2% (2002 census)
Literacy
definition: age 15 and over can read and write
total population: 99.8%
male: 99.8%
female: 99.7% (2003 est.)Notes
- ^ B.R. Mitchell. European historical statistics, 1750-1975.
- ^ http://unstats.un.org/unsd/demographic/products/dyb/dybsets/1948%20DYB.pdf United nations. Demographic Yearbook 1948
- ^ Central Statistical Office of Poland
- ^ European Spatial Planning Observation Network, Study on Urban Functions (Project 1.4.3), Final Report, Chapter 3, (ESPON, 2007)
- ^ Eurostat, Urban Audit database, accessed on 2009-03-12. Data for 2004.
- ^ "Koncepcja przestrzennego zagospodarowania kraju" - Ministerstwo Rozwoju Regionalnego, 2003
- ^ World Urbanization Prospects - United Nations - Department of Economic and Social Affairs / Population Division, The 2003 Revision (data of 2000)
- ^ Demographia.com - World Urban Areas
- ^ Thomas Brinkoff, Principal Agglomerations of the World, accessed on 2009-03-12. Data for 2009-01-01.
- ^ Funkcje Metropolitalne Pięciu Stolic Województw Wschodnich
- ^ "Społeczne i polityczne zróżnicowanie aglomeracji w Polsce" - Paweł Swianiewicz, Urszula Klimska; University of Warsaw 2005
- ^ Data of polycentric Silesian metropolitan area
- ^ - Information on Social and Economic Situation of Poland in the 1st half of the year 2010
- ^ UNHRC "Central Europe: More Asylum Seekers, Less Refugees"
- ^ UNHRC Asylum Trends 2007-2009
- ^ a b [1]
See also
- Health in Poland
External links
- Central Statistical Office for the Republic of Poland
- Commonwealth of Diverse Cultures: Poland's Heritage
- CIA World Factbook 2004
- Helsinki Foundation for Human Rights
- Poland - Population and ethnic composition
- Armenians in Poland
- Poland's president expresses regret over 1947 Akcja Wisla
- INTEREG
Poland topicsDemographics of Europe Sovereign
states- Albania
- Andorra
- Armenia
- Austria
- Azerbaijan
- Belarus
- Belgium
- Bosnia and Herzegovina
- Bulgaria
- Croatia
- Cyprus
- Czech Republic
- Denmark
- Estonia
- Finland
- France
- Georgia
- Germany
- Greece
- Hungary
- Iceland
- Ireland
- Italy
- Kazakhstan
- Latvia
- Liechtenstein
- Lithuania
- Luxembourg
- Macedonia
- Malta
- Moldova
- Monaco
- Montenegro
- Netherlands
- Norway
- Poland
- Portugal
- Romania
- Russia
- San Marino
- Serbia
- Slovakia
- Slovenia
- Spain
- Sweden
- Switzerland
- Turkey
- Ukraine
- United Kingdom
- (England
- Northern Ireland
- Scotland
- Wales)
- Vatican City
States with limited
recognition- Abkhazia
- Kosovo
- Nagorno-Karabakh
- Northern Cyprus
- South Ossetia
- Transnistria
Dependencies
and other territories- Åland
- Faroe Islands
- Gibraltar
- Guernsey
- Jan Mayen
- Jersey
- Isle of Man
- Svalbard
Other entities - European Union
Categories:
Wikimedia Foundation. 2010.