- Nuclear magnetic resonance spectroscopy of proteins
-
Nuclear magnetic resonance spectroscopy of proteins (usually abbreviated protein NMR) is a field of structural biology in which NMR spectroscopy is used to obtain information about the structure and dynamics of proteins. The field was pioneered by Richard R. Ernst and Kurt Wüthrich[1], among others. Protein NMR techniques are continually being used and improved in both academia and the biotech industry. Structure determination by NMR spectroscopy usually consists of several following phases, each using a separate set of highly specialized techniques. The sample is prepared, resonances are assigned, restraints are generated and a structure is calculated and validated.
Contents
Sample preparation
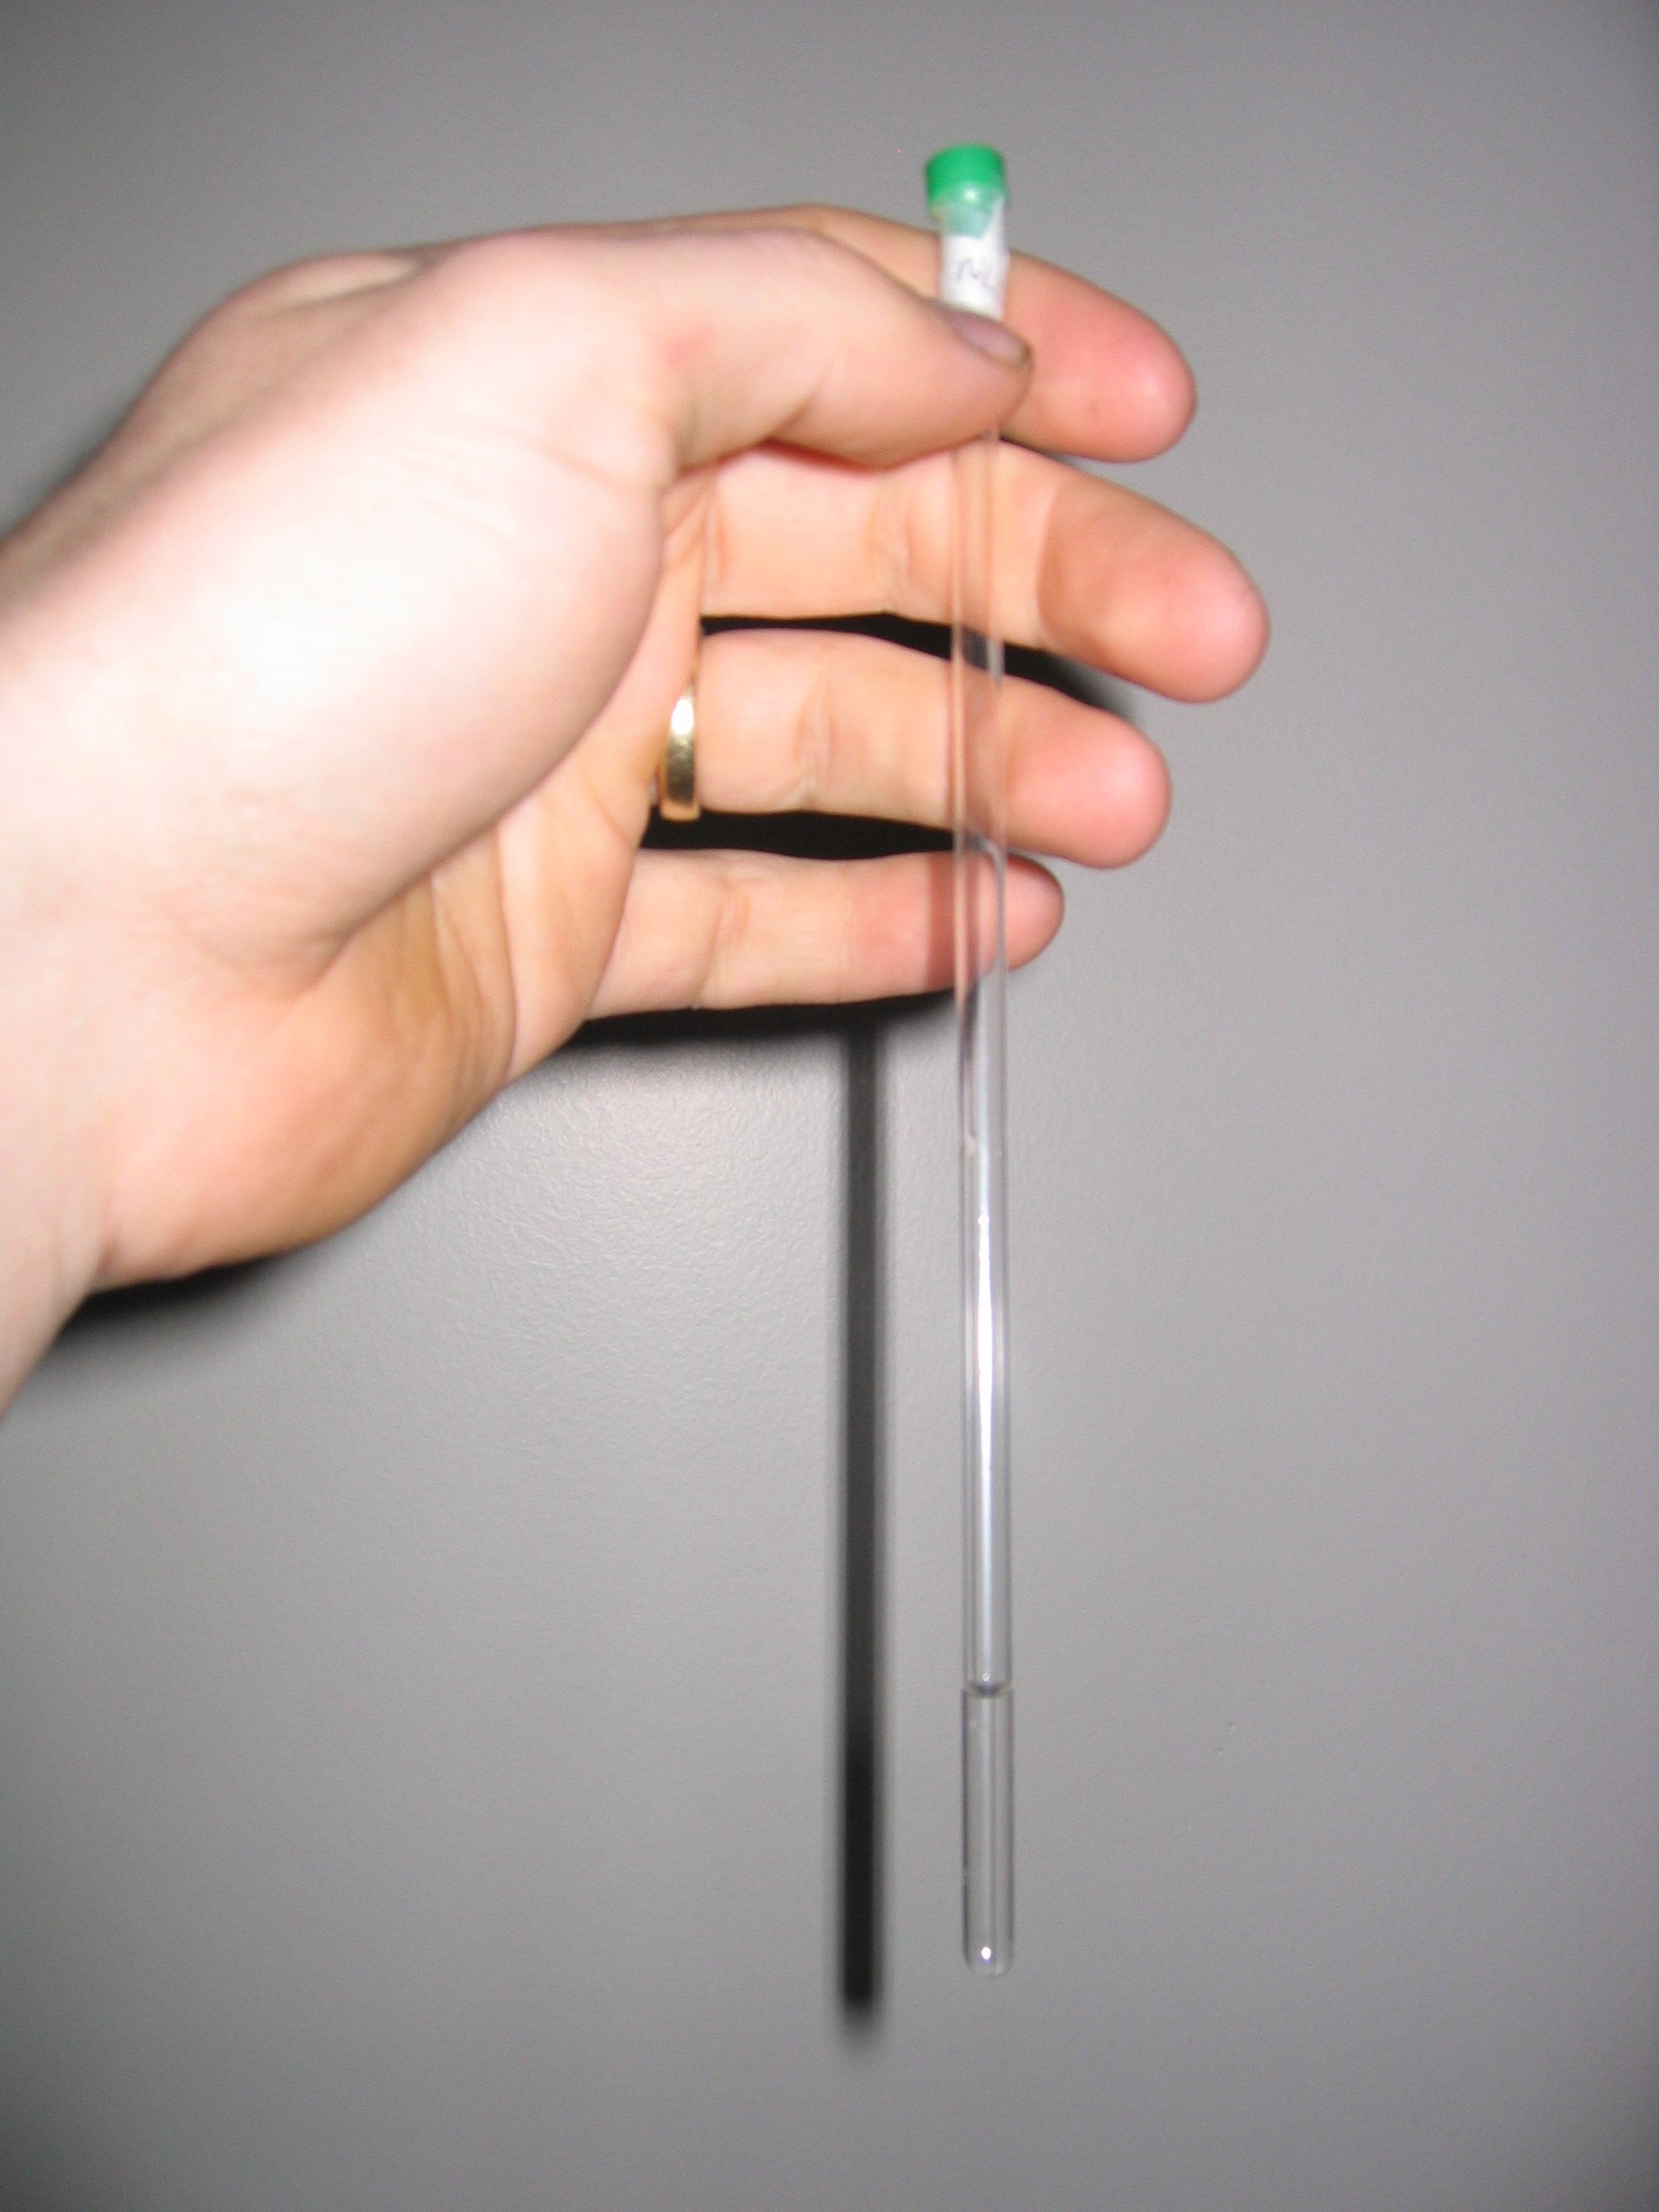
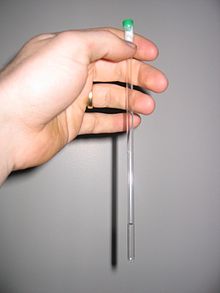 The NMR sample is prepared in a thin walled glass tube.
Protein nuclear magnetic resonance is performed on aqueous samples of highly purified protein. Usually the sample consist of between 300 and 600 microlitres with a protein concentration in the range 0.1 – 3 millimolar. The source of the protein can be either natural or produced in an expression system using recombinant DNA techniques through genetic engineering. Recombinantly expressed proteins are usually easier to produce in sufficient quantity, and makes isotopic labelling possible.
The purified protein is usually dissolved in a buffer solution and adjusted to the desired solvent conditions. The NMR sample is prepared in a thin walled glass tube.
Data collection
Protein NMR utilizes multidimensional nuclear magnetic resonance experiments to obtain information about the protein. Ideally, each distinct nucleus in the molecule experiences a distinct chemical environment and thus has a distinct chemical shift by which it can be recognized. However, in large molecules such as proteins the number of resonances can typically be several thousand and a one-dimensional spectrum inevitably has incidental overlaps. Therefore multidimensional experiments are performed which correlate the frequencies of distinct nuclei. The additional dimensions decrease the chance of overlap and have a larger information content since they correlate signals from nuclei within a specific part of the molecule. Magnetization is transferred into the sample using pulses of electromagnetic (radiofrequency) energy and between nuclei using delays; the process is described with so-called pulse sequences. Pulse sequences allow the experimenter to investigate and select specific types of connections between nuclei. The array of nuclear magnetic resonance experiments used on proteins fall in two main categories — one where magnetization is transferred through the chemical bonds, and one where the transfer is through space, irrespective of the bonding structure. The first category is used to assign the different chemical shifts to a specific nucleus, and the second is primarily used to generate the distance restraints used in the structure calculation, and in the assignment with unlabelled protein.
Depending on the concentration of the sample, on the magnetic field of the spectrometer, and on the type of experiment, a single multidimensional nuclear magnetic resonance experiment on a protein sample may take hours or even several days to obtain suitable signal-to-noise ratio through signal averaging, and to allow for sufficient evolution of magnetization transfer through the various dimensions of the experiment. Other things being equal, higher-dimensional experiments will take longer than lower-dimensional experiments.
Typically the first experiment to be measured with an isotope-labelled protein is a 2D heteronuclear single quantum correlation (HSQC) spectrum where "heteronuclear" refers to nuclei other than 1H. In theory the heteronuclear single quantum correlation has one peak for each H bound to a heteronucleus. Thus in the 15N-HSQC one signal is expected for each amino acid residue with the exception of proline which has no amide-hydrogen due to the cyclic nature of its backbone. Tryptophan and certain other residues with N-containing sidechains also give rise to additional signals. The 15N-HSQC is often referred to as the fingerprint of a protein because each protein has a unique pattern of signal positions. Analysis of the 15N-HSQC allows researchers to evaluate whether the expected number of peaks is present and thus to identify possible problems due to multiple conformations or sample heterogeneity. The relatively quick heteronuclear single quantum correlation experiment helps determine the feasibility of doing subsequent longer, more expensive, and more elaborate experiments. It is not possible to assign peaks to specific atoms from the heteronuclear single quantum correlation alone.
Resonance assignment
In order to analyze the nuclear magnetic resonance data, it is important to get a resonance assignment for the protein. That is to find out which chemical shift corresponds to which atom. This is typically achieved by sequential walking using information derived from several different types of NMR experiment. The exact procedure depends on whether the protein is isotopically labelled or not, since a lot of the assignment experiments depend on carbon-13 and nitrogen-15.
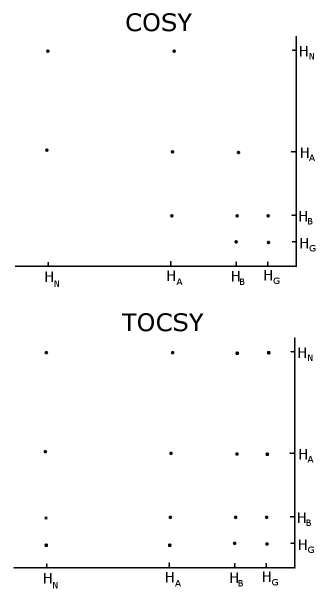
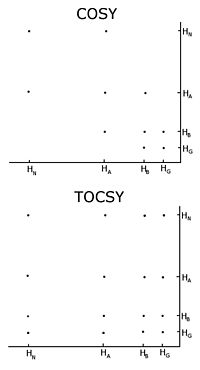 Comparison of a COSY and TOCSY 2D spectra for an amino acid like glutamate or methionine. The TOCSY shows off diagonal crosspeaks between all protons in the spectrum, but the COSY only has crosspeaks between neighbours.
Homonuclear nuclear magnetic resonance
With unlabelled protein the usual procedure is to record a set of two dimensional homonuclear nuclear magnetic resonance experiments through correlation spectroscopy (COSY), of which several types include conventional correlation spectroscopy, total correlation spectroscopy (TOCSY) and nuclear Overhauser effect spectroscopy (NOESY).[1] A two-dimensional nuclear magnetic resonance experiment produces a two-dimensional spectrum. The units of both axes are chemical shifts. The COSY and TOCSY transfer magnetization through the chemical bonds between adjacent protons. The conventional correlation spectroscopy experiment is only able to transfer magnetization between protons on adjacent atoms, whereas in the total correlation spectroscopy experiment the protons are able to relay the magnetization, so it is transferred among all the protons that are connected by adjacent atoms. Thus in a conventional correlation spectroscopy, an alpha proton transfers magnetization to the beta protons, the beta protons transfers to the alpha and gamma protons, if any are present, then the gamma proton transfers to the beta and the delta protons, and the process continues. In total correlation spectroscopy, the alpha and all the other protons are able to transfer magnetization to the beta, gamma, delta, epsilon if they are connected by a continuous chain of protons. The continuous chain of protons are the sidechain of the individual amino acids. Thus these two experiments are used to build so called spin systems, that is build a list of resonances of the chemical shift of the peptide proton, the alpha protons and all the protons from each residue’s sidechain. Which chemical shifts corresponds to which nuclei in the spin system is determined by the conventional correlation spectroscopy connectivities and the fact that different types of protons have characteristic chemical shifts. To connect the different spinsystems in a sequential order, the nuclear Overhauser effect spectroscopy experiment has to be used. Because this experiment transfers magnetization through space, it will show crosspeaks for all protons that are close in space regardless of whether they are in the same spin system or not. The neighbouring residues are inherently close in space, so the assignments can be made by the peaks in the NOESY with other spin systems.
One important problem using homonuclear nuclear magnetic resonance is overlap between peaks. This occurs when different protons have the same or very similar chemical shifts. This problem becomes greater as the protein becomes larger, so homonuclear nuclear magnetic resonance is usually restricted to small proteins or peptides.
Nitrogen-15 nuclear magnetic resonance
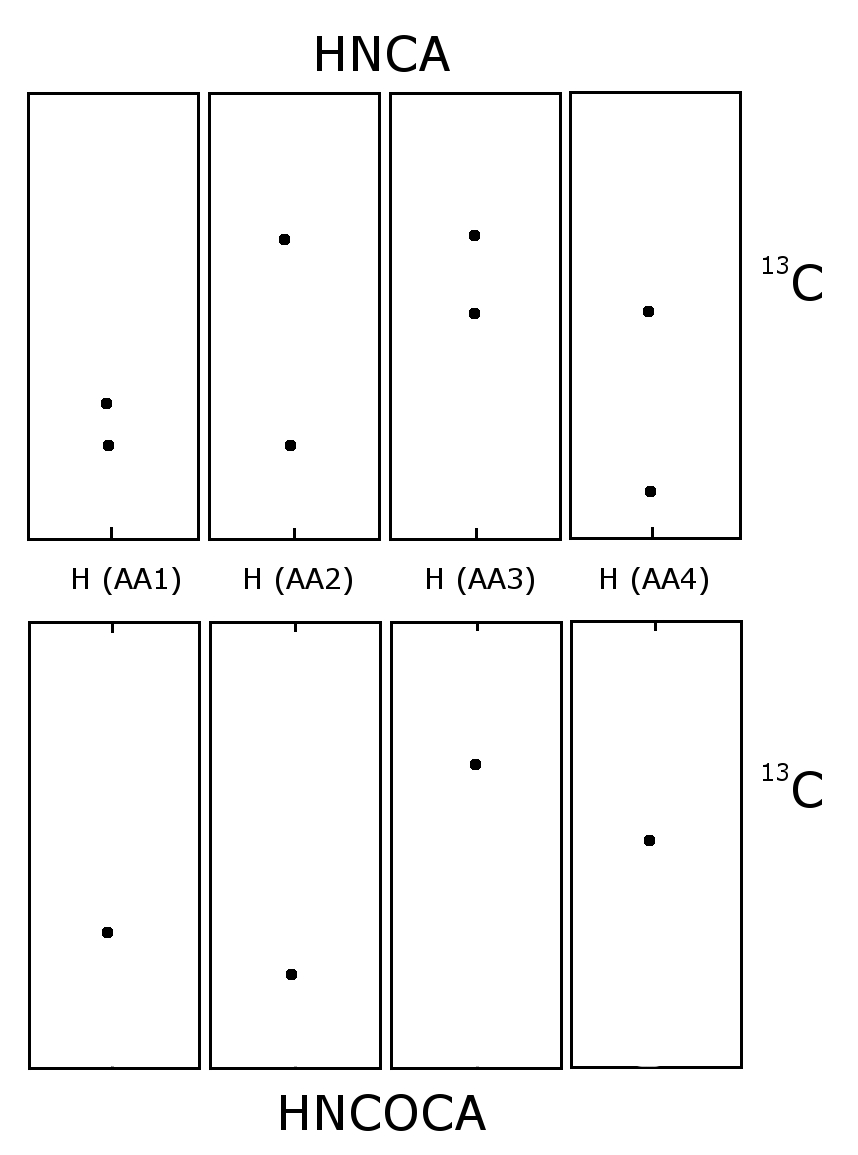
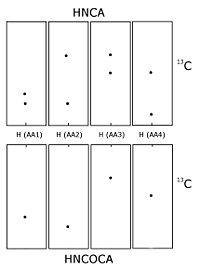 Schematic of an HNCA and HNCOCA for four sequential residues. The nitrogen-15 dimension is perpendicular to the screen. Each window is focused on the nitrogen chemical shift of that amino acid. The sequential assignment is made by matching the alpha carbon chemical shifts. In the HNCA each residue sees the alpha carbon of it self and the preceding residue. The HNCOCA only sees the alpha carbon of the preceding residue.
Carbon-13 and nitrogen-15 nuclear magnetic resonance
When the protein is labelled with carbon-13 and nitrogen-15 it is possible to record experiments that transfers magnetisation over the peptide bond, and thus connect different spin systems through bonds. This is usually done using some of the following experiments, HNCO, HN(CA)CO, HNCA,[2] HN(CO)CA, HNCACB and CBCA(CO)NH. All six experiments consist of a 1H-15N plane (similar to a HSQC spectrum) expanded with a carbon dimension. In the HN(CA)CO, each HN plane contains the peaks from the carbonyl carbon from its residue as well the preceding one in the sequence. The HNCO contains the carbonyl carbon chemical shift from only the preceding residue, but is much more sensitive than HN(CA)CO. These experiments allow each 1H-15N peak to be linked to the preceding carbonyl carbon, and sequential assignment can then be undertaken by matching the shifts of each spin system's own and previous carbons. The HNCA and HN(CO)CA works similarly, just with the alpha carbons (Cα) rather than the carbonyls, and the HNCACB and the CBCA(CO)NH contains both the alpha carbon and the beta carbon (Cβ). Usually several of these experiments are required to resolve overlap in the carbon dimension. This procedure is usually less ambiguous than the NOESY based method, since it is based on through bond transfer. In the NOESY-based methods additional peaks that are close in space but not belonging to the sequential residues will appear confusing the assignment process. When the sequential assignment has been done it is usually possible to extend the assignment from the Cα and Cβ to the rest of the sidechain using experiments such as HCCH-TOCSY, which is basically a TOCSY experiment resolved in an additional carbon dimension.
Restraint generation
In order to make structure calculations a number of experimentally determined restraints have to be generated. These fall into different categories, the most widely used is distance restraints and angle restraints.
Distance restraints
A crosspeak in a NOESY experiment signifies spatial proximity between the two nuclei in question. Thus each peak can be converted in to a maximum distance between the nuclei, usually between 1,8 and 6 angstroms. The intensity of a noesy peak is proportional to the distance to the minus 6th power, so the distance is determined according to intensity of the peak. The intensity-distance relationship is not exact, so usually a distance range is used.
It is of great importance to assign the noesy peaks to the correct nuclei based on the chemical shifts. If this task is performed manually it is usually very labor intensive, since proteins usually have thousands of noesy peaks. Some computer programs such as UNIO,[3] CYANA[4] and ARIA[5]/CNS perform this task automatically on manually pre-processed listings of peak positions and peak volumes, coupled to a structure calculation. Direct access to the raw NOESY data without the cumbersome need of iteratively refined peak lists is so far only granted by the ATNOS/CANDID approach implemented in the UNIO software package [3] and thus indeed guarantees objective and efficient NOESY spectral analysis.
To obtain as accurate assignments as possible it is a great advantage to have access to carbon-13 and nitrogen-15 noesy experiments, since they help to resolve overlap in the proton dimension. This leads to faster and more reliable assignments, and in turn to better structures.
Angle restraints
In addition to distance restraints, restraints on the torsion angles of the chemical bonds, typically the psi and phi angles can be generated. One approach is to use the Karplus equation, to generate angle restraints from coupling constants. Another approach uses the chemical shifts to generate angle restraints. Both methods use the fact that the geometry around the alpha carbon affects the coupling constants and chemical shifts, so given the coupling constants or the chemical shifts, a qualified guess can be made about the torsion angles.
Orientation restraints
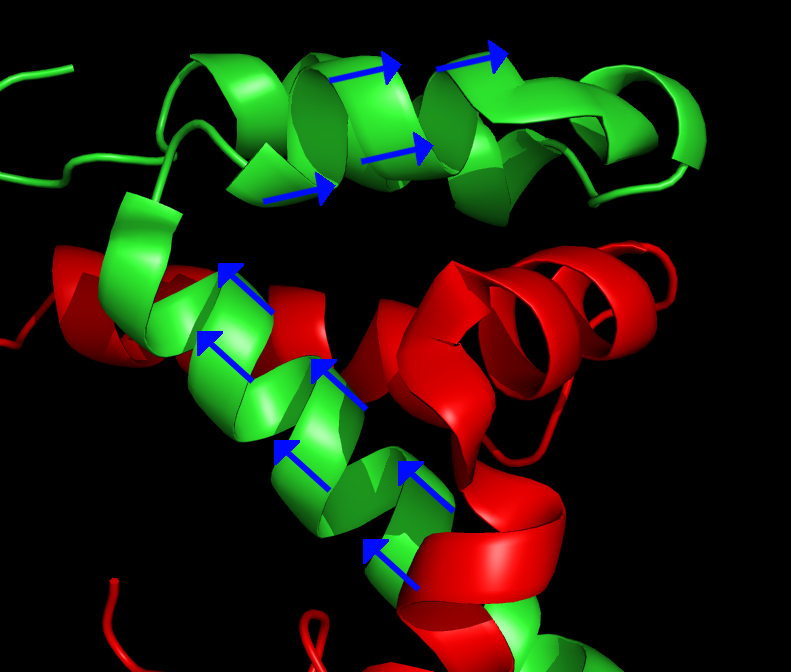
Main article: Residual dipolar coupling The blue arrows represent the orientation of the N – H bond of selected peptide bonds. By determining the orientation of a sufficient amount of bonds relative to the external magnetic field, the structure of the protein can be determined. From PDB record 1KBH
The analyte molecules in a sample can be partially ordered with respect to the external magnetic field of the spectrometer by manipulating the sample conditions. Common techniques include addition of bacteriophages or bicelles to the sample, or preparation of the sample in a stretched polyacrylamide gel. This creates a local environment that favours certain orientations of nonspherical molecules. Normally in solution NMR the dipolar couplings between nuclei are averaged out because of the fast tumbling of the molecule. The slight overpopulation of one orientation means that a residual dipolar coupling remains to be observed. The dipolar coupling is commonly used in solid state NMR and provides information about the relative orientation of the bond vectors relative to a single global reference frame. Typically the orientation of the N-H vector is probed in a HSQC like experiment. Initially residual dipolar couplings were used for refinement of previously determined structures, but attempts at de novo structure determination have also been made.[6]
Hydrogen–deuterium exchange
Main article: Hydrogen–deuterium exchangeNMR spectroscopy is nucleus specific. Thus it can distinguish between hydrogen and deuterium. The amide protons in the protein exchange readily with the solvent, and if the solvent contains a different isotope, typically deuterium, the reaction can be monitored by NMR spectroscopy. How rapidly a given amide exchanges reflects its solvent accessibility. Thus amide exchange rates can give information on which parts of the protein are buried, hydrogen bonded etc. A common application is to compare the exchange of a free form versus a complex. The amides that become protected in the complex, are assumed to be in the interaction interface.
Structure calculation
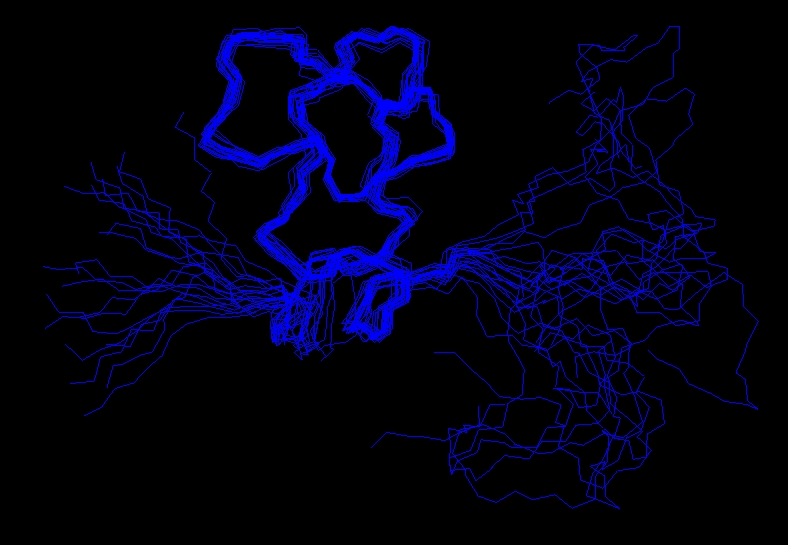
The experimentially determined restraints can be used as input for the structure calculation process. Researchers, using computer programs such as CYANA (Software) or XPLOR-NIH,[7] attempt to satisfy as many of the restraints as possible, in addition to general properties of proteins such as bond lengths and angles. The algorithms convert the restraints and the general protein properties into energy terms, and thus tries to minimize the energy. The process results in an ensemble of structures that, if the data were sufficient to dictate a certain fold, will converge.
Dynamics
In addition to structures, nuclear magnetic resonance can yield information on the dynamics of various parts of the protein. This usually involves measuring relaxation times such as T1 and T2 to determine order parameters, correlation times, and chemical exchange rates. NMR relaxation is a consequence of local fluctuating magnetic fields within a molecule. Local fluctuating magnetic fields are generated by molecular motions. In this way measurements of relaxation times can provide information of motions within a molecule on the atomic level. In NMR studies of protein dynamics the nitrogen-15 isotope is the preferred nucleus to study because its relaxation times are relatively simple to relate to molecular motions This however requires isotope labeling of the protein. The T1 and T2 relaxation times can be measured using various types of HSQC based experiments. The types of motions which can be detected are motions that occur on a time-scale ranging from about 10 picoseconds to about 10 nanoseconds. In addition slower motions, which take place on a time-scale ranging from about 10 microseconds to 100 milliseconds, can also be studied. However, since nitrogen atoms are mainly found in the backbone of a protein, the results mainly reflect the motions of the backbone, which is the most rigid part of a protein molecule. Thus, the results obtained from nitrogen-15 relaxation measurements may not be representative for the whole protein. Therefore techniques utilizing relaxation measurements of carbon-13 and deuterium have recently been developed, which enables systematic studies of motions of the amino acid side chains in proteins.
NMR spectroscopy on large proteins
Traditionally nuclear magnetic resonance spectroscopy has been limited to relatively small proteins or protein domains. This is in part caused by problems resolving overlapping peaks in larger proteins, but this has been alleviated by the introduction of isotope labelling and multidimensional experiments. Another more serious problem is the fact that in large proteins the magnetization relaxes faster, which means there is less time to detect the signal. This in turn causes the peaks to become broader and weaker, and eventually disappear. Two techniques have been introduced to attenuate the relaxation: transverse relaxation optimized spectroscopy (TROSY)[8] and deuteration[9] of proteins. By using these techniques it has been possible to study proteins in complex with the 900 kDa chaperone GroES-GroEL.[10]
Automation of the process
Structure determination by NMR has traditionally been a time consuming process, requiring interactive analysis of the data by a highly trained scientist. There has been a considerable interest in automating the process to increase the throughput of structure determination and to make protein NMR accessible to non-experts (See structural genomics). The two most time consuming processes involved are the sequence-specific resonance assignment (backbone and side-chain assignment) and the NOE assignment tasks. Several different computer programs have been published that target individual parts of the overall NMR structure determination process in an automated fashion. Most progress has been achieved for the task of automated NOE assignment. So far, only the FLYA and the UNIO approach were proposed to perform the entire protein NMR structure determination process in an automated manner without any human intervention.[3][4] Efforts have also been made to standardize the structure calculation protocol to make it quicker and more amenable to automation.[11]
See also
- Nuclear magnetic resonance spectroscopy of carbohydrates
- X-ray crystallography
- Nuclear magnetic resonance
- NMR spectroscopy
- Protein crystallization
- Protein dynamics
References
Citations
- ^ Wüthrich K (December 1990). "Protein structure determination in solution by NMR spectroscopy". J. Biol. Chem. 265 (36): 22059–62. PMID 2266107.
- ^ Bax A, Ikura M (May 1991). "An efficient 3D NMR technique for correlating the proton and 15N backbone amide resonances with the alpha-carbon of the preceding residue in uniformly 15N/13C enriched proteins". J. Biomol. NMR 1 (1): 99–104. doi:10.1007/BF01874573. PMID 1668719.
- ^ a b c Herrmann T (2010). "Protein structure calculation and automated NOE restraints". Encycl. Magn. Res.. doi:10.1002/9780470034590.emrstm1151.
- ^ a b Güntert P (2004). "Automated NMR structure calculation with CYANA". Methods Mol. Biol. 278: 353–78. doi:10.1385/1-59259-809-9:353. PMID 15318003.
- ^ Rieping W, Habeck M, Bardiaux B, Bernard A, Malliavin TE, Nilges M (February 2007). "ARIA2: automated NOE assignment and data integration in NMR structure calculation". Bioinformatics 23 (3): 381–2. doi:10.1093/bioinformatics/btl589. PMID 17121777.
- ^ de Alba E, Tjandra N (2004). "Residual dipolar couplings in protein structure determination". Methods Mol. Biol. 278: 89–106. doi:10.1385/1-59259-809-9:089. PMID 15317993.
- ^ Schwieters CD, Kuszewski JJ, Tjandra N, Clore GM (January 2003). "The Xplor-NIH NMR molecular structure determination package". J. Magn. Reson. 160 (1): 65–73. Bibcode 2003JMagR.160...65S. doi:10.1016/S1090-7807(02)00014-9. PMID 12565051.
- ^ Pervushin K, Riek R, Wider G, Wüthrich K (November 1997). "Attenuated T2 relaxation by mutual cancellation of dipole-dipole coupling and chemical shift anisotropy indicates an avenue to NMR structures of very large biological macromolecules in solution". Proc. Natl. Acad. Sci. U.S.A. 94 (23): 12366–71. Bibcode 1997PNAS...9412366P. doi:10.1073/pnas.94.23.12366. PMC 24947. PMID 9356455. http://www.pubmedcentral.nih.gov/articlerender.fcgi?tool=pmcentrez&artid=24947.
- ^ Markus MA, Dayie KT, Matsudaira P, Wagner G (October 1994). "Effect of deuteration on the amide proton relaxation rates in proteins. Heteronuclear NMR experiments on villin 14T". J Magn Reson B 105 (2): 192–5. doi:10.1006/jmrb.1994.1122. PMID 7952934.
- ^ Fiaux J, Bertelsen EB, Horwich AL, Wüthrich K (July 2002). "NMR analysis of a 900K GroEL GroES complex". Nature 418 (6894): 207–11. doi:10.1038/nature00860. PMID 12110894.
- ^ Liu G, Shen Y, Atreya HS, et al. (July 2005). "NMR data collection and analysis protocol for high-throughput protein structure determination". Proc. Natl. Acad. Sci. U.S.A. 102 (30): 10487–92. Bibcode 2005PNAS..10210487L. doi:10.1073/pnas.0504338102. PMC 1180791. PMID 16027363. http://www.pubmedcentral.nih.gov/articlerender.fcgi?tool=pmcentrez&artid=1180791.
General references
- T. Kevin Hitchens; Gordon S. Rule (2005). Fundamentals of Protein NMR Spectroscopy (Focus on Structural Biology). Berlin: Springer. ISBN 1-4020-3499-7. http://www.springer.com/1-4020-3499-7.
- Quincy Teng (2005). Structural biology: practical NMR applications. Berlin: Springer. ISBN 0-387-24367-4.
- Mark Rance; Cavanagh, John; Wayne J. Fairbrother; Arthur W. Hunt III; Skelton, NNicholas J. (2007). Protein NMR spectroscopy: principles and practice (2nd ed.). Boston: Academic Press. ISBN 0-12-164491-X.
- Kurt Wüthrich (1986). NMR of proteins and nucleic acids. New York: Wiley. ISBN 0-471-82893-9.
External links
- NOESY-Based Strategy for Assignments of Backbone and Side Chain Resonances of Large Proteins without Deuteration (a protocol)
- ProSA-web Web service for the recognition of errors in experimentally or theoretically determined protein structures
- Protein NMR Protein NMR experiments
Protein structural analysis High resolution Medium resolution Fiber diffraction | Mass spectrometry | SAXSSpectroscopic Translational Diffusion Rotational Diffusion Chemical Thermodynamic Computational ←Tertiary structure
Wikimedia Foundation. 2010.