- Demographics of Moldova
-
This article is about the demographic features of the population of Moldova, including distribution, ethnicity, languages, religious affiliation and other statistical data.
Contents
Overview of the demographic statistics
Demographics of Moldova  Population in millions, 1950–January 2009. (Note: Data after 1997 doesn't include regions under the control of Transnistria).
Population: 3,560,430[1] (2011) Density: 127.8 Growth rate: -0.088 (2010) Birth rate: 11.4 births/1,000 population
(2010)Death rate: 12.3 deaths/1,000 population
(2010)Life expectancy: 69.11 years (2010 est.) –male: 65.00 years
(2010 est.)–female: 73.41 years
(2010 est.)Fertility rate: 1.31 children born/woman
(2010)Infant mortality rate: 11.7 deaths/1,000 live births (2010 est.)
Male: 13.8 deaths/1,000 live births
Female: 9.5 deaths/1,000 live birthsNet migration rate: -1.13 migrant(s)/1,000 population (2005 est.), down from -0.25 in 2005 Age structure: 0-14 years: 16.4%
(male 301,150/female 284,400)15-64 years: 73.6%
(male 1,277,900/female 1,341,650)65-over: 10.0%
(male 133,060/female 222,270)Sex ratio: Total: 0.91 male(s)/female (2008 est.) At birth: 1.06 male(s)/female Under 15: 1.06 male(s)/female 15-64 years: 0.94 male(s)/female 65-over: 0.59 male(s)/female Nationality: Nationality: Moldovan(s) Major ethnic: Moldovans 75.8%[2] Minor ethnic: Ukrainians 8.4%, Russians 5.8%, Gagauz 4.4%, Bulgarians 1.9% Language: Official: Romanian Spoken: Moldovan/Romanian, Russian, Gagauz (a Turkish dialect) According to the 2004 Moldovan Census, 3,383,332 people lived in the areas controlled by the central government of Moldova. According to the 2004 Census in Transnistria, 555,347 people lived in the breakaway Transnistria, including the city of Bender, and the other localities de facto controlled by Transnistrian authorities. Thus, the total population of the country in 2004 amounted to 3,938,679.
 Demographics of Moldova, data of FAO, 2005; number of inhabitants in thousands.
Median age –total 34.3 years (2008 est.)
(up from 32.22 years in 2005)–male 32.4 years
(up from 30.14 years in 2005)–female 36.4 years
(up from 34.27 years in 2005)Literacy rate –total 96% (1989); 99.1% (2003); 99.1% (2005) –male 99% (1989); 99.6% (2003); 99.7% (2005) –female 94% (1989); 98.7% (2003); 98.6% (2005) –definition age 15 and over can read and write Unemployment rate 8% (official), 40% (real) Source: The World Factbook, CIA;[3] UN[4],[5] Urban-rural distribution of population
By district
no type name population urban rural population % cities population % communes 1 municipality Chişinău 712,218 644,204 90.45% 7 68,014 9.55% 12 2 municipality Bălţi 127,561 122,669 96.16% 1 4,892 3.84% 2 3 auton.territ.unit Găgăuzia 155,646 58,190 37.39% 3 97,456 62.61% 23 4 district Anenii Noi 81,710 8,358 10.23% 1 73,352 89.77% 25 5 district Basarabeasca 28,978 11,192 38.62% 1 17,786 61.38% 6 6 district Briceni 78,027 14,230 18.24% 2 63,797 81.76% 26 7 district Cahul 119,231 35,488 29.76% 1 83,743 70.24% 36 8 district Cantemir 60,001 3,872 6.45% 1 56,129 93.55% 26 9 district Călăraşi 75,075 14,516 19.34% 1 60,559 80.66% 27 10 district Căuşeni 90,612 21,941 24.21% 2 68,671 75.79% 25 (out of 28) 11 district Cimişlia 60,925 12,858 21.10% 1 48,067 78.90% 22 12 district Criuleni 72,254 7,138 9.88% 1 65,116 90.12% 24 13 district Donduşeni 46,442 9,801 21.10% 1 36,641 78.90% 21 14 district Drochia 87,092 16,606 19.07% 1 70,486 80.93% 27 15 district Dubăsari 43,015 - - - 34,015 100% 11 16 district Edineţ 81,390 23,065 % 2 58,325 % 30 17 district Făleşti 90,320 14,931 % 1 75,389 % 32 18 district Floreşti 89,389 17,086 % 3 17,086 % 37 19 district Glodeni 60,975 10,465 % 1 50,510 % 18 20 district Hînceşti 119,762 15,281 % 1 104,481 % 38 21 district Ialoveni 97,704 15,041 % 1 82,663 % 24 22 district Leova 51,056 14,411 % 2 36,645 % 23 23 district Nisporeni 64,924 12,105 % 1 52,819 % 22 24 district Ocniţa 56,510 19,270 % 3 37,240 % 18 25 district Orhei 116,271 25,641 % 1 90,630 % 37 26 district Rezina 48,105 10,196 % 1 37,909 % 24 27 district Rîşcani 69,454 13,351 % 2 56,103 % 26 28 district Sîngerei 87,153 15,760 % 2 71,393 % 24 29 district Soroca 94,986 28,362 % 1 66,624 % 34 30 district Străşeni 88,900 19,633 % 2 69,267 % 25 31 district Şoldăneşti 42,227 6,304 % 1 35,923 % 22 32 district Ştefan Vodă 70,594 7,768 % 1 62,826 % 22 33 district Taraclia 43,154 13,756 % 1 29,398 % 14 34 district Teleneşti 70,126 6,855 % 1 63,271 % 30 35 district Ungheni 110,545 35,311 % 2 75,234 % 31 Subtotal control by central government 3,383,332 1,305,655 38.59% 54 2,077,677 61.41% 844 36 territorial unit Transnistria 439,528 280,6401 63.85% 10 158,8881 36.15% 69 37 municipality Bender 100,169 97,027 96.86% 1 3,142 3.14% 1 10 parts of district Căuşeni 14,935 - - - 14,935 100% 3 (out of 28) 15 parts of district Dubăsari 715 - - - 715 100% parts of 1 Subtotal control by breakaway Tiraspol 555,347 377,667 68.01% 11 177,680 31.99% 73 Total 3,938,679 1,683,322 42.74% 65 2,255,357 57.26% 917 Note: 1The breakaway Transnistrian authorities count as rural the population of the towns of Crasnoe, Maiac, and Tiraspolul Nou. Since their exact population isn't available, so does this table.
Transnistrian-controlled areas
Population urban rural population cities population communes Tiraspol 158,069 158,069 1 - - Camenca sub-district 27,284 10,323 1 16,961 12 Rîbniţa sub-district 82,699 53,648 1 29,051 22 Dubăsari sub-district 36,734 23,650 1 13,084 9 Grigoriopol sub-district 48,000 11,4731 2 36,5271 14 Slobozia sub-district 86,742 23,4772 4 63,2652 12 Subtotal Transnistria 439,528 280,640 10 158,888 69 Bender (w/o Proteagailovca) 97,027 97,027 1 - - Proteagailovca 3,142 - - 3,142 1 Gîsca 4,841 - - 4,841 1 Chiţcani (incl. Mereneşti and Zahorna) ~9,000 - - ~9,000 1 Cremenciug 1,094 - - 1,094 1 Roghi 715 - - 715 parts of 1 Subotal other localities 115,819 97,027 1 18,792 4 Total Tiraspol-controlled areas 555,347 377,667 11 177,680 73 Note:
1 The breakaway Transnistrian authorities have counties as urban only the population of the town of Grigoriopol, while that of the town of Maiac was counted as rural.
2 The breakaway Transnistrian authorities have counties as urban only the population of the towns of Slobozia and Dnestrovsc, while those of the towns of Crasnoe and Tiraspolul Nou were counted as rural.Vital Statistics[6][7]
Total area
Average population (x 1000) Live births Deaths Natural change Crude birth rate (per 1000) Crude death rate (per 1000) Natural change (per 1000) 1950 2 341 91 100 26 400 64 700 38.9 11.3 27.6 1951 2 381 91 700 26 000 65 700 38.5 10.9 27.6 1952 2 432 80 900 30 900 50 000 33.3 12.7 20.6 1953 2 491 79 100 23 300 55 800 31.8 9.4 22.4 1954 2 557 83 600 24 100 59 500 32.7 9.4 23.3 1955 2 627 79 800 21 900 57 900 30.4 8.3 22.0 1956 2 701 81 300 20 100 61 200 30.1 7.4 22.7 1957 2 777 85 700 21 100 64 600 30.9 7.6 23.3 1958 2 853 87 500 18 700 68 800 30.7 6.6 24.1 1959 2 929 92 200 21 500 70 700 31.5 7.3 24.1 1960 3 003 87 910 19 290 68 620 29.3 6.4 22.9 1961 3 073 86 683 19 590 67 093 28.2 6.4 21.8 1962 3 141 80 494 21 365 59 129 25.6 6.8 18.8 1963 3 208 78 422 20 737 57 685 24.4 6.5 18.0 1964 3 273 73 583 19 944 53 639 22.5 6.1 16.4 1965 3 335 67 996 20 571 47 425 20.4 6.2 14.2 1966 3 395 71 406 21 474 49 326 21.0 6.3 14.5 1967 3 453 71 380 23 406 47 294 20.7 6.8 13.7 1968 3 506 69 997 24 268 45 532 20.0 6.9 13.0 1969 3 549 67 575 26 249 40 651 19.0 7.4 11.5 1970 3 594 69 778 26 577 43 201 19.4 7.4 12.0 1971 3 647 73 643 27 889 45 754 20.2 7.6 12.5 1972 3 700 76 198 28 001 48 197 20.6 7.6 13.0 1973 3 748 76 339 30 756 45 583 20.4 8.2 12.2 1974 3 794 77 474 32 216 45 258 20.4 8.5 11.9 1975 3 839 79 169 35 635 43 534 20.6 9.3 11.3 1976 3 877 79 863 34 812 45 051 20.6 9.0 11.6 1977 3 910 79 022 37 250 41 772 20.2 9.5 10.7 1978 3 936 78 994 38 410 40 584 20.1 9.8 10.3 1979 3 967 80 152 41 729 38 423 20.2 10.5 9.7 1980 4 010 79 580 40 472 39 108 19.8 10.1 9.8 1981 4 054 82 279 41 476 40 803 20.3 10.2 10.1 1982 4 097 83 258 41 046 42 212 20.3 10.0 10.3 1983 4 137 91 304 44 329 46 975 22.1 10.7 11.4 1984 4 175 89 637 45 537 44 100 21.5 10.9 10.6 1985 4 214 90 453 46 075 44 378 21.5 10.9 10.5 1986 4 255 94 726 40 437 54 289 22.3 9.5 12.8 1987 4 290 91 762 40 185 51 577 21.4 9.4 12.0 1988 4 321 88 568 40 912 47 656 20.5 9.5 11.0 1989 4 349 82 221 40 113 42 108 18.9 9.2 9.7 1990 4 364 77 085 42 427 34 658 17.7 9.7 7.9 1991 4 363 72 020 45 849 26 171 16.5 10.5 6.0 1992 4 353 69 654 44 522 25 132 16.0 10.2 5.8 1993 4 350 66 179 46 637 19 542 15.2 10.7 4.5 1994 4 350 62 085 52 153 9 932 14.3 12.0 2.3 1995 4 340 56 411 52 969 3 442 13.0 12.2 0.8 1996 4 325 51 865 49 748 2 117 12.0 11.5 0.5 1997 4 311 51 286 51 138 148 11.9 11.9 0.0 1998 4 299 46 755 47 691 - 936 10.9 11.1 -0.2 1999 4 287 43 511 48 904 -5 393 10.1 11.4 -1.3 Moldova under the central government control
Average population (x 1000) Live births Deaths Natural change Crude birth rate (per 1000) Crude death rate (per 1000) Natural change (per 1000) 1997 3 654 45 583 42 957 2 626 12.5 11.8 0.7 1998 3 652 41 332 39 922 1 410 11.3 10.9 0.4 1999 3 647 38 501 41 315 -2 814 10.6 11.3 -0.8 2000 3 640 36 939 41 224 -4 285 10.1 11.3 -1.2 2001 3 631 36 448 40 075 -3 627 10.0 11.0 -1.0 2002 3 623 35 705 41 852 -6 147 9.9 11.6 -1.7 2003 3 613 36 471 43 079 -6 608 10.1 11.9 -1.8 2004 3 604 38 272 41 668 -3 396 10.6 11.6 -0.9 2005 3 595 37 695 44 689 -6 994 10.5 12.4 -1.9 2006 3 586 37 587 43 137 -5 550 10.5 12.0 -1.5 2007 3 577 37 973 43 050 -5 077 10.6 12.0 -1.4 2008 3 570 39 018 41 948 -2 930 10.9 11.7 -0.8 2009 3 566 40 809 42 122 -1 313 11.4 11.8 -0.4 2010 3 563 40 474 43 631 -3 157 11.4 12.3 -0.9 2011 Ethnic groups
Moldovans are the largest ethnic group in Moldova. According to the combined data of the census in the government controlled area and the census in Transnistria in 2004 they account for 69.6% of the country's population. The proportion of Ukrainians and Russians decreased considerably in comparison to the last Soviet census in 1989: from 13.8% to 11.2% and from 13.0% to 9.4% respectively. This is mostly due to emigration. Ukrainians mostly live in the east (Transnitria) and the north, while Russians mostly live in urban areas: 27% of all Russians live in Chişinău, 18% live in Tiraspol, 11% in Bender and 6% in Bălţi. The Gagauz people are the fourth-largest ethnic group (3.8% in 2004). Most of them live in the south of Moldova in the autonomous region of Gagauzia.
Total area
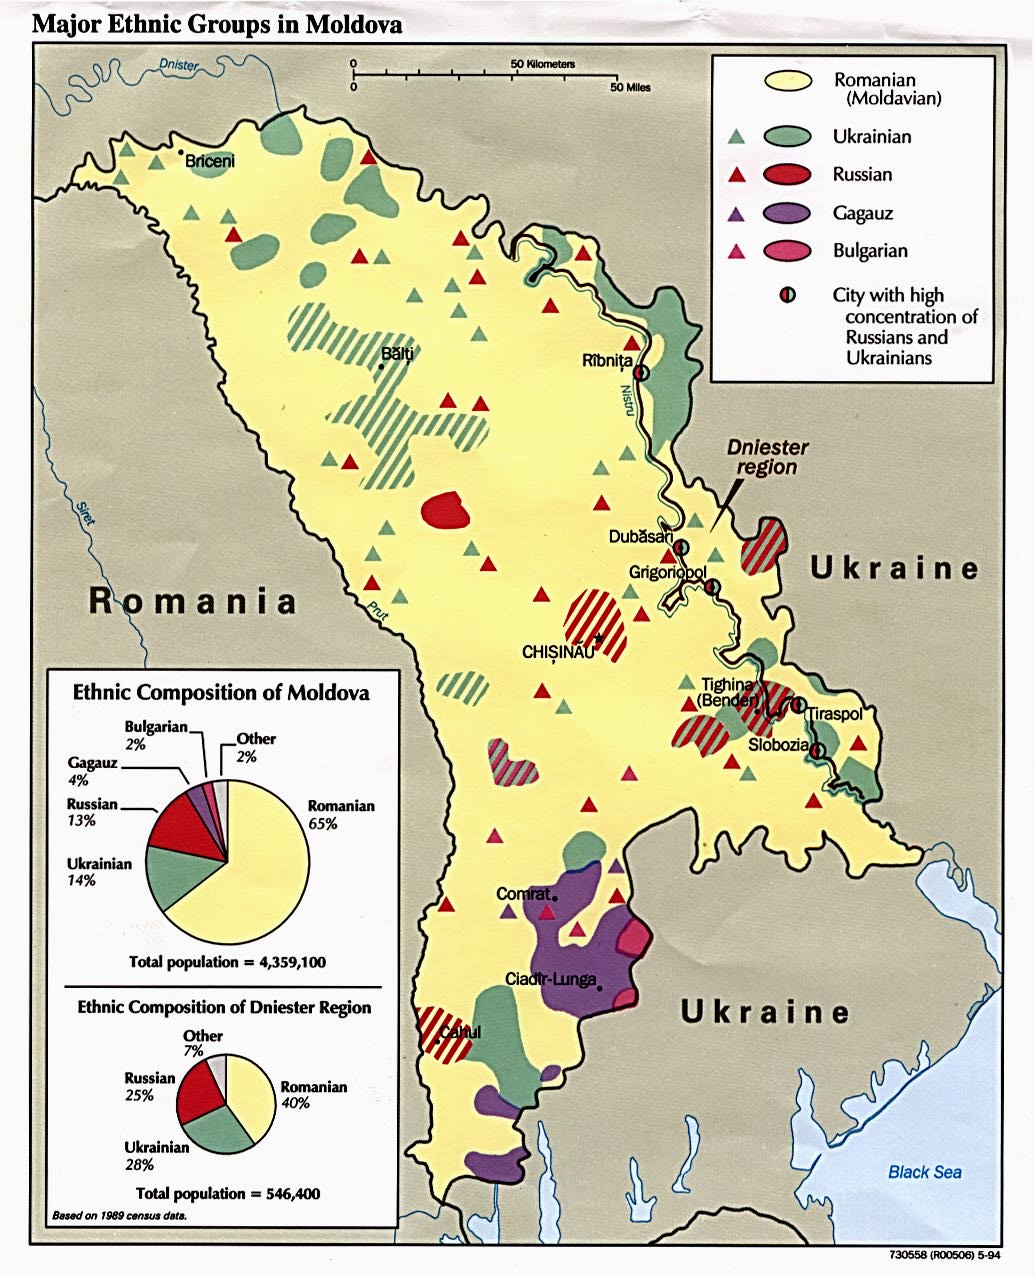
 Ethnic map of Moldova (2004 data)
Population of Moldova according to ethnic group 1959-2004 Ethnic
groupcensus 19591 census 19702 census 19793 census 19894 census 20045 Number % Number % Number % Number % Number % Moldovans6 1,886,566 65.4 2,303,916 64.6 2,525,687 63.9 2,794,749 64.5 2,742,231 69.6 Romanians 1,663 0.1 1,581 0.0 1,657 0.0 2,477 0.1 73,529 1.9 Ukrainians 420,820 14.6 506,560 14.2 560,679 14.2 600,366 13.8 442,475 11.2 Russians 292,930 10.2 414,444 11.6 505,730 12.8 562,069 13.0 369,896 9.4 Gagauzians 95,856 3.3 124,902 3.5 138,000 3.5 153,548 3.5 151,596 3.8 Bulgars 61,652 2.1 73,776 2.1 80,665 2.0 88,419 2.0 79,520 2.0 Romani 7,265 0.3 9,235 0.3 10,666 0.3 11,571 0.3 12,778 0.3 Jews 95,104 3.3 98,062 2.7 80,124 2.0 65,799 1.5 4,867 0.1 Poles 4,783 0.2 4,899 0.1 4,961 0.1 4,739 0.1 4,174 0.1 Others 17,838 0.6 31,498 0.9 41,587 1.1 51,623 1.2 57,613 1.5 Total 2,884,477 3,568,873 3,949,756 4,335,360 3,938,679 1 Source: [1]. 2 Source: [2]. 3 Source: [3]. 4 Source: [4]. 5 Combined population of the government controlled area and Transnistria 6 There is an ongoing controversy, whether Romanians and Moldovans should be counted together. Moldova under the central government control
Ethnic composition of the main part of Moldova, according to the 2004 census, was:
ethnic group total population urban rural population % population % population % Moldovans (Romanians) 2,638,125 1 77.98% 870,445 66.67% 1,767,680 85.08% Ukrainians 282,406 8.35% 145,890 11.17% 136,516 6.57% Russians 201,218 5.95% 166,395 12.74% 34,823 1.68% Gagauzians 147,500 4.36% 53,613 4.11% 93,887 4.52% Bulgarians 65,662 1.94% 29,447 2.26% 36,215 1.74% Gypsies 12,271 0.36% 8,139 0.62% 4,132 0.20% Jews 3,608 0.11% 3,509 0.27% 99 0.01% Poles 2,383 0.07% 2,019 0.15% 364 0.02% others and undeclared 30,157 0.89% 26,197 2.01% 3,960 0.19% Total 3,383,332 100% 1,305,655 100% 2,077,677 100% 1 including 73,276 (2.17%) Romanians Declared country of birth for the current inhabitants of the part of Moldova under the central government control, according to the 2004 census:
ethnic group total population urban rural total Moldova former USSR other countries non-declared total Moldova former USSR other countries non-declared total Moldova former USSR other countries non-declared Moldovans (Romanians) 2,638,125
100%2,604,051
98.71%30,360
1.15%3,345
0.13%369
0.01%870,445
100%848,554
%19,501
%2,081
%309
%1,767,680
100%1,755,497
%10,859
%1,264
%60
%Ukrainians 282,406
100%227,750
80.65%54,036
19.13%598
0.21%22
0.01%145,890
100%103,039
%42,318
%514
%19
%136,516
100%
%11,718
%84
%3
%Russians 201,218
100%129,664
64.44%70,380
34.98%1,096
0.54%78
0.04%166,395
100%106,580
%58,739
%1,011
%65
%34,823
100%23,084
%11,641
%85
%13
%Gagauzians 147,500
100%144,268
97.81%3,101
2.10%120
0.08%11
0.01%53,613
100%51,586
%1,941
%76
%10
%93,887
100%92,682
%1,160
%44
%1
%Bulgarians 65,662
100%59,489
90.60%5,968
9.09%199
0.30%6
0.01%29,447
100%25,215
%4,071
%156
%5
%36,215
100%34,274
%1,897
%43
%1
%others 34,401
100%22,702
65.99%10,797
31.39%894
2.60%8
0.02%26,058
100%16,973
%8,358
%722
%5
%8,343
100%5,729
%2,439
%172
%3
%non-declared 14,020
100%13,894
99.10%12
0.09%28
0.20%86
0.61%13,807
100%13,668
%9
%27
%83
%213
100%206
%3
%1
%3
%Total 3,383,332
100%3,201,818
94.64%174,654
5.16%6,280
0.19%580
0.02%1,305,655
100%1,165,635
89.28%134,937
10.33%4,587
0.35%496
0.04%2,077,677
100%2,036,183
98.00%39,717
1.91%1,693
0.08%84
0.004%Population by district, according to the 2004 census:
Population Moldovans1 Ukrainians Russians Gagauzians Bulgarians Romanians1 Jews Poles Gypsies others Chişinău 712,218 481,626 - 67.62%
58,945 - 8.28%
99,149 - 13.92%
6,446 - 0.91%
8,868 - 1.25%
31,984 - 4.49%
2,649 - 0.37%
834 - 0.12%
507 - 0.07%
21,210 - 2.98%
Bălţi 127,561 66,877 - 52.43%
30,288 - 23.74%
24,526 - 19.23%
243 - 0.19%
297 - 0.23%
2,258 - 1.77%
411 - 0.32%
862 - 0.68%
272 - 0.21%
1,527 - 1.20%
Gagauzia 155,646 7,481 - 4.81%
4,919 - 3.16%
5,941 - 3.82%
127,835 - 82.13%
8,013 - 5.15%
38 - 0.02%
17 - 0.01%
28 - 0.02%
486 - 0.31%
888 - 0.57%
Anenii Noi 81,710 68,761 - 84.15%
6,526 - 7.99%
4,135 - 5.06%
235 - 0.29%
481 - 0.59%
857 - 1.05%
17 - 0.02%
28 - 0.03%
228 - 0.28%
442 - 0.54%
Basarabeasca 28,978 20,218 - 69.77%
1,948 - 6.72%
2,568 - 8.86%
2,220 - 7.66%
1,544 - 5.33%
70 - 0.24%
13 - 0.04%
5 - 0.02%
216 - 0.75%
176 - 0.61%
Briceni 78,027 55,123 - 70.65%
19,939 - 25.55%
2,061 - 2.64%
59 - 0.08%
45 - 0.06%
314 - 0.40%
84 - 0.11%
10 - 0.01%
187 - 0.24%
205 - 0.26%
Cahul 119,231 91,001 - 76.32%
7,842 - 6.58%
7,702 - 6.46%
3,665 - 3.07%
5,816 - 4.88%
2,095 - 1.76%
40 - 0.03%
29 - 0.02%
238 - 0.20%
803 - 0.67%
Cantemir 60,001 52,986 - 88.31%
969 - 1.61%
710 - 1.18%
519 - 0.86%
3,736 - 6.23%
910 - 1.52%
- - 0%
11 - 0.02%
43 - 0.07%
117 - 0.19%
Călăraşi 75,075 69,190 - 92.16%
2,799 - 3.73%
947 - 1.26%
54 - 0.07%
47 - 0.06%
1,490 - 1.98%
21 - 0.03%
11 - 0.01%
378 - 0.50%
138 - 0.18%
Căuşeni 90,612 79,432 - 87.66%
2,469 - 2.72%
3,839 - 4.24%
653 - 0.72%
1,108 - 1.22%
2,844 - 3.14%
8 - 0.01%
9 - 0.01%
30 - 0.03%
220 - 0.24%
Cimişlia 60,925 52,972 - 86.95%
3,376 - 5.54%
2,371 - 3.89%
278 - 0.46%
1,341 - 2.20%
331 - 0.54%
7 - 0.01%
10 - 0.02%
95 - 0.16%
144 - 0.24%
Criuleni 72,254 67,046 - 92.79%
2,692 - 3.73%
1,008 - 1.40%
49 - 0.07%
72 - 0.10%
1,170 - 1.62%
6 - 0.01%
6 - 0.01%
36 - 0.05%
169 - 0.23%
Donduşeni 46,442 37,302 - 80.32%
5,893 - 12.69%
2,714 - 5.84%
31 - 0.07%
36 - 0.08%
247 - 0.53%
12 - 0.03%
15 - 0.03%
68 - 0.15%
124 - 0.27%
Drochia 87,092 74,369 - 85.39%
9,849 - 11.31%
1,641 - 1.88%
44 - 0.05%
33 - 0.04%
675 - 0.78%
14 - 0.02%
10 - 0.01%
272 - 0.31%
185 - 0.21%
Dubăsari 34,015 32,652 - 95.99%
521 - 1.53%
611 - 1.80%
45 - 0.13%
16 - 0.05%
102 - 0.30%
9 - 0.03%
2 - 0.01%
- - 0%
57 - 0.17%
Edineţ 81,390 58,749 - 72.18%
16,084 - 19.76%
5,084 - 6.25%
143 - 0.18%
91 - 0.11%
446 - 0.55%
23 - 0.03%
26 - 0.03%
499 - 0.61%
245 - 0.30%
Făleşti 90,320 75,863 - 83.99%
10,711 - 11.86%
3,064 - 3.39%
39 - 0.04%
32 - 0.04%
306 - 0.34%
6 - 0.01%
20 - 0.02%
57 - 0.06%
222 - 0.25%
Floreşti 89,389 75,797 - 84.79%
8,023 - 8.98%
4,633 - 5.18%
45 - 0.05%
51 - 0.06%
433 - 0.48%
19 - 0.02%
29 - 0.03%
120 - 0.13%
239 - 0.27%
Glodeni 60,975 46,317 - 75.96%
11,918 - 19.55%
1,693 - 2.78%
32 - 0.05%
44 - 0.07%
329 - 0.54%
8 - 0.01%
174 - 0.29%
303 - 0.50%
157 - 0.26%
Hînceşti 119,762 108,189 - 90.34%
6,218 - 5.19%
1,463 - 1.22%
99 - 0.08%
212 - 0.18%
3,046 - 2.54%
19 - 0.02%
16 - 0.01%
305 - 0.25%
195 - 0.16%
Ialoveni 97,704 91,379 - 93.53%
1,117 - 1.14%
1,112 - 1.14%
95 - 0.10%
935 - 0.96%
2,608 - 2.67%
5 - 0.01%
12 - 0.01%
197 - 0.20%
244 - 0.25%
Leova 51,056 43,673 - 85.54%
1,245 - 2.44%
1,167 - 2.29%
432 - 0.85%
3,804 - 7.45%
471 - 0.92%
8 - 0.02%
9 - 0.02%
105 - 0.21%
142 - 0.28%
Nisporeni 64,924 60,774 - 93.61%
223 - 0.34%
339 - 0.52%
17 - 0.03%
28 - 0.04%
2,329 - 3.59%
1 - <0.01%
4 - 0.01%
1,147 - 1.77%
62 - 0.10%
Ocniţa 56,510 32,491 - 57.50%
17,351 - 30.70%
2,764 - 4.89%
79 - 0.14%
60 - 0.11%
104 - 0.18%
14 - 0.02%
43 - 0.08%
3,417 - 6.05%
187 - 0.33%
Orhei 116,271 100,469 - 86.41%
4,520 - 3.89%
2,216 - 1.91%
113 - 0.10%
90 - 0.08%
8,253 - 7.10%
46 - 0.04%
23 - 0.02%
221 - 0.19%
320 - 0.28%
Rezina 48,105 44,721 - 92.97%
1,691 - 3.52%
1,093 - 2.27%
34 - 0.07%
40 - 0.08%
375 - 0.78%
30 - 0.06%
5 - 0.01%
13 - 0.03%
103 - 0.21%
Rîşcani 69,454 50,391 - 72.55%
15,632 - 22.51%
1,726 - 2.49%
60 - 0.09%
61 - 0.09%
777 - 1.12%
8 - 0.01%
42 - 0.06%
602 - 0.87%
155 - 0.22%
Sîngerei 87,153 74,139 - 85.07%
8,456 - 9.70%
3,029 - 3.48%
47 - 0.05%
43 - 0.05%
1,162 - 1.33%
10 - 0.01%
48 - 0.06%
56 - 0.06%
163 - 0.19%
Soroca 94,986 84,728 - 89.20%
4,752 - 5%
2,601 - 2.74%
53 - 0.06%
48 - 0.05%
931 - 0.98%
65 - 0.07%
17 - 0.02%
1,564 - 1.65%
227 - 0.24%
Străşeni 88,900 83,368 - 93.78%
985 - 1.11%
1,576 - 1.77%
70 - 0.08%
109 - 0.12%
2,542 - 2.86%
13 - 0.01%
14 - 0.02%
24 - 0.03%
199 - 0.22%
Şoldăneşti 42,227 40,354 - 95.56%
1,055 - 2.50%
376 - 0.89%
9 - 0.02%
14 - 0.03%
299 - 0.71%
2 - <0.01%
- - 0%
74 - 0.18%
44 - 0.10%
Ştefan Vodă 70,594 65,318 - 92.53%
2,182 - 3.09%
1,918 - 2.72%
64 - 0.09%
145 - 0.21%
562 - 0.80%
1 - <0.01%
4 - 0.01%
219 - 0.31%
181 - 0.26%
Taraclia 43,154 5,980 - 13.86%
2,646 - 6.13%
2,139 - 4.96%
3,587 - 8.31%
28,293 - 65.56%
29 - 0.07%
2 - <0.01%
9 - 0.02%
218 - 0.51%
251 - 0.58%
Teleneşti 70,126 67,309 - 95.98%
879 - 1.25%
537 - 0.77%
16 - 0.02%
16 - 0.02%
1,262 - 1.80%
4 - 0.01%
1 - <0.01%
6 - 0.01%
96 - 0.14%
Ungheni 110,545 97,805 - 88.48%
7,743 - 7%
2,766 - 2.50%
90 - 0.08%
93 - 0.08%
1,627 - 1.47%
16 - 0.01%
17 - 0.02%
68 - 0.06%
320 - 0.29%
Subtotal controlled by central government 3,383,332 2,564,850 - 75.80%
282,406 - 8.35%
201,218 - 5.95%
147,500 - 4.36%
65,662 - 1.94%
73,276 - 2.16%
3,608 - 0.11%
2,383 - 0.07%
12,271 - 0.36%
30,157 - 0.89%
1There is an ongoing controversy over whether Moldovans are a subset of Romanians, or a distinct ethnic group. At the 2004 Moldovan Census, citizens could declare only one nationality. Consequently, one could not declare oneself both Moldovan and Romanian.
Transnistrian-controlled areas
See also: Demographics of TransnistriaPopulation Mold.
(Rom.)Russians Ukrainians Gagauzes Bulg. Gyps. Jews Poles Belor. Germ. Armen. others,
non-decl.Tiraspol 158,069 23,790 15.05%
65,928 41.71%
52,278 33.07%
1,988 1.26%
2,450 1.55%
116 0.07%
573 0.36%
324 0.20%
1,712 1.08%
701 0.44%
360 0.23%
7,849 - 4.97%
Camenca sub-district 27,284 13,048 47.82%
1,880 6.89%
11,610 42.55%
43 0.16%
59 0.22%
9 0.03%
10 0.04%
447 1.64%
85 0.31%
26 0.10%
16 0.06%
51 0.19%
Rîbniţa sub-district 82,699 24,729 29.90%
14,237 17.22%
37,554 45.41%
149 0.18%
309 0.37%
51 0.06%
177 0.21%
528 0.64%
412 0.50%
150 0.18%
81 0.10%
4,322 5.23%
Dubăsari sub-district 36,734 18,080 49.22%
7,125 19.40%
10,594 28.84%
92 0.25%
134 0.36%
46 0.13%
46 0.13%
53 0.14%
185 0.50%
63 0.17%
126 0.34%
190 0.52%
Grigoriopol sub-district 48,000 31,118 64.83%
7,332 15.28%
8,333 17.36%
123 0.26%
240 0.50%
13 0.03%
26 0.05%
100 0.21%
187 0.39%
327 0.68%
62 0.13%
139 0.29%
Slobozia sub-district 86,742 36,651 42.25%
20,636 23.79%
19,872 22.91%
512 0.59%
7,323 8.44%
133 0.15%
35 0.04%
137 0.16%
475 0.55%
496 0.57%
140 0.16
332 0.38%
Subtotal Transnistria 439,528 147,416 33.54%
117,138 26.65%
140,241 31.91%
2,907 0.66%
10,515 2.39%
368 0.08%
867 0.20%
1,589 0.36%
3,056 0.70%
1,763 0.40%
785 0.18%
12,883 2.93%
Bender (w/o Protegailovca) 97,027 24,374 25.12%
41,949 43.23%
17,348 17.88%
1,066 1.10%
3,001 3.09%
132 0.14%
383 0.39%
190 0.21%
713 0.73%
258 0.27%
173 0.18%
7,440 7.67%
Proteagailovca 3,142 756-761 24.12%
1,482 47.17%
658 20.94%
25 0.80%
163 5.19%
0-5 0.06%
2 0.06%
0-12 0.19%
19 0.60%
6 0.19%
0-16 0.25%
0-31 0.48%
Gîsca 4,841 819-824 16.98%
2,956 61.06%
719 14.85%
91 1.88%
168 3.47%
0-5 0.04%
7 0.14%
0-12 0.12%
8 0.17%
22 0.45%
0-16 0.17%
13-44 0.60%
Chiţcani (incl. Mereneşti and Zahorna) ~9,000 ~3,100 ~35%
~4,800 ~53%
~900 ~10%
N/A N/A N/A N/A N/A N/A N/A N/A ~200 ~2%
Cremenciug 1,094 465 42.50%
353 32.27%
203 18.56%
7 0.64%
11 1.01%
2 0.18%
- -
- -
15 1.37%
22 2.01%
6 0.55%
10 0.91%
Roghi 715[8] ~700 ~95%
N/A N/A N/A N/A N/A N/A N/A N/A N/A N/A ~15 ~5%
Subotal other localities 115,819 30,219 26.09%
51,540 44.50%
19,828 17.12%
1,189 1.03%
3,343 2.89%
139 0.12%
392 0.34%
202 0.17%
755 0.65%
308 0.27%
195 0.17%
7,709 6.66%
Total Tiraspol-controlled areas 555,347 177,635 31.99%
168,678 30.37%
160,069 28.82%
4,096 0.74%
13,858 2.50%
507 0.09%
1,259 0.23%
1,791 0.32%
3,811 0.69%
2,071 0.37%
980 0.18%
20,592 3.71%
Notes:
- The exact numbers in the above table are taken from the data published by the Transnistrian breakaway authorities after the 2004 Census in Transnistria, except the population of Roghi, which was taken from website of the Dubăsari sub-district of Transnistria.
- The number of inhabitants of Slobozia sub-district + that of the commune Chiţcani was given by Transnisrian authorities as 95,742. Other sources indicate ~9,000 for Chiţcani. In this table it is assumed there are 9,000 inhabitantts in Chiţcani, and 86,742 in Slobozia sub-district. Should the exact data of the census for Chiţcani be available, the entries in the lines of Slobozia sub-district and of Chiţcani should be corrected accordingly.
- Transnistrian authorities have published the ethnic composition for the combined population of the Dubăsari sub-district and the village of Roghi in Molovata Nouă commune. Other sources indicate that the latter is almost entirely Moldovan (Romanian). In this table it is assumed that of the 715 inhabitants of this village, 700 are Moldovan (Romanian) and 15 are others. Should the exact ethnicity data of the census for Roghi be available, the entries for ethnicities in the lines of Dubăsari sub-district and of Roghi should be corrected accordingly.
- Percentages are calculated from the absolute numbers
Languages
Main article: Languages of MoldovaRomanian is the official language of Moldova. In political contexts it is sometimes also called Moldovan.
Native language
Currently, 2,588,355 people or 76.51% of the inhabitants of right bank Moldova (proper) have Moldovan/Romanian as native language, of which 2,029,847 (60.00%) declared it Moldovan and 558,508 (16.51%) declared it Romanian. 380,796 people or 11.26% have Russian as native language, 186,394 or 5.51% - Ukrainian, 137,774 or 4.07% - Gagauz, 54,401 or 1.61% - Bulgarian, 21,504 or 0.63% - another language, and 14,108 or 0.41% did not declare one.
First language in daily use
According to the 2004 census, 2,543,354 people or 75.17% of the inhabitants of Moldova (proper) have Moldovan/Romanian as first language, of which 1,988,540 (58.77%) declared it Moldovan and 554,814 (16.40%) declared it Romanian. 540,990 people or 15.99% have Russian as first language, 130,114 or 3.85% - Ukrainian, 104,890 or 3.10% - Gagauz, 38,565 or 1.14% - Bulgarian, 11,318 or 0.34% - another language, and 14,101 or 0.41% did not declare one.
Ethnic group \ First language Romanian Russian Ukrainian Gagauzian Bulgarian other language did non declare Total - Moldovans
- Romanians
2,495,977
2,424,444
71,533129,909
128,372
1,5379,251
9,170
81804
799
51,117
1,113
41,067
951
116-
-
-2,638,125
2,564,849
73,276Russians 11,657 187,526 1,224 329 344 138 - 201,218 Ukrainians 21,649 141,206 118,699 427 294 131 - 282,406 Gagauzians 3,365 40,445 413 102,395 821 61 - 147,500 Bulgarians 5,698 23,259 188 673 35,808 36 - 65,662 other ethnic groups 4,961 18,610 339 262 181 9,856 192 34,401 did non declare 47 35 - - - 29 13,909 14,020 Total by language of first use 2,543,354
75.17%540,990
15.99%130,114
3.85%104,890
3.10%38,565
1.14%11,318
0.34%14,101
0.41%3,383,332
100%Usage of own language by the ethnic groups of Moldova
ethhnic group own language Romanian Russian Moldovans/Romanians 94.62% - 4.92% Russians 93.20% 5.79% - Ukrainians 42.03% 7.66% 50.00% Gagauzians 69.42% 2.28% 27.42% Bulgarians 54.53% 8.68% 35.42% others up to 28.65% 14.42% 54.10% Urban areas
ethhnic group own language Romanian Russian Moldovans/Romanians 87.23% - 12.56% Russians 95.85% 3.82% - Ukrainians 13.06% 6.56% 80.19% Gagauzians 40.10% 2.19% 57.23% Bulgarians 36.81% 7.93% 54.45% others up to 28.11% 8.35% 62.05% Rural areas
ethhnic group own language Romanian Russian Moldovans/Romanians 98.25% - 1.16% Russians 80.52% 15.25% - Ukrainians 72.99% 8.85% 17.74% Gagauzians 86.16% 2.33% 10.40% Bulgarians 68.95% 9.29% 19.95% others up to 30.34% 33.39% 29.25% Soviet era data
 Ethnic map of Moldova (1989 data)
In the Soviet census of 1989 members of most of the ethnic groups in Moldavian SSR claimed the language of their ethnicity as their mother tongue: Moldovans (95%), Ukrainians (62%), Russians (99%), Gagauz (91%), Bulgarians (79%), and Gipsies (82%). The exceptions were Jews (26% citing Yiddish), Belarusians (43%), Germans (31%), and Poles (10%).
In the Soviet census of 1989, 62% of the total population claimed Moldovan as their native language. Only 4% of the entire population claimed Moldovan as a second language.
In 1979, Russian was claimed as a native language by a large proportion of Jews (66%) and Belarusians (62%), and by a significant proportion of Ukrainians (30%). Proportions of other ethnicities naming Russian as a native language ranged from 17% of Bulgarians to 3% of Moldovans (Russian was more spoken by urban Moldovans than by rural Moldovans). Russian was claimed as a second language by a sizeable proportion of all ethnicities: Moldovans (46%), Ukrainians (43%), Gagauz (68%), Jews (30%), Bulgarians (67%), Belarusians (34%), Germans (53%), Roma (36%), and Poles (24%).
Religion
Main article: Religion in MoldovaAccording to the 2004 census, the population of Moldova has the following religious composition:
Religion Adherents % of total Eastern Orthodox Christians 3,158,015 93.3% Newer Protestant faiths
32,754
13,503
9,179
5,0751.79%
0.97%
0.40%
0.27%
0.15%Traditional Protestant
- Confessional Evangelicals
- Refomed
- Evangelical Synod-Presbyterians
1,429
1,190
3,5960.19%
0.04%
0.04%
0.11%Old-Rite Christians b 5,094 0.15% Roman Catholics 4,645 0.14% Other religions 29,813 0.88% Non-religious 33,207 0.98% Atheists 12,724 0.38% Notes: 75,727 (2.24% of population) did not answer that question.
a Known as Creştini după Evanghelie.
b Traditionally Orthodox Lipovans.History
In 1940-1941, and 1944–1991, the Soviet government strictly limited the activities of the Orthodox Church (and all religions) and at times sought to exploit it, with the ultimate goal of abolishing it and all religious activity altogether. Most Orthodox churches and monasteries in Moldova were demolished or converted to other uses, such as administrative buildings or warehouses, and clergy were sometimes punished for leading services. Still, many believers continued to practice their faith.
People in the independent Moldova have much greater religious freedom than they did in Soviet times. Legislation passed in 1992 guarantees religious freedom, but requires all religious groups to be officially recognized by the government.
Orthodox Christians
In 1991, Moldova had 853 Orthodox churches and eleven Orthodox monasteries (four for monks and seven for nuns). In 1992 construction or restoration of 221 churches was underway, but clergy remained in short supply.[citation needed] As of 2004, Chistian Orthodox constitute the vast majority of the population in all districts of Moldova.
In the interwar period, the vast majority of ethnic Moldovans belonged to the Romanian Orthodox Church (Bucharest Patriarchate), but today both Romanian and Russian Orthodox Church (Moscow Patriarchate) have jurisdiction in Moldova, with the latter having more parishes. According to the local needs, liturgy is performed in Romanian, Russian, and Turkic (Gagauz). After the revival of religious activity in the last 20 years, a minority of the clergy and the faithful wanted to return to the Bucharest Patriarchate (Metropolis of Bessarabia). Because higher-level church authorities were unable to resolve the matter, Moldova now has two episcopates, one for each patriarchate. After the Soviet occupation in 1940, the Metropolis was downgraded to a Bishopric. In late 1992, the Patriarch of Moscow and All Russia issued a decree upgrading its eparchy of Chişinău and Moldova to a Metropolis.
Greek Catholics
Moldova also has a Greek Catholic minority, mainly among ethnic Ukrainians, although the Soviet government declared the Greek Catholic Churches illegal in 1946 and forcibly united them with the Russian Orthodox Church. However, the Greek Catholic Churches had survived underground until the dissolution of the Soviet Union.
Roman Ctholics
Half of Moldova's Roman Catholics are in Chişinău, and 1/5 in Bălţi.
Old Believers
In addition, the Old Russian Orthodox Church (Old Believers) had fourteen churches and one monastery in Moldova in 1991.
Half of Moldova's Old Believers are in Floreşti district, and 1/5 in Sîngerei district.
Judaism
Despite the Soviet government's suppression and harassment, Moldova's practicing Jews managed to retain their religious identity. About a dozen Jewish newspapers were started in the early 1990s, and religious leaders opened a synagogue in Chişinău; there were six Jewish communities of worship throughout the country. In addition, Moldova's government created the Department of Jewish Studies at Chişinău State University, mandated the opening of a Jewish high school in Chişinău, and introduced classes in Judaism in high schools in several cities. The government also provides financial support to the Society for Jewish Culture.
Protestants
There are around 65,000 Protestants of all sects in Moldova today. There are more than 1,000 Baptists in the cities of Chişinău and Bălţi, in Cahul, Făleşti, Hînceşti, Sîngerei, Ştefan Vodă, and Ungheni districts, and in Găgăuzia. There are more than 1,000 Seventh-day Adventists in Cahul, Hînceşti and Sîngerei districts, and in Găgăuzia, there are more than 1,000 Penticostals in Chişinău and in Briceni district. There are more than 1,000 members of Brethren assemblies only in Chişinău. There are more than 1,000 Evangelical Synod-Presbyterians only in Chişinău.
Others
Other religious denominations in Moldova include:
- Armenian Apostolic Church
- Molokans (a Russian Orthodox sect).
Analysis
Moldova's territory is generally ethnically homogeneous. Moldovans (Romanians) form majorities in 33 of the 37 first-tier territorial units (including over 90% in 15 districts, between 80% and 90% in 9 districts, between 70% and 80% in 7 administrative units, and between 50% and 60% in 2 units), and a 33.5% plurality in Transnistria, where there are 32% Ukrainians and 27% Russians. Gagauzians represent a 82% majority in the autonomous territorial unit of Gagauzia, with only 5% Moldovans (Romanians). Bulgarians represent a 66% majority in the Taraclia district, with 14% Moldovans (Romanians). Finally, Russians represent a 43% plurality in the municipality of Bender, with 25% Moldovans (Romanians). Ukrainians represent between 20% and 30% minorities in four units with Moldovan (Romanian) majority: Bălţi, Briceni, Ocniţa, and Rîşcani, and one with Moldovan plurality (Transnistria). Elsewhere, the ethnic populations are under 20% district-wise (generally much less).
Although before 1991 Moldova was the most densely populated of the former Soviet republics (129 inhabitants per square kilometer in 1990, compared with 13 inhabitants per square kilometer for the Soviet Union as a whole), it had and has only few large cities.
The largest and most important of these is Chişinău, the country's capital and its most important industrial center, with a population of 712,218 in 2004. The city's population is 72.11% Moldovan (Romanian), 13.92% Russian, 8.28% Ukrainian, and 5.69% others (Bulganians, Gagauzians, Jews, Poles, Gypsies, etc.). The proportion of Russophones living in Moldova decreased in the years immediately after 1989 because of the emigration to Russia, after an immigration from Russia had taken place during the Soviet period.
The second largest city in the country, Tiraspol, had a population of 184,000 in 1990. Located in Transnistria, with a population of 158,069 in 2004, it is the capital of the breakaway republic. In contrast to Chişinǎu, Tiraspol has only some 15% Moldovans (Romanians), with Russians comprising 41.7%, and Ukrainians 33%. Due to deportations by the breakaway authorities, and emigration during and after the 1992 War of Transnistria, it has been reported that the Moldovan (Romanian) population has gone down by up to 10,000 since 1990.
Other important cities include Bălţi, with a population of 162,000 in 1990, and 127,561 in 2004, and Bender, with a population of 132,000 in 1990 and 100,169 in 2004. Other major cities include Rîbniţa, population 53,648, Cahul, population 35,488, Ungheni, population 32,530, Soroca, population 28,362, and Orhei, population 25,641.
Traditionally a predominantly rural country, Moldova gradually began changing its character in the 20th century. As urban areas became the sites of new industrial and intellectual jobs and amenities such as hospitals, the population of cities and towns grew. The Soviets kept the population of Moldova under control with the famous Soviet policy of propiska, which forbid a person to live in another locality than the one written in his/her identity documents without approval of Soviet authorities. The new residents Moldova's cities during the Soviet era were not only Moldovans, who had moved from the nearby rural areas, but also many Russians and Ukrainians who had been recruited to fill positions in industry and government, moving in from other parts of the Soviet Union.
Many people have emigrated to Romania in 1940 (estinated at 200,000) and 1944 (estimated at more than 200,000), and others had lost their lives during the war (over 100,000 as Soviet soldiers in 1944-1945, and up to 50,000 as Romanian soldiers before 1944, including as Soviet POWs in 1944-1945), in Stalinist persecutions (over 8,000 executed, ca. 50,000 sent to Gulag, over 200,000 deported), and during the 1946-1947 famine (216,000 deceised). During 1940s, thousands of young people were recruited to work in large-scale Soviet construction projects. Then, as a consequence of industrial growth after 1956, there was significant immigration to the Moldavian SSR by representatives of other ethnic groups, especially Russians and Ukrainians.
At the time of the 1989 census, Moldova's total population was 4,335,400. The largest ethnic group, Moldovans, numbered 2,795,000, accounting for 64.5 % of the population. The other major ethnicities were Ukrainians, about 600,000 (14%); Russians, about 562,000 (13.0%); Gagauz, about 153,000 (4%); Bulgarians, about 88,000 (2%); and Jews, about 66,000 (2.0%). There were also smaller but appreciable numbers of Poles and Roma in the population. In Transnistria ethnic Moldovans accounted for 40% of the population in 1989, followed by Ukrainians (28%), and Russians (25%). In the early 1990s, there was significant emigration from the republic, primarily from urban areas and mainly by non-Moldovan minorities. Moldovans made up a sizable proportion of the urban population in 1989 (about half the population of Chişinǎu and other cities), as well as a large proportion of the rural population (over 85%), but only 23% of the ethnic Moldovans lived in the republic's ten largest cities, with the rest of the community being predominantly rural.
Unlike Moldovans, Russians tend to be urban dwellers in Moldova; more than 72% of them lived in the ten largest cities in 1989. Many of them came to the Moldova after it was occupied by the Soviet Union in 1940. Some of them came to alleviate the postwar shortage of qualified labor in the Moldavian SSR, which was created by the rapid industrialization, but also by the loss of human life during the war, deportations, and famine. Ethnic Russians settled mainly in Chişinǎu, Bălţi, Bender, and in the cities of the eastern bank of the Dniester, such as Tiraspol, Rîbniţa, and Dubăsari. Only about 25% of Moldova's Russians lived in Transnistria in 1990, as many as in Chişinǎu alone.
In 1990, Moldova's divorce rate of 3.0 divorces per 1,000 population had risen from the 1987 rate of 2.7 divorces per 1,000 population. The usual stresses of marriage were exacerbated by a society in which women were expected to perform most of the housework in addition to their work outside the home. Compounding this were crowded housing conditions (with their resulting lack of privacy) and the growing economic crisis.
See also
References
Inline:
- ^ National Bureau of Statistics of Moldova
- ^ 2004 Moldovan census
- ^ (English) The World Factbook, CIA (2008)
- ^ (English) UN (2001/2002)
- ^ (English) UN (2000)
- ^ http://unstats.un.org/unsd/demographic/products/dyb/dyb2.htm#2001 United nations. Demographic Yearbooks
- ^ Statistica Moldovei
- ^ Webpage of Dubăsari sub-district of Transnistria
General:
- Moldovan Census results
- Official population data
- 2004 Transnistrian Census results (Russian)
 This article incorporates public domain material from websites or documents of the CIA World Factbook.
External links
- Arianna Montanari, Rumanian national identity in the Republic of Moldova
- Disaster by Depopulation, a Red Cross report about impact of demographic changes on family structure and child care
 Moldova topics
History Prehistoric Balkans · Dacia · Principality of Moldavia · Bessarabia · Union with Romania · Greater Romania · Moldavian SSR · War of Transnistria · Post-independenceGeography Cities and regions Law Declaration of Independence · Constitution · Constitutional Court · Nationality law · Passport · Law enforcement · Crime · Human rights · LGBT rightsPolitics Economy Military Demographics Culture See also: Transnistria topics Demographics of Europe Sovereign
states- Albania
- Andorra
- Armenia
- Austria
- Azerbaijan
- Belarus
- Belgium
- Bosnia and Herzegovina
- Bulgaria
- Croatia
- Cyprus
- Czech Republic
- Denmark
- Estonia
- Finland
- France
- Georgia
- Germany
- Greece
- Hungary
- Iceland
- Ireland
- Italy
- Kazakhstan
- Latvia
- Liechtenstein
- Lithuania
- Luxembourg
- Macedonia
- Malta
- Moldova
- Monaco
- Montenegro
- Netherlands
- Norway
- Poland
- Portugal
- Romania
- Russia
- San Marino
- Serbia
- Slovakia
- Slovenia
- Spain
- Sweden
- Switzerland
- Turkey
- Ukraine
- United Kingdom
- (England
- Northern Ireland
- Scotland
- Wales)
- Vatican City
States with limited
recognition- Abkhazia
- Kosovo
- Nagorno-Karabakh
- Northern Cyprus
- South Ossetia
- Transnistria
Dependencies
and other territories- Åland
- Faroe Islands
- Gibraltar
- Guernsey
- Jan Mayen
- Jersey
- Isle of Man
- Svalbard
Other entities - European Union
Categories:


Wikimedia Foundation. 2010.