- Mathematical diagram
-
This article is about general diagrams in mathematics. For diagrams in the category theoretical sense, see Diagram (category theory).
 Euclid's Elements, ms. from Lüneburg, A.D. 1200
Mathematical diagrams are diagrams in the field of mathematics, and diagrams using mathematics such as charts and graphs, that are mainly designed to convey mathematical relationships, for example, comparisons over time.[1]
Contents
Specific types of mathematical diagrams
Argand diagram
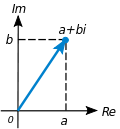 Argand diagram.
A complex number can be visually represented as a pair of numbers forming a vector on a diagram called an Argand diagram The complex plane is sometimes called the Argand plane because it is used in Argand diagrams. These are named after Jean-Robert Argand (1768–1822), although they were first described by Norwegian-Danish land surveyor and mathematician Caspar Wessel (1745–1818).[2] Argand diagrams are frequently used to plot the positions of the poles and zeroes of a function in the complex plane.
The concept of the complex plane allows a geometric interpretation of complex numbers. Under addition, they add like vectors. The multiplication of two complex numbers can be expressed most easily in polar coordinates – the magnitude or modulus of the product is the product of the two absolute values, or moduli, and the angle or argument of the product is the sum of the two angles, or arguments. In particular, multiplication by a complex number of modulus 1 acts as a rotation.
 Butterfly diagram
Butterfly diagram
In the context of fast Fourier transform algorithms, a butterfly is a portion of the computation that combines the results of smaller discrete Fourier transforms (DFTs) into a larger DFT, or vice versa (breaking a larger DFT up into subtransforms). The name "butterfly" comes from the shape of the data-flow diagram in the radix-2 case, as described below. The same structure can also be found in the Viterbi algorithm, used for finding the most likely sequence of hidden states.
The butterfly diagram show a data-flow diagram connecting the inputs x (left) to the outputs y that depend on them (right) for a "butterfly" step of a radix-2 Cooley-Tukey FFT. This diagram resembles a butterfly as in the Morpho butterfly shown for comparison), hence the name.
 Commutative diagram.
Commutative diagram
In mathematics, and especially in category theory a commutative diagram is a diagram of objects, also known as vertices, and morphisms, also known as arrows or edges, such that when selecting two objects any directed path through the diagram leads to the same result by composition.
Commutative diagrams play the role in category theory that equations play in algebra.
 Hasse diagram.
Hasse diagrams
A Hasse diagram is a simple picture of a finite partially ordered set, forming a drawing of the transitive reduction of the partial order. Concretely, one represents each element of S as a vertex on the page and draws a line segment or curve that goes upward from x to y if x < y, and there is no z such that x < z < y. In this case, we say y covers x, or y is an immediate successor of x. Furthermore it is required that the vertices are positioned in such a way that each curve meets exactly two vertices: its two endpoints. Any such diagram (given that the vertices are labeled) uniquely determines a partial order, and any partial order has a unique transitive reduction, but there are many possible placements of elements in the plane, resulting in different Hasse diagrams for a given order that may have widely varying appearances.
 Knot diagram.
Knot diagrams
In Knot theory a useful way to visualise and manipulate knots is to project the knot onto a plane—think of the knot casting a shadow on the wall. A small perturbation in the choice of projection will ensure that it is one-to-one except at the double points, called crossings, where the "shadow" of the knot crosses itself once transversely[3]
At each crossing we must indicate which section is "over" and which is "under", so as to be able to recreate the original knot. This is often done by creating a break in the strand going underneath. If by following the diagram the knot alternately crosses itself "over" and "under", then the diagram represents a particularly well-studied class of knot, alternating knots.
 Venn diagram.
Venn diagram
A Venn diagram is a representation of mathematical sets: a mathematical diagram representing sets as circles, with their relationships to each other expressed through their overlapping positions, so that all possible relationships between the sets are shown.[4]
The Venn diagram is constructed with a collection of simple closed curves drawn in the plane. The principle of these diagrams is that classes be represented by regions in such relation to one another that all the possible logical relations of these classes can be indicated in the same diagram. That is, the diagram initially leaves room for any possible relation of the classes, and the actual or given relation, can then be specified by indicating that some particular region is null or is notnull.[5]
 Voronoi centerlines.
Voronoi diagram
A Voronoi diagram is a special kind of decomposition of a metric space determined by distances to a specified discrete set of objects in the space, e.g., by a discrete set of points. This diagram is named after Georgy Voronoi, also called a Voronoi tessellation, a Voronoi decomposition, or a Dirichlet tessellation after Lejeune Dirichlet.
In the simplest case, we are given a set of points S in the plane, which are the Voronoi sites. Each site s has a Voronoi cell V(s) consisting of all points closer to s than to any other site. The segments of the Voronoi diagram are all the points in the plane that are equidistant to two sites. The Voronoi nodes are the points equidistant to three (or more) sites
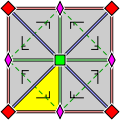 Wallpaper group diagram.
Wallpaper group diagrams
A wallpaper group or plane symmetry group or plane crystallographic group is a mathematical classification of a two-dimensional repetitive pattern, based on the symmetries in the pattern. Such patterns occur frequently in architecture and decorative art. There are 17 possible distinct groups.
Wallpaper groups are two-dimensional symmetry groups, intermediate in complexity between the simpler frieze groups and the three-dimensional crystallographic groups, also called space groups. Wallpaper groups categorize patterns by their symmetries. Subtle differences may place similar patterns in different groups, while patterns which are very different in style, color, scale or orientation may belong to the same group.
Young diagram
A Young diagram or Young tableau, also called Ferrers diagram, is a finite collection of boxes, or cells, arranged in left-justified rows, with the row sizes weakly decreasing (each row has the same or shorter length than its predecessor).
 Young diagram.
Listing the number of boxes in each row gives a partition λ of a positive integer n, the total number of boxes of the diagram. The Young diagram is said to be of shape λ, and it carries the same information as that partition. Listing the number of boxes in each column gives another partition, the conjugate or transpose partition of λ; one obtains a Young diagram of that shape by reflecting the original diagram along its main diagonal.
Young tableaux were introduced by Alfred Young, a mathematician at Cambridge University, in 1900. They were then applied to the study of symmetric group by Georg Frobenius in 1903. Their theory was further developed by many mathematicians.
Other mathematical diagrams
See also
- Category theory
- Logic diagram
- Mathematical jargon
- Mathematical model
- Mathematics as a language
- Statistical model
References
- ^ Working with diagrams at LearningSpace.
- ^ Wessel's memoir was presented to the Danish Academy in 1797; Argand's paper was published in 1806. (Whittaker & Watson, 1927, p. 9)
- ^ Dale Rolfsen (1976), Knots and Links, , ISBN 0-914098-16-0
- ^ "Venn diagram", Encarta World English Dictionary, North American Edition 2007. Archived 2009-11-01.
- ^ Clarence Irving Lewis (1918). A Survey of Symbolic Logic. Republished in part by Dover in 1960. p. 157.
Further reading
- D. Barker-Plummer & S. Bailin (1997). "The Role of Diagrams in Mathematical Proofs". In: Machine GRAPHICS and VISION. 6(1): 25–56. (Special Issue on Diagrammatic Representation and Reasoning).
- D. Barker-Plummer & S.C. Bailin (2001). "On the practical semantics of mathematical diagrams". In: M. Anderson (ed.). Reasoning with Diagrammatic Representations. Springer Verlag.
- Kidman, G. (2002). "The Accuracy of mathematical diagrams in curriculum materials". In: Cockburn A and Nardi E. (Eds) Proceeding of the PME 26 Vol.3 201–208. UK:University of East Anglia.
- Zenon Kulpa (2004). "On Diagrammatic Representation of Mathematical Knowledge". In: Mathematical Knowledge Management, Andrea Asperti, Grzegorz Bancerek & Andrzej Trybulec (eds.). pp. 190–204.
- K. Puphaiboon, A. Woodcock & S. Scrivener (2005). "Design method for developing mathematical diagrams". In: Contemporary ergonomics 2005 Proceedings of the International Conference on Contemporary Ergonomics (CE2005), 5–7 April 2005 Hatfield, UK. Philip D. Bust (ed.). Taylor & Francis.
External links
- Diagrams, The Stanford Encyclopedia of Philosophy, Fall 2008.
- Diagrammatics: The art of thinking with diagrams by Zenon Kulpa
- One of the oldest extant diagrams from Euclid by Otto Neugebauer
- Diagrams in Mathematical Education: A Philosophical Appraisal, Dennis Lomas 1998.
Categories:- Diagrams
- Diagram algebras
- Mathematics


Wikimedia Foundation. 2010.