- Demographics of Kyrgyzstan
-
Demographics of Kyrgyzstan 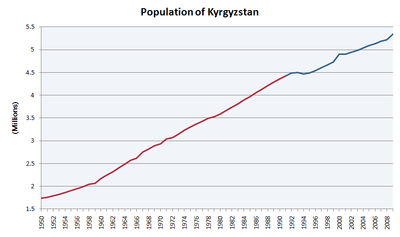
Population of Kyrgyzstan (in millions) from 1950-2009Population: 5,362,800 (2009 est.) Density: 27.4/km2; 71/sq mi Growth rate: 1.32/1,000 population (2010 est.) Birth rate: 22.88 births/1,000 population (2010 est.) Death rate: 2.69 deaths/1,000 population (2010 est.) Life expectancy: 69.43 years –male: 65.53 years –female: 73.64 years (2009 est.) Fertility rate: 2.65 children born/woman (2010 est.) Infant mortality rate: 31.26 deaths/1,000 live births Age structure: 0-14 years: 23.6% 15-64 years: 62.9% 65-over: 6.2% Sex ratio: At birth: 1.05 male(s)/female Under 15: 1.04 male(s)/female 15-64 years: 0.96 male(s)/female 65-over: 0.64 male(s)/female Nationality: Nationality: Kyrgyzstani Major ethnic: Kyrgyz Minor ethnic: Russian, Uzbek, Ukrainian, Uyghur, Tatar, German Language: Official: Kyrgyz Spoken: Kyrgyz, Russian  A Yurt family
The Demographics of Kyrgyzstan is about the demographic features of the population of Kyrgyzstan, including population growth, population density, ethnicity, education level, health, economic status, religious affiliations, and other aspects of the population. The name Kyrgyz, both for the people and the country, means "forty girls" or "forty tribes", a reference to the epic hero Manas who unified forty tribes against the Oirats, as symbolized by the 40-ray sun on the flag of Kyrgyzstan.
Contents
Demographic trends
 Musicians
Kyrgyzstan's population increased from 2.1 million to 4.8 million between the censuses of 1959 and 1999.[1] Official estimates set the population at 5.2 million in 2007.[2] Of those, 34.4% are under the age of 15 and 6.2% are over the age of 65. The country is rural: only about one-third of Kyrgyzstan's population live in urban areas. The average population density is 69 people per square mile (29 people per km²).
The nation's largest ethnic group are the Kyrgyz, a Turkic people, which comprise 71% of the population (2009 census). Other ethnic groups include Russians (9.0%) concentrated in the north and Uzbeks (14.5%) living in the south. Small but noticeable minorities include Tatars (1.9%), Uyghurs (1.1%), Tajiks (1.1%), Kazakhs (0.7%) and Ukrainians (0.5%), and other smaller ethnic minorities (1.7%). Of the formerly sizable Volga German community, exiled here by Joseph Stalin from their earlier homes in the Volga German Republic, most have returned to Germany, and only a few small groups remain. A small percentage of the population are also Koreans, who are the descendants of the Koreans deported in 1937 from the Soviet Far East to Central Asia.
Kyrgyzstan has undergone a pronounced change in its ethnic composition since independence. The percentage of ethnic Kyrgyz increased from around 50% in 1979 to nearly 70% in 2007, while the percentage of European ethnic groups (Russians, Ukrainians, and Germans) as well as Tatars dropped from 35% to about 10%.[1][2]
The Kyrgyz have historically been semi-nomadic herders, living in round tents called yurts and tending sheep, horses and yaks. This nomadic tradition continues to function seasonally (see transhumance) as herding families return to the high mountain pasture (or jailoo) in the summer. The retention of this nomadic heritage and the freedoms that it implies continue to have an impact on the political atmosphere in the country.
Vital statistics
Births and deaths[3] [4]
Average population (x 1000) Live births Deaths Natural change Crude birth rate (per 1000) Crude death rate (per 1000) Natural change (per 1000) 1980 3 628 107 278 30 460 76 818 29.6 8.4 21.2 1981 3 699 113 434 29 591 83 843 30.7 8.0 22.7 1982 3 775 117 235 29 194 88 041 31.1 7.7 23.3 1983 3 857 120 708 30 241 90 467 31.3 7.8 23.5 1984 3 937 126 075 32 603 93 472 32.0 8.3 23.7 1985 4 014 128 460 32 332 96 128 32.0 8.1 23.9 1986 4 093 133 728 29 083 104 645 32.7 7.1 25.6 1987 4 173 136 588 30 597 105 991 32.7 7.3 25.4 1988 4 250 133 710 31 879 101 831 31.5 7.5 24.0 1989 4 327 131 508 31 156 100 352 30.4 7.2 23.2 1990 4 395 128 810 30 580 98 230 29.3 7.0 22.4 1991 4 464 129 536 30 859 98 677 29.0 6.9 22.1 1992 4 515 128 352 32 163 96 189 28.4 7.1 21.3 1993 4 515 116 795 34 513 82 282 25.9 7.6 18.2 1994 4 513 110 113 37 109 73 004 24.4 8.2 16.2 1995 4 560 117 340 36 915 80 425 25.7 8.1 17.6 1996 4 628 108 007 34 562 73 445 23.3 7.5 15.9 1997 4 696 102 050 34 540 67 510 21.7 7.4 14.4 1998 4 769 104 183 34 596 69 587 21.8 7.3 14.6 1999 4 837 104 068 32 850 71 218 21.5 6.8 14.7 2000 4 888 96 770 34 111 62 659 19.8 7.0 12.8 2001 4 927 98 138 32 677 65 461 19.9 6.6 13.3 2002 4 965 101 012 35 235 65 777 20.3 7.1 13.2 2003 5 011 105 490 35 941 69 549 21.1 7.2 13.9 2004 5 065 109 939 35 061 74 878 21.7 6.9 14.8 2005 5 116 109 839 36 992 72 847 21.5 7.2 14.2 2006 5 164 120 737 38 566 82 171 23.4 7.5 15.9 2007 5 207 123 251 38 180 85 071 23.7 7.3 16.3 2008 5 250 127 332 37 710 89 622 24.3 7.2 17.1 2009 5 301 135 494 37 000 98 494 25.6 7,0 18.6 2010 Total fertility rate
2.65 children born/woman (2009 est.)
The differences in the number of children by nationality are significant: Uzbeks (3.0 children), Tajiks (3.0 children), Turks (2.9), Kyrgyz (2.9), Dungans (2.8) Russians (1.7), Koreans (1.7), Germans (1.8), Ukrainians (2.1), Tatars (2.1), Kazakhs (2.3) and Ugyhurs (2.5).[1] The TFR for Russians in Kyrgyzstan is more than 60% higher than that in Russia and the TFR for Ukrainians is 100% higher than in Ukraine. TFR for Koreans in Kyrgyzstan is also very high compared to TFR of South Korea. Same is true for Germans.[citation needed]
Ethnic groups
According to the 1999 census,[1] the ethnic composition of the population was as follows: Kyrgyz (Kara Kyrgyz) 64.9%, Uzbeks 13.8%, Russians 12.5%, Dungans 1.1%, Ukrainians 1%, Ugyhurs 1%, other 5.7%, including Koreans 0.4% and Germans 0.4% (among them Low German-speaking Mennonites). Most Russians, Ukrainians, Tatars, Germans, and Koreans lived in northeast, especially around the city of Karakol. Most of the Dungans and Ugyhurs are found along the Chinese border. Most of the Tajiks and Uzbeks live in the south. The emigration of non-Turkic people to Russia, Ukraine, and Germany is now negligible, in part because most of them left prior to 1999 and in part because Kyrgyzstan is the most tolerant Central Asian nation.[citation needed]
The table shows the ethnic composition of Kyrgyzstan's population according to all population censuses between 1926 and 2009. There has been a sharp decline in the European ethnic groups (Russians, Ukrainians, Germans) and also Tatars since independence (as captured in the 1989, 1999 and 2009 censuses).
Population of Kyrgyzstan according to ethnic group 1926–2009 Ethnic
groupcensus 19261 census 19392 census 19593 census 19704 census 19795 census 19896 census 19997 census 20098 Number % Number % Number % Number % Number % Number % Number % Number % Kyrgyz 661,171 66.6 754,323 51.7 836,831 40.5 1,284,773 43.8 1,687,382 47.9 2,229,663 52.4 3,128,147 64.9 3,804,800 70.9 Uzbeks 110,463 11.1 151,551 10.4 218,640 10.6 332,638 11.3 426,194 12.1 550,096 12.9 664,950 13.8 768,400 14.3 Russians 116,436 11.7 302,916 20.8 623,562 30.2 855,935 29.2 911,703 25.9 916,558 21.5 603,201 12.5 419,600 7.8 Dungans 6,004 0.6 5,921 0.4 11,088 0.5 19,837 0.7 26,661 0.8 36,928 0.9 51,766 1.1 58,400 1.1 Uygurs 7,540 0.8 9,412 0.6 13,757 0.7 24,872 0.8 29,817 0.8 36,779 0.9 46,944 1.0 48,500 0.9 Tajiks 2,667 0.3 10,670 0.7 15,221 0.7 21,927 0.7 23,209 0.7 33,518 0.8 42,636 0.9 46,100 0.9 Turks 44 0.0 33 0.0 542 0.0 3,076 0.1 5,160 0.1 21,294 0.5 33,327 0.7 39,100 0.7 Kazakhs 1,766 0.2 23,925 1.6 20,067 1.0 21,998 0.8 27,442 0.8 37,318 0.9 42,657 0.9 33,200 0.6 Tatars 4,902 0.5 20,017 1.4 56,209 2.7 68,827 2.3 71,744 2.0 70,068 1.6 45,438 0.9 31,500 0.6 Ukrainians 64,128 6.5 137,299 9.4 137,031 6.6 120,081 4.1 109,324 3.1 108,027 2.5 50,442 1.0 21,900 0.4 Koreans 9 0.0 508 0.0 3,622 0.2 9,404 0.3 14,481 0.4 18,355 0.4 19,784 0.4 17,300 0.3 Azeris 3,631 0.4 7,724 0.5 10,428 0.5 12,536 0.4 17,207 0.5 15,775 0.4 14,014 0.3 17,300 0.3 Germans 4,291 0.4 11,741 0.8 39,915 1.9 89,834 3.1 101,057 2.9 101,309 2.4 21,471 0.4 9,500 0.2 Kurds - 1,490 0.1 4,783 0.2 7,974 0.3 9,544 0.3 14,262 0.3 - - Chechens 1 0.0 7 0.0 25,208 1.2 3,391 0.1 2,654 0.1 2,873 0.1 2,612 0.1 1,900 0.0 Belorussians 333 0.0 1,520 0.1 4,613 0.2 6,868 0.2 7,676 0.2 9,187 0.2 3,208 0.1 1,400 0.0 Jews 318 0.0 1,895 0.1 8,607 0.4 7,677 0.3 6,836 0.2 6,005 0.1 1,571 0.0 600 0.0 Others 9,300 0.9 17,261 1.2 35,713 1.7 41,157 1.4 44,741 1.3 49,740 1.2 50,770 1.1 43,300 0.8 Total 993,004 1,458,213 2,065,837 2,932,805 3,522,832 4,257,755 4,822,938 5,362,800 1 Source: [1]. 2 Source: [2]. 3 Source: [3]. 4 Source: [4]. 5 Source: [5]. 6 Source: [6]. 7 Source: [7]. 8 Source: [8] Languages
Kyrgyz - 64.7%, Uzbek - 13.6% Russian - 12.5%, Dungun 1%, other 8.2% (census 1999)
In March 1996, the Kyrgyzstani legislature amended the constitution to make Russian an official language, along with Kyrgyz, in territories and work places where Russian-speaking citizens predominate.
Religions
Main article: Religion in KyrgyzstanMuslim are 75%, Russian Orthodox are 20%, and other are 5% of the Population (1999 census).
CIA World Factbook demographic statistics
- Data from CIA World Factbook, unless otherwise indicated.
Sex ratio
at birth: 1.05 male(s)/female
under 15 years: 1.04 male(s)/female
15–64 years: 0.96 male(s)/female
65 years and over: 0.64 male(s)/female
total population: 0.96 male(s)/female (2009 est.)Infant mortality rate
Total 31.26 deaths/1,000 live births
Male 36.19 deaths/1,000 live births
Female 26.06 deaths/1,000 live births (2009 est.)Life expectancy at birth
total population: 69.43 years
male: 65.43 years
female: 73.64 years (2009 est.)Nationality
noun: Kyrgyzstani(s)
adjective: KyrgyzstaniLiteracy
definition: age 15 and over can read and write
total population: 98.7%
male: 99.3%
female: 98.1% (1999 census)see also
References
 Demographics of Kyrgyzstan
Ethnic groups Major groupsKyrgyz (71.0%) · Uzbeks (14.3%) · Russians (7.8%) · Dungans (1.1%) · Uyghurs (0.9%) · Tajiks (0.9%) · Turks (0.7%) · Tatars (0.6%) · Kazakhs (0.6%) · Ukrainians (0.4%) · Koreans (0.3%) · Azeris (0.3%) · Germans (0.2%)Smaller groupsReligion Ethnic group statistics according to the 2009 census [9] Ethnic groups in Asia Sovereign
states- Afghanistan
- Armenia
- Azerbaijan
- Bahrain
- Bangladesh
- Bhutan
- Brunei
- Burma (Myanmar)
- Cambodia
- People's Republic of China
- Cyprus
- East Timor (Timor-Leste)
- Egypt
- Georgia
- India
- Indonesia
- Iran
- Iraq
- Israel
- Japan
- Jordan
- Kazakhstan
- North Korea
- South Korea
- Kuwait
- Kyrgyzstan
- Laos
- Lebanon
- Malaysia
- Maldives
- Mongolia
- Nepal
- Oman
- Pakistan
- Philippines
- Qatar
- Russia
- Saudi Arabia
- Singapore
- Sri Lanka
- Syria
- Tajikistan
- Thailand
- Turkey
- Turkmenistan
- United Arab Emirates
- Uzbekistan
- Vietnam
- Yemen
States with limited
recognition- Abkhazia
- Nagorno-Karabakh
- Northern Cyprus
- Palestine
- Republic of China (Taiwan)
- South Ossetia
Dependencies and
other territories- Christmas Island
- Cocos (Keeling) Islands
- Hong Kong
- Macau
Categories:


Wikimedia Foundation. 2010.